Grafana
This, the next "article" (on Loki), and the successive one (on Vector), are occurring mostly in parallel so that I can validate these services as I go.
I (minimally) set up Vector first, then Loki, then Grafana, just to verify I could pass info around in some coherent fashion and see it in Grafana. However, that's not really sufficient.
The fact is that I'm not really experienced with Grafana. I've used it to debug things, I've installed and managed it, I've created and updated dashboards, etc. But I don't have a deep understanding of it or its featureset.
At work, we use Datadog. I love Datadog. Datadog has incredible features and a wonderful user interface. Datadog makes more money than I do, and costs more than I can afford. Also, they won't hire me, but I'm not bitter. The fact is that they don't really have a hobbyist tier, or at least not one that makes a ten-node cluster affordable.
At work, I prioritize observability. I rely heavily on logs, metrics, and traces to do my job. In my work on Goldentooth, I've been neglecting that. I've been using journalctl to review logs and debug services, and that's a pretty poor experience. It's recently become very, very clear that I need to have a better system here, and that means learning how to use Grafana and how to configure it best for my needs.
So, yeah, Grafana.
Grafana
My initial installation was bog-standard, basic Grafana. Not a thing changed. It worked! Okay, let's make it better.
The first thing I did was to throw that SQLite DB on a tmpfs. I'm not really concerned enough about the volume or load to consider moving to something like PostgreSQL, but 1) it also doesn't matter if I keep logs/metrics past a reboot, and 2) it's probably good to avoid any writes to the SD card that I can.
Next thing was to create a new repository, grafana-dashboards, to manage dashboards. I want a bunch of these dudes and it's better to manage them in a separate repository than in Ansible itself. I checked it out via Git, added a script to sync the repo every so often, added that to cron.
Of course, then I needed a dashboard to test it out, so I grabbed a nice one to incorporate data from Prometheus Node Exporter here. (Thanks, Ricardo F!)
Then I had to connect Grafana to Prometheus Node Exporter, then I realized I was missing a couple of command-line arguments in my Prometheus Node Exporter Helm chart that were nice to have, so I added those to the Argo CD Application, re-synced the app, etc, and finally things started showing up.
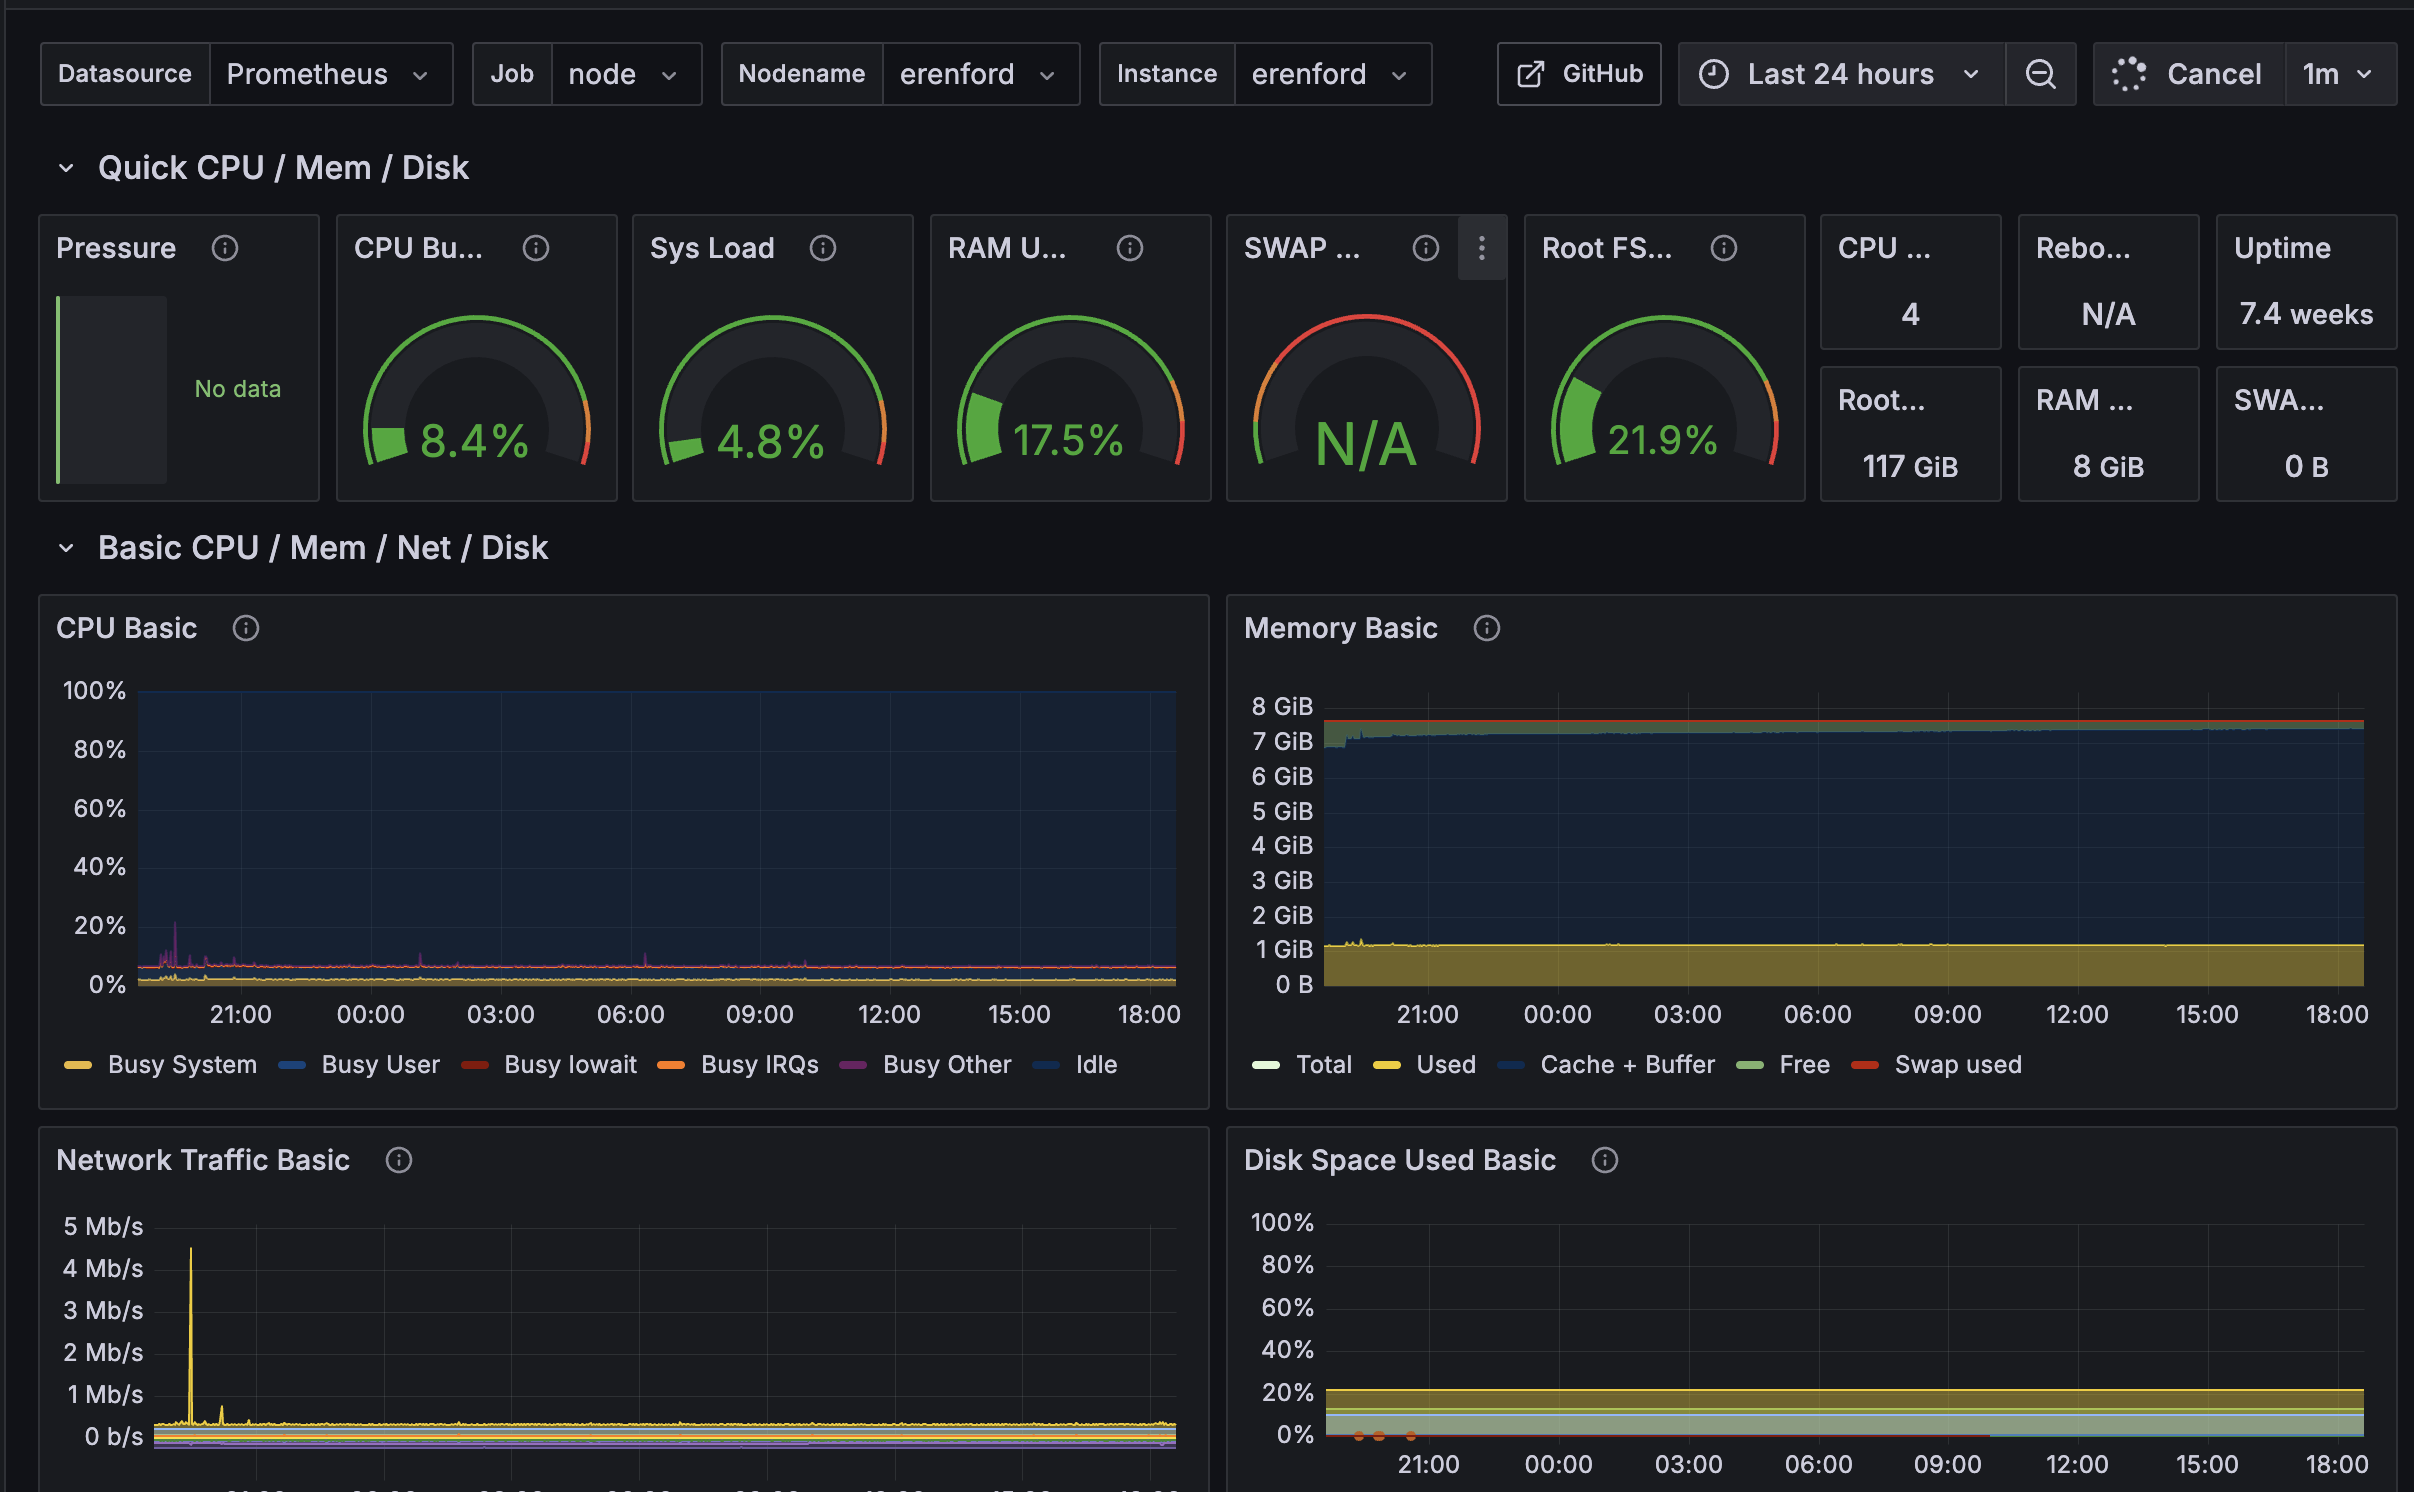
Pretty cool, I think.
Grafana Implementation Details
tmpfs Database Configuration
The first optimization I implemented was mounting the Grafana data directory on tmpfs to avoid SD card writes:
- name: 'Manage the mount for the Grafana data directory.'
  ansible.posix.mount:
    path: '/var/lib/grafana'
    src: 'tmpfs'
    fstype: 'tmpfs'
    opts: 'size=100M,mode=0755'
    state: 'present'
This configuration:
- Avoids SD card wear: Eliminates database writes to flash storage
- Improves performance: RAM-based storage for faster access
- Ephemeral data: Acceptable for a lab environment where persistence across reboots isn't critical
- Size limit: 100MB allocation prevents memory exhaustion
TLS Configuration
I finished up by adding comprehensive TLS support to Grafana using Step-CA integration:
Server Configuration (in grafana.ini):
[server]
protocol = https
http_addr = {{ ipv4_address }}
http_port = 3000
cert_file = {{ grafana.cert_path }}
cert_key = {{ grafana.key_path }}

[grpc_server]
use_tls = true
cert_file = {{ grafana.cert_path }}
key_file = {{ grafana.key_path }}
Certificate Management:
- Source: Step-CA issued certificates with 24-hour validity
- Renewal: Automatic via
cert-renewer@grafana.timer - Service Integration: Automatic Grafana restart after certificate renewal
- Paths:
/opt/grafana/tls/tls.crtand/opt/grafana/tls/tls.key
Dashboard Repository Management
Next thing was to create a new repository, grafana-dashboards, to manage dashboards externally:
Repository Integration:
- name: 'Check out the Grafana dashboards repository.'
  ansible.builtin.git:
    repo: "https://github.com/{{ cluster.github.organization }}/{{ grafana.provisioners.dashboards.repository_name }}.git"
    dest: '/var/lib/grafana/dashboards'
  become_user: 'grafana'
Dashboard Provisioning (provisioners.dashboards.yaml):
apiVersion: 1
providers:
  - name: "grafana-dashboards"
    orgId: 1
    type: file
    folder: ''
    disableDeletion: false
    updateIntervalSeconds: 15
    allowUiUpdates: true
    options:
      path: /var/lib/grafana/dashboards
      foldersFromFilesStructure: true
Automatic Dashboard Updates
I added a script to sync the repository periodically via cron:
Update Script (/usr/local/bin/grafana-update-dashboards.sh):
#!/usr/bin/env bash
dashboard_path="/var/lib/grafana/dashboards"
cd "${dashboard_path}"
git fetch --all
git reset --hard origin/master
git pull
Cron Integration: Updates every 15 minutes to keep dashboards current with the repository
Data Source Provisioning
The Prometheus integration is configured through automatic data source provisioning:
datasources:
  - name: 'Prometheus'
    type: 'prometheus'
    access: 'proxy'
    url: http://{{ groups['prometheus'] | first }}:9090
    jsonData:
      httpMethod: POST
      manageAlerts: true
      prometheusType: Prometheus
      cacheLevel: 'High'
      disableRecordingRules: false
      incrementalQueryOverlapWindow: 10m
This configuration:
- Automatic discovery: Uses Ansible inventory to find Prometheus server
- High performance: POST method and high cache level for better performance
- Alert management: Enables Grafana to manage Prometheus alerts
- Query optimization: 10-minute overlap window for incremental queries
Advanced Monitoring Integration
Loki Integration for State History:
[unified_alerting.state_history]
backend = "multiple"
primary = "loki"
loki_remote_url = "https://{{ groups['loki'] | first }}:3100"
This enables:
- Alert state history: Stored in Loki for long-term retention
- Multi-backend support: Primary storage in Loki with annotations fallback
- HTTPS integration: Secure communication with Loki using Step-CA certificates
Security and Authentication
Password Management:
- name: 'Reset Grafana admin password.'
  ansible.builtin.command:
    cmd: grafana-cli admin reset-admin-password "{{ grafana.admin_password }}"
Security Headers: The configuration includes comprehensive security settings:
- TLS enforcement: HTTPS-only communication
- Cookie security: Secure cookie settings for HTTPS
- Content security: XSS protection and content type options enabled
Service Integration
Certificate Renewal Automation:
[Service]
Environment=CERT_LOCATION=/opt/grafana/tls/tls.crt \
            KEY_LOCATION=/opt/grafana/tls/tls.key

# Restart Grafana service after certificate renewal
ExecStartPost=/usr/bin/env sh -c "! systemctl --quiet is-active grafana.service || systemctl try-reload-or-restart grafana.service"
Systemd Integration:
- Service runs as dedicated
grafanauser - Automatic startup and dependency management
- Integration with cluster-wide certificate renewal system
Dashboard Ecosystem
Of course, then I needed a dashboard to test it out, so I grabbed a nice one to incorporate data from Prometheus Node Exporter here. (Thanks, Ricardo F!)
The dashboard management system provides:
- Version control: All dashboards tracked in Git
- Automatic updates: Regular synchronization from repository
- Folder organization: File system structure maps to Grafana folders
- Community integration: Easy incorporation of community dashboards
Monitoring Stack Integration
Then I had to connect Grafana to Prometheus Node Exporter, then I realized I was missing a couple of command-line arguments in my Prometheus Node Exporter Helm chart that were nice to have, so I added those to the Argo CD Application, re-synced the app, etc, and finally things started showing up.
Node Exporter Enhancement:
- Additional collectors:
--collector.systemd,--collector.processes - GitOps deployment: Changes managed through Argo CD
- Automatic synchronization: Dashboard updates reflect new metrics immediately
This comprehensive Grafana setup provides a production-ready observability platform that integrates seamlessly with the broader goldentooth monitoring ecosystem, combining security, automation, and extensibility.