Introduction
Who am I?

A portrait of the author in the form he will assume over the course of this project, having returned to our time to warn his present self against pursuing this course of action.
My name is Nathan Douglas. The best source of information about my electronic life is probably my GitHub profile. It almost certainly would not be my LinkedIn profile. I also have a blog about non-computer-related stuff here.
What Do I Do?
 The author in his eventual form advising the author in his present form not to do the thing, and why.
I've been trying to get computers to do what I want, with mixed success, since the early mid-nineties. I earned my Bachelor's in Computer Science from the University of Nevada at Las Vegas in 2011, and I've been working as a Software/DevOps engineer ever since, depending on gig.
I consider DevOps a methodology and a role, in that I try to work in whatever capacity I can to improve the product delivery lifecycle and shorten delivery lead time. I generally do the work that is referred to as "DevOps" or "platform engineering" or "site reliability engineering", but I try to emphasize the theoretical aspects, e.g. Lean Management, sytems thinking, etc. That's not to say that I'm an expert, but just that I try to keep the technical details grounded in the philosophical justifications, the big picture.
Update (2025-04-05): At present I consider myself more of a platform engineer. I'm trying to move into an MLOps space, though, and from there into High-Performance Computing. I also would like to eventually shift into deep tech research and possibly get my PhD in mathematics or computer science.
Background

"What would you do if you had an AMD K6-2 333MHz and 96MB RAM?" "I'd run two copies of Windows 98, my dude."
At some point in the very early 00's, I believe, I first encountered VMWare and the idea that I could run a computer inside of another computer. That wasn't the first time I'd encountered a virtual machine -- I'd played with Java in the '90's, and played Zork and other Infocom and Inform games -- but it might've been the first time that I really understood the idea.
And I made use of it. For a long time – most of my twenties – I was occupied by a writing project. I maintained a virtual machine that ran a LAMP server and hosted various content management systems and related technologies: raw HTML pages, MediaWiki, DokuWiki, Drupal, etc, all to organize my thoughts on this and other projects. Along the way, I learned a whole lot about this sort of deployment: namely, that it was a pain in the ass.
I finally abandoned that writing project around the time Docker came out. I immediately understood what it was: a less tedious VM. (Admittedly, my understanding was not that sophisticated.) I built a decent set of skills with Docker and used it wherever I could. I thought Docker was about as good as it got.
At some point around 2016 or 2017, I became aware of Kubernetes. I immediately built a 4-node cluster with old PCs, doing a version of Kubernetes the Hard Way on bare metal, and then shifted to a custom system with four VMWare VMs that PXE booted, setup a CoreOS configuration with Ignition and what was then called Matchbox, and formed into a self-healing cluster with some neat toys like GlusterFS, etc. Eventually, though, I started neglecting the cluster and tore it down.
Around 2021, my teammates and I started considering a Kubernetes-based infrastructure for our applications, so I got back into it. I set up a rather complicated infrastructure on a three-node Proxmox VE cluster that would create three three-node Kubernetes clusters using LXC containers. From there I explored ArgoCD and GitOps and Helm and some other things that I hadn't really played with before. But again, my interest waned and the cluster didn't actually get much action.
A large part of this, I think, is that I didn't trust it to run high-FAF (Family Acceptance Factor) apps, like Plex, etc. After all, this was supposed to be a cluster I could tinker with, and tear down and destroy and rebuild at any time with a moment's notice. So in practice, this ended up being a toy cluster.
And while I'd gone through Kubernetes the Hard Way (twice!), I got the irritating feeling that I hadn't really learned all that much. I'd done Linux From Scratch, and had run Gentoo for several years, so I was no stranger to the idea of following a painfully manual process filled with shell commands and waiting for days for my computer to be useful again. And I did learn a lot from all three projects, but, for whatever reason, it didn't stick all that well.
Motivation
In late 2023, my team's contract concluded, and there was a possibility I might be laid off. My employer quickly offered me a position on another team, which I happily and gratefully accepted, but I had already applied to several other positions. I had some promising paths forward, but... not as many as I would like. It was an unnerving experience.
Not everyone is using Kubernetes, of course, but it's an increasingly essential skill in my field. There are other skills I have – Ansible, Terraform, Linux system administration, etc – but I'm not entirely comfortable with my knowledge of Kubernetes, so I'd like to deepen and broaden that as effectively as possible.
Goals
I want to get really good at Kubernetes. Not just administering it, but having a good understanding of what is going on under the hood at any point, and how best to inspect and troubleshoot and repair a cluster.
I want to have a fertile playground for experimenting; something that is not used for other purposes, not expected to be stable, ideally not even accessed by anyone else. Something I can do the DevOps equivalent of destroy with an axe, without consequences.
I want to document everything I've learned exhaustively. I don't want to take a command for granted, or copy and paste, or even copying and pasting after nodding thoughtfully at a wall of text. I want to embed things deeply into my thiccc skull.
Generally, I want to be beyond prepared for my CKA, CKAD, and CKS certification exams. I hate test anxiety. I hate feeling like there are gaps in my knowledge. I want to go in confident, and I want my employers and teammates to be confident of my abilities.
Approach
This is largely going to consist of me reading documentation and banging my head against the wall. I'll provide links to the relevant information, and type out the commands, but I also want to persist this in Infrastructure-as-Code. Consequently, I'll link to Ansible tasks/roles/playbooks for each task as well.
Cluster Hardware
I went with a PicoCluster 10H. I'm well aware that I could've cobbled something together and spent much less money; I have indeed done the thing with a bunch of Raspberry Pis screwed to a board and plugged into an Anker USB charger and a TP-Link switch.
I didn't want to do that again, though. For one, I've experienced problems with USB chargers seeming to lose power over time, and some small switches getting flaky when powered from USB. I liked the power supply of the PicoCluster and its cooling configuration. I liked that it did pretty much exactly what I wanted, and if I had problems I could yell at someone else about it rather than getting derailed by hardware rabbit holes.
I also purchased ten large heatsinks with fans, specifically these. There were others I liked a bit more, and these interfered with the standoffs that were used to build each stack of five Raspberry Pis, but these seemed as though they would likely be the most reliable in the long run.
I purchased SanDisk 128GB Extreme microSDXC cards for local storage. I've been using SanDisk cards for years with no significant issues or complaints.
The individual nodes are Raspberry Pi 4B/8GB. As of the time I'm writing this, Raspberry Pi 5s are out, and they offer very substantial benefits over the 4B. That said, they also have higher energy consumption, lower availability, and so forth. I'm opting for a lower likelihood of surprises because, again, I just don't want to spend much time dealing with hardware and I don't expect performance to hinder me.
Technical Specifications
Complete Node Inventory
The cluster consists of 13 nodes with specific roles and configurations:
Raspberry Pi Nodes (12 total):
- allyrion (10.4.0.10) - Pi4B - NFS server, HAProxy load balancer, Docker host
- bettley (10.4.0.11) - Pi4B - Kubernetes control plane, Consul server, Vault server
- cargyll (10.4.0.12) - Pi4B - Kubernetes control plane, Consul server, Vault server
- dalt (10.4.0.13) - Pi4B - Kubernetes control plane, Consul server, Vault server
- erenford (10.4.0.14) - Pi4B - Kubernetes worker, Ray head node, ZFS storage
- fenn (10.4.0.15) - Pi4B - Kubernetes worker, Ceph storage node
- gardener (10.4.0.16) - Pi4B - Kubernetes worker, Grafana host, ZFS storage
- harlton (10.4.0.17) - Pi4B - Kubernetes worker
- inchfield (10.4.0.18) - Pi5 - Kubernetes worker, Loki log aggregation
- jast (10.4.0.19) - Pi5 - Kubernetes worker, Step-CA certificate authority
- karstark (10.4.0.20) - Pi5 - Kubernetes worker, Ceph storage node
- lipps (10.4.0.21) - Pi5 - Kubernetes worker, Ceph storage node
x86 GPU Node:
- velaryon (10.4.0.30) - AMD Ryzen 9 3900X, 32GB RAM, NVIDIA RTX 2070 Super
Hardware Architecture
Raspberry Pi 4B Specifications:
- CPU: ARM Cortex-A72 quad-core @ 2.0GHz (overclocked from 1.5GHz)
- RAM: 8GB LPDDR4
- Storage: SanDisk 128GB Extreme microSDXC (UHS-I Class 10)
- Network: Gigabit Ethernet (onboard)
- GPIO: Used for fan control (pin 14) and hardware monitoring
Performance Optimizations:
arm_freq=2000
over_voltage=6
These overclocking settings provide approximately 33% performance increase while maintaining thermal stability with active cooling.
Raspberry Pi 5 Specifications:
- CPU: ARM Cortex-A76 quad-core @ 2.4GHz
- RAM: 8GB LPDDR4X
- Storage: SanDisk 256GB Extreme microSDXC (UHS-I Class 10), 1TB NVMe SSD
- Network: Gigabit Ethernet (onboard)
- GPIO: Used for fan control (pin 14) and hardware monitoring
Network Infrastructure
Network Segmentation:
- Infrastructure CIDR:
10.4.0.0/20- Physical network backbone - Service CIDR:
172.16.0.0/20- Kubernetes virtual services - Pod CIDR:
192.168.0.0/16- Container networking - MetalLB Range:
10.4.11.0/24- Load balancer IP allocation
MAC Address Registry: Each node has documented MAC addresses for network boot and management:
- Raspberry Pi nodes:
d8:3a:dd:*anddc:a6:32:*prefixes - x86 node:
2c:f0:5d:0f:ff:39(velaryon)
Storage Architecture
Distributed Storage Strategy:
NFS Shared Storage:
- Server: allyrion exports
/mnt/usb1 - Clients: All 13 nodes mount at
/mnt/nfs - Use Cases: Configuration files, shared datasets, cluster coordination
ZFS Storage Pool:
- Nodes: allyrion, erenford, gardener
- Pool:
rpoolwithrpool/datadataset - Features: Snapshots, replication, compression
- Optimization: 128MB ARC limit for Raspberry Pi RAM constraints
Ceph Distributed Storage:
- Nodes: fenn, karstark, lipps
- Purpose: Highly available distributed block and object storage
- Integration: Kubernetes persistent volumes
Thermal Management
Cooling Configuration:
- Heatsinks: Large aluminum heatsinks with 40mm fans per node
- Fan Control: GPIO-based temperature control at 60°C threshold
- Airflow: PicoCluster chassis provides directed airflow path
- Monitoring: Temperature sensors exposed via Prometheus metrics
Thermal Performance:
- Idle: ~45-50°C ambient
- Load: ~60-65°C under sustained workload
- Throttling: No thermal throttling observed during normal operations
Power Architecture
Power Supply:
- Input: Single AC connection to PicoCluster power distribution
- Per Node: 5V/3A regulated power (avoiding USB charger degradation)
- Efficiency: ~90% efficiency at typical load
- Redundancy: Single point of failure by design (acceptable for lab environment)
Power Consumption:
- Raspberry Pi: ~8W idle, ~15W peak per node
- Total Pi Load: ~96W idle, ~180W peak (12 nodes)
- x86 Node: ~150W idle, ~300W peak
- Cluster Total: ~250W idle, ~480W peak
Hardware Monitoring
Metrics Collection:
- Node Exporter: Hardware sensors, thermal data, power metrics
- Prometheus: Centralized metrics aggregation
- Grafana: Real-time dashboards with thermal and performance alerts
Monitored Parameters:
- CPU temperature and frequency
- Memory usage and availability
- Storage I/O and capacity
- Network interface statistics
- Fan speed and cooling device status
Reliability Considerations
Hardware Resilience:
- No RAID: Individual node failure acceptable (distributed applications)
- Network Redundancy: Single switch (acceptable for lab)
- Power Redundancy: Single PSU (lab environment limitation)
- Cooling Redundancy: Individual fan failure affects single node only
Failure Recovery:
- Kubernetes: Automatic pod rescheduling on node failure
- Consul/Vault: Multi-node quorum survives single node loss
- Storage: ZFS replication and Ceph redundancy provide data protection
Future Expansion
Planned Upgrades:
- SSD Storage: USB 3.0 SSD expansion for high-IOPS workloads
- Network Upgrades: Potential 10GbE expansion via USB adapters
- Additional GPU: PCIe expansion for ML workloads
Frequently Asked Questions
So, how do you like the PicoCluster so far?
I have no complaints. Putting it together was straightforward; the documentation was great, everything was labeled correctly, etc. Cooling seems very adequate and performance and appearance are perfect.
The integrated power supply has been particularly reliable compared to previous experiences with USB charger-based setups. The structured cabling and chassis design make maintenance and monitoring much easier than ad-hoc Raspberry Pi clusters.
Have you considered adding SSDs for mass storage?
Yes, and I have some cables and spare SSDs for doing so. I'm not sure if I actually will. We'll see.
The current storage architecture with ZFS pools on USB-attached SSDs and distributed Ceph storage has proven adequate for most workloads. The microSD cards handle the OS and container storage well, while shared storage needs are met through the NFS and distributed storage layers.
Meet the Nodes
It's generally frowned upon nowadays to treat servers like "pets" as opposed to "cattle". And, indeed, I'm trying not to personify these little guys too much, but... you can have my custom MOTD, hostnames, and prompts when you pry them from my cold, dead fingers.
The nodes are identified with a letter A-J and labeled accordingly on the ethernet port so that if one needs to be replaced or repaired, that can be done with a minimum of confusion. Then, I gave each the name of a noble house from A Song of Ice and Fire and gave it a MOTD (based on the coat of arms) and a themed Bash prompt.
In my experience, when I'm working in multiple servers simultaneously, it's good for me to have a bright warning sign letting me know, as unambiguously as possible, what server I'm actually logged in on. (I've never blown up prod thinking it was staging, but if I'm shelled into prod I'm deeply concerned about that possibility)
This is just me being a bit over-the-top, I guess.
✋ Allyrion
🐞 Bettley
🦢 Cargyll
🍋 Dalt
🦩 Erenford
🌺 Fenn
🧤 Gardener
🌳 Harlton
🏁 Inchfield
🦁 Jast
Node Configuration
After physically installing and setting up the nodes, the next step is to perform basic configuration. You can see the Ansible playbook I use for this, which currently runs the following roles:
goldentooth.configure:- Set timezone; last thing I need to do when working with computers is having to perform arithmetic on times and dates.
- Set keybord layout; this should be set already, but I want to be sure.
- Enable overclocking; I've installed an adequate cooling system to support the Pis running full-throttle at their full spec clock.
- Enable fan control; the heatsinks I've installed include fans to prevent CPU throttling under heavy load.
- Enable and configure certain cgroups; this allows Kubernetes to manage and limit resources on the system.
cpuset: This is used to manage the assignment of individual CPUs (both physical and logical) and memory nodes to tasks running in a cgroup. It allows for pinning processes to specific CPUs and memory nodes, which can be very useful in a containerized environment for performance tuning and ensuring that certain processes have dedicated CPU time. Kubernetes can use cpuset to ensure that workloads (containers/pods) have dedicated processing resources. This is particularly important in multi-tenant environments or when running workloads that require guaranteed CPU cycles. By controlling CPU affinity and ensuring that processes are not competing for CPU time, Kubernetes can improve the predictability and efficiency of applications.memory: This is used to limit the amount of memory that tasks in a cgroup can use. This includes both RAM and swap space. It provides mechanisms to monitor memory usage and enforce hard or soft limits on the memory available to processes. When a limit is reached, the cgroup can trigger OOM (Out of Memory) killer to select and kill processes exceeding their allocation. Kubernetes uses the memory cgroup to enforce memory limits specified for pods and containers, preventing a single workload from consuming all available memory, which could lead to system instability or affect other workloads. It allows for better resource isolation, efficient use of system resources, and ensures that applications adhere to their specified resource limits, promoting fairness and reliability.hugetlb: This is used to manage huge pages, a feature of modern operating systems that allows the allocation of memory in larger blocks (huge pages) compared to standard page sizes. This can significantly improve performance for certain workloads by reducing the overhead of page translation and increasing TLB (Translation Lookaside Buffer) hits. Some applications, particularly those dealing with large datasets or high-performance computing tasks, can benefit significantly from using huge pages. Kubernetes can use it to allocate huge pages to these workloads, improving performance and efficiency. This is not going to be a concern for my use, but I'm enabling it anyway simply because it's recommended.
- Disable swap. Kubernetes doesn't like swap by default, and although this can be worked around, I'd prefer to avoid swapping on SD cards. I don't really expect a high memory pressure condition anyway.
- Set preferred editor; I like
nano, although I can (after years of practice) safely and reliably exitvi. - Set certain kernel modules to load at boot:
overlay: This supports OverlayFS, a type of union filesystem. It allows one filesystem to be overlaid on top of another, combining their contents. In the context of containers, OverlayFS can be used to create a layered filesystem that combines multiple layers into a single view, making it efficient to manage container images and writable container layers.br_netfilter: This allows bridged network traffic to be filtered by iptables and ip6tables. This is essential for implementing network policies, including those related to Network Address Translation (NAT), port forwarding, and traffic filtering. Kubernetes uses it to enforce network policies that control ingress and egress traffic to pods and between pods. This is crucial for maintaining the security and isolation of containerized applications. It also enables the necessary manipulation of traffic for services to direct traffic to pods, and for pods to communicate with each other and the outside world. This includes the implementation of services, load balancing, and NAT for pod networking. And by allowing iptables to filter bridged traffic, br_netfilter helps Kubernetes manage network traffic more efficiently, ensuring consistent network performance and reliability across the cluster.
- Load above kernel modules on every boot.
- Set some kernel parameters:
net.bridge.bridge-nf-call-iptables: This allows iptables to inspect and manipulate the traffic that passes through a Linux bridge. A bridge is a way to connect two network segments, acting somewhat like a virtual network switch. When enabled, it allows iptables rules to be applied to traffic coming in or going out of a bridge, effectively enabling network policies, NAT, and other iptables-based functionalities for bridged traffic. This is essential in Kubernetes for implementing network policies that control access to and from pods running on the same node, ensuring the necessary level of network isolation and security.net.bridge.bridge-nf-call-ip6tables: As above, but for IPv6 traffic.net.ipv4.ip_forward: This controls the ability of the Linux kernel to forward IP packets from one network interface to another, a fundamental capability for any router or gateway. Enabling IP forwarding is crucial for a node to route traffic between pods, across different nodes, or between pods and the external network. It allows the node to act as a forwarder or router, which is essential for the connectivity of pods across the cluster, service exposure, and for pods to access the internet or external resources when necessary.
- Add SSH public key to
root's authorized keys; this is already performed for my normal user by Raspberry Pi Imager.
goldentooth.set_hostname: Set the hostname of the node (including a line in/etc/hosts). This doesn't need to be a separate role, obviously. I just like the structure as I have it.goldentooth.set_motd: Set the MotD, as described in the previous chapter.goldentooth.set_bash_prompt: Set the Bash prompt, as described in the previous chapter.goldentooth.setup_security: Some basic security configuration. Currently, this just uses Jeff Geerling'sansible-role-securityto perform some basic tasks, like setting up unattended upgrades, etc, but I might expand this in the future.
Raspberry Pi Imager doesn't allow you to specify an SSH key for the root user, so I do this in goldentooth.configure. However, I also have Kubespray installed (for when I want things to Just Work™), and Kubespray expects the remote user to be root. As a result, I specify that the remote user is my normal user account in the configure_cluster playbook. This means a lot of become: true in the roles, but I would prefer eventually to ditch Kubespray and disallow root login via SSH.
Anyway, we need to rerun goldentooth.set_bash_prompt, but as the root user. This almost never matters, since I prefer to SSH as a normal user and use sudo, but I like my prompts and you can't take them away from me.
With the nodes configured, we can start talking about the different roles they will serve.
Cluster Roles and Responsibilities
Observations:
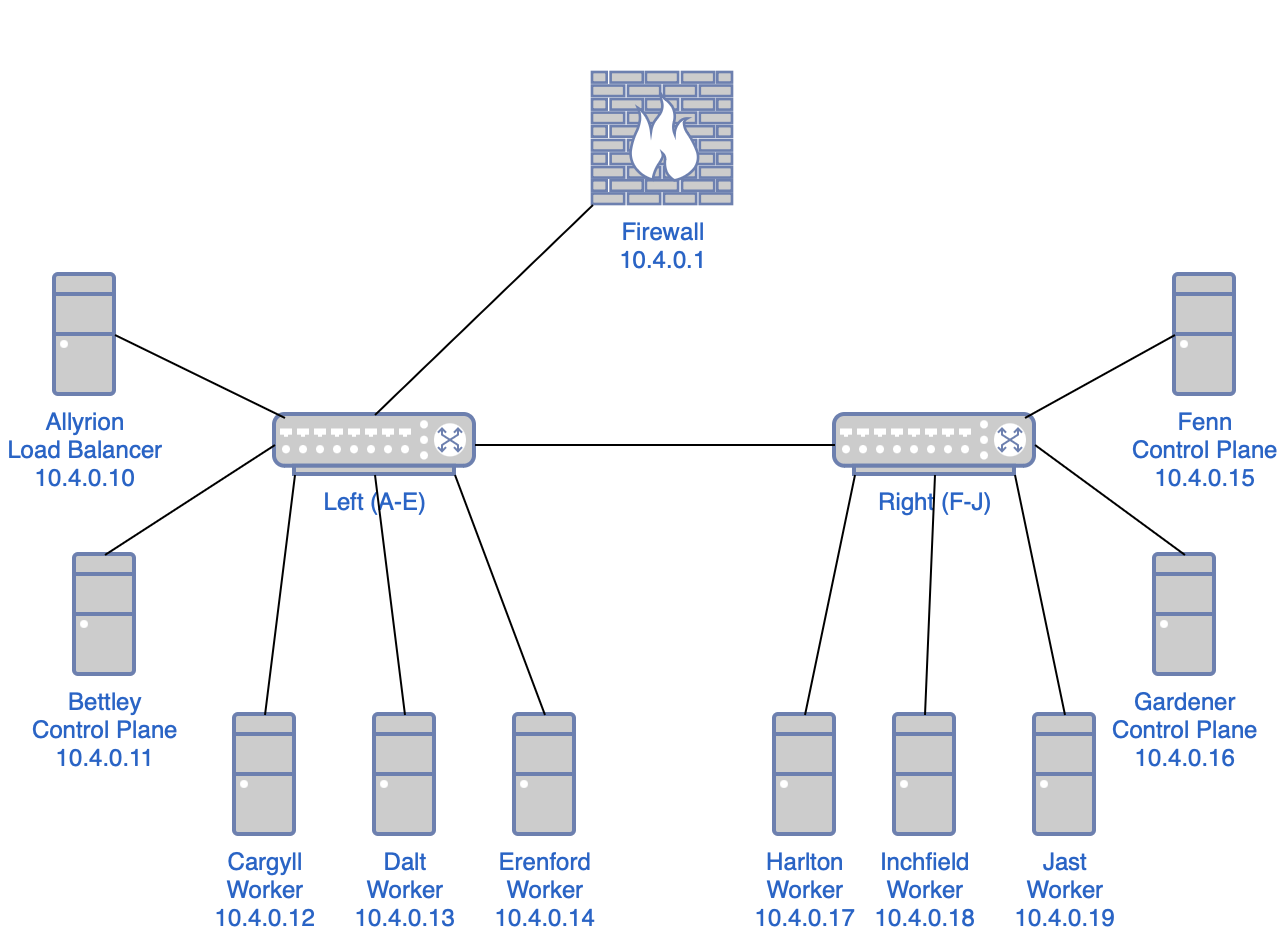
- The cluster has a single power supply but two power distribution units (PDUs) and two network switches, so it seems reasonable to segment the cluster into left and right halves.
- I want high availability, which requires a control plane capable of a quorum, so a minimum of three nodes in the control plane.
- I want to use a dedicated external load balancer for the control plane rather than configure my existing Opnsense firewall/router. (I'll have to do that to enable MetalLB via BGP, sadly.)
- So that would yield one load balancer, three control plane nodes, and six worker nodes.
- With the left-right segmentation, I can locate one load balancer and one control plane node on the left side, two control plane nodes on the right side, and three worker nodes on each side.
This isn't really high-availability; the cluster has multiple single points of failure:
- the load balancer node
- whichever network switch is connected to the upstream
- the power supply
- the PDU powering the LB
- the PDU powering the upstream switch
- etc.
That said, I find those acceptable given the nature of this project.
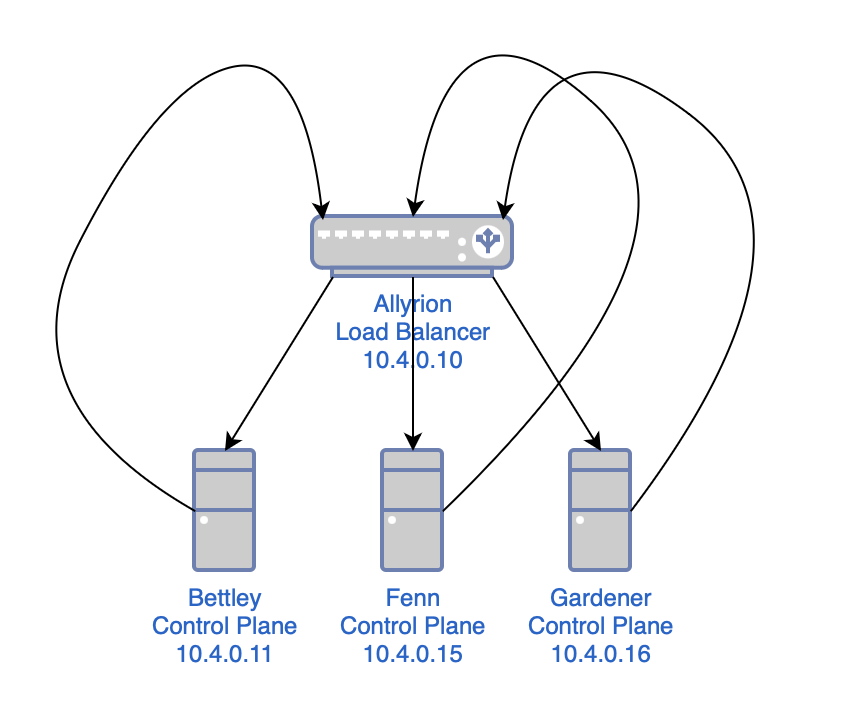
Load Balancer
Allyrion, the first node alphabetically and the top node on the left side, will run a load balancer. I had a number of options here, but I ended up going with HAProxy. HAProxy was my introduction to load balancing, reverse proxying, and so forth, and I have kind of a soft spot for it.
I'd also considered Traefik, which I use elsewhere in my homelab, but I believe I'll use it as an ingress controller. Similarly, I think I prefer to use Nginx on a per-application level. I'm pursuing this project first and foremost to learn and to document my learning, and I'd prefer to cover as much ground as possible, and as clearly as possible, and I believe I can do this best if I don't have to worry about having to specify which installation of $proxy I'm referring to at any given time.
So:
- HAProxy: Load balancer
- Traefik: Ingress controller
- Nginx: Miscellaneous
Control Plane
Bettley (the second node on the left side), Gardener, and Harlton (the first and second nodes on the right side) will be the control plane nodes.
It's common, in small home Kubernetes clusters, to remove the control plane taint (node-role.kubernetes.io/control-plane) to allow miscellaneous pods to be scheduled on the control plane nodes. I won't be doing that here; six worker nodes should be sufficient for my purposes, and I'll try (where possible and practical) to follow best practices. That said, I might find some random fun things to run on my control plane nodes, and I'll adjust their tolerations accordingly.
Workers
The remaining nodes (Cargyll, Dalt, and Erenford on the left, and Harlton, Inchfield, and Jast on the right) are dedicated workers. What sort of workloads will they run?
Well, probably nothing interesting. Not Plex, not torrent clients or *darrs. Mostly logging, metrics, and similar. I'll probably end up gathering a lot of data about data. And that's fine – these Raspberry Pis are running off SD cards; I don't really want them to be doing anything interesting anyway.
Network Topology
In case you don't quite have a picture of the infrastructure so far, it should look like this:
Frequently Asked Questions
Why didn't you make Etcd high-availability?
It seems like I'd need that cluster to have a quorum too, so we're talking about three nodes for the control plane, three nodes for Etcd, one for the load balancer, and, uh, three worker nodes. That's a bit more than I'd like to invest, and I'd like to avoid doubling up anywhere (although I'll probably add additional functionality to the load balancer). I'm interested in the etcd side of things, but not really enough to compromise elsewhere. I could be missing something obvious, though; if so, please let me know.
Why didn't you just do A=load balancer, B-D=control plane, and E-J=workers?
I could've and should've and still might. But because I'm a bit of a fool and wasn't really paying attention, I put A-E on the left and F-J on the right, rather than A,C,E,G,I on the left and B,D,F,H,J on the right, which would've been a bit cleaner. As it is, I need to think a second about which nodes are control nodes, since they aren't in a strict alphabetical order.
I might adjust this in the future; it should be easy to do so, after all, I just don't particularly want to take the cluster apart and rebuild it, especially since the standoffs were kind of messy as a consequence of the heatsinks.
Load Balancer
This cluster should have a high-availability control plane, and we can start laying the groundwork for that immediately.
This might sound complex, but all we're doing is:
- creating a load balancer
- configuring the load balancer to use all of the control plane nodes as a list of backends
- telling anything that sends requests to a control plane node to send them to the load balancer instead
As mentioned before, we're using HAProxy as a load balancer. First, though, I'll install rsyslog, a log processing system. It will gather logs from HAProxy and deposit them in a more ergonomic location.
$ sudo apt install -y rsyslog
At least at the time of writing (February 2024), rsyslog on Raspberry Pi OS includes a bit of configuration that relocates HAProxy logs:
# /etc/rsyslog.d/49-haproxy.conf

# Create an additional socket in haproxy's chroot in order to allow logging via
# /dev/log to chroot'ed HAProxy processes
$AddUnixListenSocket /var/lib/haproxy/dev/log

# Send HAProxy messages to a dedicated logfile
:programname, startswith, "haproxy" {
  /var/log/haproxy.log
  stop
}
In Raspberry Pi OS, installing and configuring HAProxy is a simple matter.
$ sudo apt install -y haproxy
Here is the configuration I'm working with for HAProxy at the time of writing (February 2024); I've done my best to comment it thoroughly. You can also see the Jinja2 template and the role that deploys the template to configure HAProxy.
# /etc/haproxy/haproxy.cfg

# This is the HAProxy configuration file for the load balancer in my Kubernetes
# cluster. It is used to load balance the API server traffic between the
# control plane nodes.

# Global parameters
global
  # Sets uid for haproxy process.
  user haproxy
  # Sets gid for haproxy process.
  group haproxy
  # Sets the maximum per-process number of concurrent connections.
  maxconn 4096
  # Configure logging.
  log /dev/log local0
  log /dev/log local1 notice

# Default parameters
defaults
  # Use global log configuration.
  log global

# Frontend configuration for the HAProxy stats page.
frontend stats-frontend
  # Listen on all IPv4 addresses on port 8404.
  bind *:8404
  # Use HTTP mode.
  mode http
  # Enable the stats page.
  stats enable
  # Set the URI to access the stats page.
  stats uri /stats
  # Set the refresh rate of the stats page.
  stats refresh 10s
  # Set the realm to access the stats page.
  stats realm HAProxy\ Statistics
  # Set the username and password to access the stats page.
  stats auth nathan:<redacted>
  # Hide HAProxy version to improve security.
  stats hide-version

# Kubernetes API server frontend configuration.
frontend k8s-api-server
  # Listen on the IPv4 address of the load balancer on port 6443.
  bind 10.4.0.10:6443
  # Use TCP mode, which means that the connection will be passed to the server
  # without TLS termination, etc.
  mode tcp
  # Enable logging of the client's IP address and port.
  option tcplog
  # Use the Kubernetes API server backend.
  default_backend k8s-api-server

# Kubernetes API server backend configuration.
backend k8s-api-server
  # Use TCP mode, not HTTPS.
  mode tcp
  # Sets the maximum time to wait for a connection attempt to a server to
  # succeed.
  timeout connect 10s
  # Sets the maximum inactivity time on the client side. I might reduce this at
  # some point.
  timeout client 86400s
  # Sets the maximum inactivity time on the server side. I might reduce this at
  # some point.
  timeout server 86400s
  # Sets the load balancing algorithm.
  # `roundrobin` means that each server is used in turns, according to their
  # weights.
  balance roundrobin
  # Enable health checks.
  option tcp-check
  # For each control plane node, add a server line with the node's hostname and
  # IP address.
  # The `check` parameter enables health checks.
  # The `fall` parameter sets the number of consecutive health check failures
  # after which the server is considered to be down.
  # The `rise` parameter sets the number of consecutive health check successes
  # after which the server is considered to be up.
  server bettley 10.4.0.11:6443 check fall 3 rise 2
  server fenn 10.4.0.15:6443 check fall 3 rise 2
  server gardener 10.4.0.16:6443 check fall 3 rise 2
This enables the HAProxy stats frontend, which allows us to gain some insight into the operation of the frontend in something like realtime.
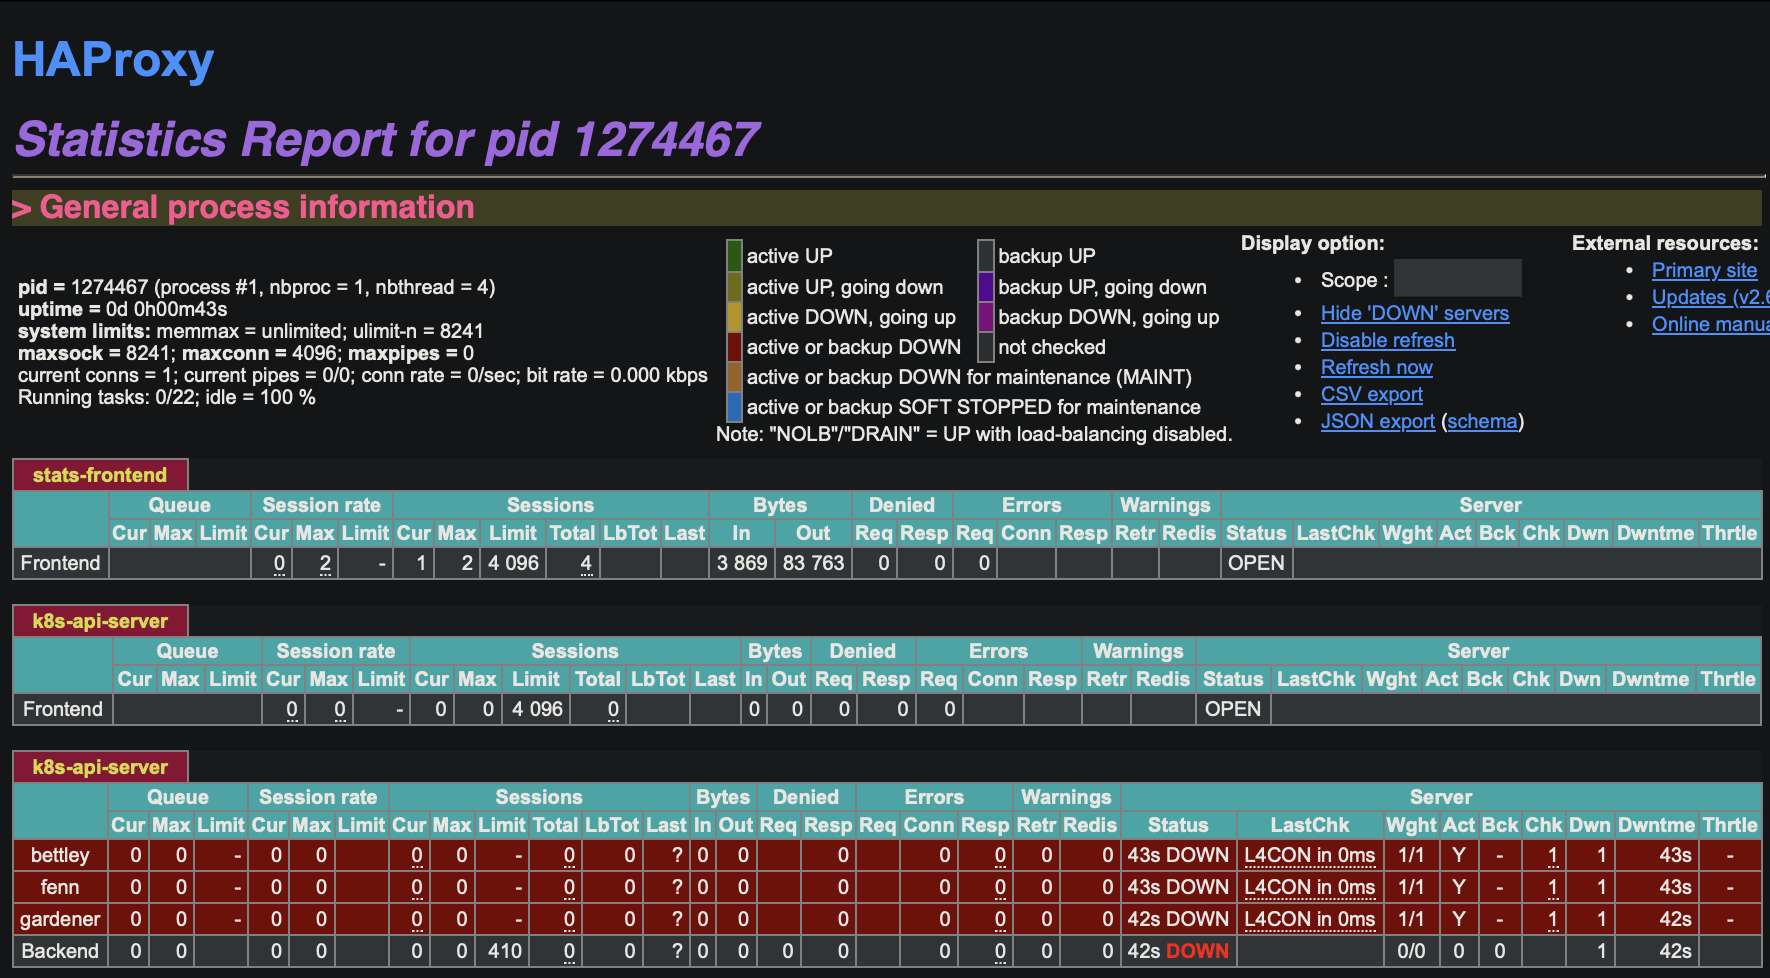
We see that our backends are unavailable, which is of course expected at this time. We can also read the logs, in /var/log/haproxy.log:
$ cat /var/log/haproxy.log
2024-02-21T07:03:16.603651-05:00 allyrion haproxy[1305383]: [NOTICE]   (1305383) : haproxy version is 2.6.12-1+deb12u1
2024-02-21T07:03:16.603906-05:00 allyrion haproxy[1305383]: [NOTICE]   (1305383) : path to executable is /usr/sbin/haproxy
2024-02-21T07:03:16.604085-05:00 allyrion haproxy[1305383]: [WARNING]  (1305383) : Exiting Master process...
2024-02-21T07:03:16.607180-05:00 allyrion haproxy[1305383]: [ALERT]    (1305383) : Current worker (1305385) exited with code 143 (Terminated)
2024-02-21T07:03:16.607558-05:00 allyrion haproxy[1305383]: [WARNING]  (1305383) : All workers exited. Exiting... (0)
2024-02-21T07:03:16.771133-05:00 allyrion haproxy[1305569]: [NOTICE]   (1305569) : New worker (1305572) forked
2024-02-21T07:03:16.772082-05:00 allyrion haproxy[1305569]: [NOTICE]   (1305569) : Loading success.
2024-02-21T07:03:16.775819-05:00 allyrion haproxy[1305572]: [WARNING]  (1305572) : Server k8s-api-server/bettley is DOWN, reason: Layer4 connection problem, info: "Connection refused at initial connection step of tcp-check", check duration: 0ms. 2 active and 0 backup servers left. 0 sessions active, 0 requeued, 0 remaining in queue.
2024-02-21T07:03:16.776309-05:00 allyrion haproxy[1305572]: Server k8s-api-server/bettley is DOWN, reason: Layer4 connection problem, info: "Connection refused at initial connection step of tcp-check", check duration: 0ms. 2 active and 0 backup servers left. 0 sessions active, 0 requeued, 0 remaining in queue.
2024-02-21T07:03:16.776584-05:00 allyrion haproxy[1305572]: Server k8s-api-server/bettley is DOWN, reason: Layer4 connection problem, info: "Connection refused at initial connection step of tcp-check", check duration: 0ms. 2 active and 0 backup servers left. 0 sessions active, 0 requeued, 0 remaining in queue.
2024-02-21T07:03:17.423831-05:00 allyrion haproxy[1305572]: [WARNING]  (1305572) : Server k8s-api-server/fenn is DOWN, reason: Layer4 connection problem, info: "Connection refused at initial connection step of tcp-check", check duration: 0ms. 1 active and 0 backup servers left. 0 sessions active, 0 requeued, 0 remaining in queue.
2024-02-21T07:03:17.424229-05:00 allyrion haproxy[1305572]: Server k8s-api-server/fenn is DOWN, reason: Layer4 connection problem, info: "Connection refused at initial connection step of tcp-check", check duration: 0ms. 1 active and 0 backup servers left. 0 sessions active, 0 requeued, 0 remaining in queue.
2024-02-21T07:03:17.424446-05:00 allyrion haproxy[1305572]: Server k8s-api-server/fenn is DOWN, reason: Layer4 connection problem, info: "Connection refused at initial connection step of tcp-check", check duration: 0ms. 1 active and 0 backup servers left. 0 sessions active, 0 requeued, 0 remaining in queue.
2024-02-21T07:03:17.653803-05:00 allyrion haproxy[1305572]: Connect from 10.0.2.162:53155 to 10.4.0.10:8404 (stats-frontend/HTTP)
2024-02-21T07:03:17.677482-05:00 allyrion haproxy[1305572]: Connect from 10.0.2.162:53156 to 10.4.0.10:8404 (stats-frontend/HTTP)
2024-02-21T07:03:18.114561-05:00 allyrion haproxy[1305572]: [WARNING]  (1305572) : Server k8s-api-server/gardener is DOWN, reason: Layer4 connection problem, info: "Connection refused at initial connection step of tcp-check", check duration: 0ms. 0 active and 0 backup servers left. 0 sessions active, 0 requeued, 0 remaining in queue.
2024-02-21T07:03:18.115141-05:00 allyrion haproxy[1305572]: [ALERT]    (1305572) : backend 'k8s-api-server' has no server available!
2024-02-21T07:03:18.115560-05:00 allyrion haproxy[1305572]: Server k8s-api-server/gardener is DOWN, reason: Layer4 connection problem, info: "Connection refused at initial connection step of tcp-check", check duration: 0ms. 0 active and 0 backup servers left. 0 sessions active, 0 requeued, 0 remaining in queue.
2024-02-21T07:03:18.116133-05:00 allyrion haproxy[1305572]: Server k8s-api-server/gardener is DOWN, reason: Layer4 connection problem, info: "Connection refused at initial connection step of tcp-check", check duration: 0ms. 0 active and 0 backup servers left. 0 sessions active, 0 requeued, 0 remaining in queue.
2024-02-21T07:03:18.117560-05:00 allyrion haproxy[1305572]: backend k8s-api-server has no server available!
2024-02-21T07:03:18.118458-05:00 allyrion haproxy[1305572]: backend k8s-api-server has no server available!
This is fine and dandy, and will be addressed in future chapters.
Container Runtime
Kubernetes is a container orchestration platform and therefore requires some container runtime to be installed.
This is a simple step; containerd is well-supported, well-regarded, and I don't have any reason not to use it.
I used Jeff Geerling's Ansible role to install and configure containerd on my cluster; this is really the point at which some kind of IaC/configuration management system becomes something more than a polite suggestion 🙂
Configuration Details
The containerd installation and configuration is managed through several key components:
Ansible Role Configuration
The geerlingguy.containerd role is specified in my requirements.yml and configured with these critical variables in group_vars/all/vars.yaml:
# geerlingguy.containerd configuration
containerd_package: 'containerd.io'
containerd_package_state: 'present'
containerd_service_state: 'started'
containerd_service_enabled: true
containerd_config_cgroup_driver_systemd: true  # Critical for Kubernetes integration
Runtime Integration with Kubernetes
The most important aspect of the containerd configuration is its integration with Kubernetes. The cluster explicitly configures the CRI socket path:
kubernetes:
  cri_socket_path: 'unix:///var/run/containerd/containerd.sock'
This socket path is used throughout the kubeadm initialization and join processes, ensuring Kubernetes can communicate with the container runtime.
Systemd Cgroup Driver
The configuration sets SystemdCgroup = true in the containerd configuration file (/etc/containerd/config.toml), which is essential because:
- Kubernetes 1.22+ requires systemd cgroup driver for kubelet
- Consistency: Both kubelet and containerd must use the same cgroup driver
- Resource Management: Enables proper CPU/memory limits enforcement
Generated Configuration
The Ansible role generates a complete containerd configuration with these key settings:
# Runtime configuration
[plugins."io.containerd.grpc.v1.cri".containerd.runtimes.runc.options]
SystemdCgroup = true  # Critical for Kubernetes cgroup management

# Socket configuration
[grpc]
address = "/run/containerd/containerd.sock"
Installation Process
The Ansible role performs these steps:
- Repository Setup: Adds Docker CE repository (containerd.io package source)
- Package Installation: Installs
containerd.iopackage - Default Config Generation: Runs
containerd config defaultto generate base config - Systemd Cgroup Modification: Patches config to set
SystemdCgroup = true - Service Management: Enables and starts containerd service
Architecture Support
The configuration automatically handles ARM64 architecture for the Raspberry Pi nodes through architecture detection in the Ansible variables, ensuring proper package selection for both ARM64 (Pi nodes) and AMD64 (x86 nodes).
Troubleshooting Tools
The installation also provides crictl (Container Runtime Interface CLI) for debugging and inspecting containers directly at the runtime level, which proves invaluable when troubleshooting Kubernetes pod issues.
The container runtime installation is handled in my install_k8s_packages.yaml playbook, which is where we'll be spending some time in subsequent sections.
Networking
Kubernetes uses three different networks:
- Infrastructure: The physical or virtual backbone connecting the machines hosting the nodes. The infrastructure network enables connectivity between the nodes; this is essential for the Kubernetes control plane components (like the kube-apiserver, etcd, scheduler, and controller-manager) and the worker nodes to communicate with each other. Although pods communicate with each other via the pod network (overlay network), the underlying infrastructure network supports this by facilitating the physical or virtual network paths between nodes.
- Service: This is a purely virtual and internal network. It allows services to communicate with each other and with Pods seamlessly. This network layer abstracts the actual network details from the services, providing a consistent and simplified interface for inter-service communication. When a Service is created, it is automatically assigned a unique IP address from the service network's address space. This IP address is stable for the lifetime of the Service, even if the Pods that make up the Service change. This stable IP address makes it easier to configure DNS or other service discovery mechanisms.
- Pod: This is a crucial component that allows for seamless communication between pods across the cluster, regardless of which node they are running on. This networking model is designed to ensure that each pod gets its own unique IP address, making it appear as though each pod is on a flat network where every pod can communicate with every other pod directly without NAT.
My infrastructure network is already up and running at 10.4.0.0/20. I'll configure my service network at 172.16.0.0/20 and my pod network at 192.168.0.0/16.
Network Architecture Implementation
CIDR Block Allocations
The goldentooth cluster uses a carefully planned network segmentation strategy:
- Infrastructure Network:
10.4.0.0/20- Physical network backbone - Service Network:
172.16.0.0/20- Kubernetes virtual services - Pod Network:
192.168.0.0/16- Container-to-container communication - MetalLB Range:
10.4.11.0/24- Load balancer service IPs
Physical Network Topology
The cluster consists of:
Control Plane Nodes (High Availability):
- bettley (10.4.0.11), cargyll (10.4.0.12), dalt (10.4.0.13)
Load Balancer and Services:
- allyrion (10.4.0.10) - HAProxy load balancer, NFS server
Worker Nodes:
- 8 Raspberry Pi ARM64 workers: erenford, fenn, gardener, harlton, inchfield, jast, karstark, lipps
- 1 x86 GPU worker: velaryon (10.4.0.30)
CNI Implementation: Calico
The cluster uses Calico as the Container Network Interface (CNI) plugin. Calico is configured during the kubeadm initialization:
kubeadm init \
  --control-plane-endpoint="10.4.0.10:6443" \
  --service-cidr="172.16.0.0/20" \
  --pod-network-cidr="192.168.0.0/16" \
  --kubernetes-version="stable-1.32"
Calico provides:
- Layer 3 networking with BGP routing
- Network policies for microsegmentation
- Cross-node pod communication without overlay networks
- Integration with the existing BGP infrastructure
Load Balancer Architecture
HAProxy Configuration: The cluster uses HAProxy running on allyrion (10.4.0.10) to provide high availability for the Kubernetes API server:
- Frontend: Listens on port 6443
- Backend: Round-robin load balancing across all three control plane nodes
- Health Checks: TCP-based health checks with fall=3, rise=2 configuration
- Monitoring: Prometheus metrics endpoint on port 8405
This ensures the cluster remains accessible even if individual control plane nodes fail.
BGP Integration with MetalLB
The cluster implements BGP-based load balancing using MetalLB:
Router Configuration (OPNsense with FRR):
- Router AS Number: 64500
- Cluster AS Number: 64501
- BGP Peer: Router at 10.4.0.1
MetalLB Configuration:
spec:
  myASN: 64501
  peerASN: 64500
  peerAddress: 10.4.0.1
  addressPool: '10.4.11.0 - 10.4.15.254'
This allows Kubernetes LoadBalancer services to receive real IP addresses that are automatically routed through the network infrastructure.
Static Route Management
The networking Ansible role automatically:
- Detects the primary network interface using
ip route show 10.4.0.0/20 - Adds static routes for the MetalLB range:
ip route add 10.4.11.0/24 dev <interface> - Persists routes in
/etc/network/interfaces.d/<interface>.cfgfor boot persistence
Service Discovery and DNS
The cluster implements comprehensive service discovery:
- Cluster Domain:
goldentooth.net - Node Domain:
nodes.goldentooth.net - Services Domain:
services.goldentooth.net - External DNS: Automated DNS record management via external-dns operator
Network Security
Certificate-Based Security:
- Step-CA: Provides automated certificate management for all services
- TLS Everywhere: All inter-service communication is encrypted
- SSH Certificates: Automated SSH certificate provisioning
Service Mesh Integration:
- Consul: Provides service discovery and health checking across both Kubernetes and Nomad
- Network Policies: Configured but not strictly enforced by default
Multi-Orchestrator Networking
The cluster supports both Kubernetes and HashiCorp Nomad workloads on the same physical network:
- Kubernetes: Calico CNI with BGP routing
- Nomad: Bridge networking with Consul Connect service mesh
- Vault: Network-based authentication and secrets distribution
Monitoring Network Integration
Observability Stack:
- Prometheus: Scrapes metrics across all network endpoints
- Grafana: Centralized dashboards accessible via MetalLB LoadBalancer
- Loki: Log aggregation with Vector log shipping across nodes
- Node Exporter: Per-node metrics collection
With this network architecture decided and implemented, we can move forward to the next phase of cluster construction.
Configuring Packages
Rather than YOLOing binaries onto our nodes like heathens, we'll use Apt and Ansible.
I wrote the above line before a few hours or so of fighting with Apt, Ansible, the repository signing key, documentation on the greater internet, my emotions, etc.
The long and short of it is that apt-key add is deprecated in Debian and Ubuntu, and consequently ansible.builtin.apt_key should be deprecated, but cannot be at this time for backward compatibility with older versions of Debian and Ubuntu and other derivative distributions.
The reason for this deprecation, as I understand it, is that apt-key add adds a key to /etc/apt/trusted.gpg.d. Keys here can be used to sign any package, including a package downloaded from an official distro package repository. This weakens our defenses against supply-chain attacks.
The new recommendation is to add the key to /etc/apt/keyrings, where it will be used when appropriate but not, apparently, to sign for official distro package repositories.
A further complication is that the Kubernetes project has moved its package repositories a time or two and completely rewrote the repository structure.
As a result, if you Google™, you will find a number of ways of using Ansible or a shell command to configure the Kubernetes apt repository on Debian/Ubuntu/Raspberry Pi OS, but none of them are optimal.
The Desired End-State
Here are my expectations:
- use the new deb822 format, not the old sources.list format
- preserve idempotence
- don't point to deprecated package repositories
- actually work
Existing solutions failed at one or all of these.
For the record, what we're trying to create is:
- a file located at
/etc/apt/keyrings/kubernetes.asccontaining the Kubernetes package repository signing key - a file located at
/etc/apt/sources.list.d/kubernetes.sourcescontaining information about the Kubernetes package repository.
The latter should look something like the following:
X-Repolib-Name: kubernetes
Types: deb
URIs: https://pkgs.k8s.io/core:/stable:/v1.29/deb/
Suites: /
Architectures: arm64
Signed-By: /etc/apt/keyrings/kubernetes.asc
The Solution
After quite some time and effort and suffering, I arrived at a solution.
You can review the original task file for changes, but I'm embedding it here because it was weirdly a nightmare to arrive at a working solution.
I've edited this only to substitute strings for the variables that point to them, so it should be a working solution more-or-less out-of-the-box.
---
- name: 'Install packages needed to use the Kubernetes Apt repository.'
  ansible.builtin.apt:
    name:
      - 'apt-transport-https'
      - 'ca-certificates'
      - 'curl'
      - 'gnupg'
      - 'python3-debian'
    state: 'present'

- name: 'Add Kubernetes repository.'
  ansible.builtin.deb822_repository:
    name: 'kubernetes'
    types:
      - 'deb'
    uris:
      - "https://pkgs.k8s.io/core:/stable:/v1.29/deb/"
    suites:
      - '/'
    architectures:
      - 'arm64'
    signed_by: "https://pkgs.k8s.io/core:/stable:/v1.29/deb/Release.key"
After this, you will of course need to update your Apt cache and install the three Kubernetes tools we'll use shortly: kubeadm, kubectl, and kubelet.
Installing Packages
Now that we have functional access to the Kubernetes Apt package repository, we can install some important Kubernetes tools:
kubeadmprovides a straightforward way to setup and configure a Kubernetes cluster (API server, Controller Manager, DNS, etc). Kubernetes the Hard Way basically does whatkubeadmdoes. I usekubeadmbecause my goal is to go not necessarily deeper, but farther.kubectlis a CLI tool for administering a Kubernetes cluster; you can deploy applications, inspect resources, view logs, etc. As I'm studying for my CKA, I want to usekubectlfor as much as possible.kubeletruns on each and every node in the cluster and ensures that pods are functioning as desired and takes steps to correct their behavior when it does not match the desired state.
Package Installation Implementation
Kubernetes Package Configuration
The package installation is managed through Ansible variables in group_vars/all/vars.yaml:
kubernetes_version: '1.32'

kubernetes:
  apt_packages:
    - 'kubeadm'
    - 'kubectl'
    - 'kubelet'
  apt_repo_url: "https://pkgs.k8s.io/core:/stable:/v{{ kubernetes_version }}/deb/"
This configuration:
- Version management: Uses Kubernetes 1.32 (latest stable at time of writing)
- Repository pinning: Uses version-specific repository for consistency
- Package selection: Core Kubernetes tools required for cluster operation
Installation Process
The installation is handled by the install_k8s_packages.yaml playbook, which performs these steps:
1. Container Runtime Setup:
- name: 'Setup `containerd`.'
  hosts: 'k8s_cluster'
  remote_user: 'root'
  roles:
    - { role: 'geerlingguy.containerd' }
This ensures containerd is installed and configured before Kubernetes packages.
2. Package Installation:
- name: 'Install Kubernetes packages.'
  ansible.builtin.apt:
    name: "{{ kubernetes.apt_packages }}"
    state: 'present'
  notify:
    - 'Hold Kubernetes packages.'
    - 'Enable and restart kubelet service.'
3. Package Hold Management:
- name: 'Hold Kubernetes packages.'
  ansible.builtin.dpkg_selections:
    name: "{{ package }}"
    selection: 'hold'
  loop: "{{ kubernetes.apt_packages }}"
This prevents accidental upgrades during regular system updates, ensuring cluster stability.
Service Configuration
kubelet Service Activation:
- name: 'Enable and restart kubelet service.'
  ansible.builtin.systemd_service:
    name: 'kubelet'
    state: 'restarted'
    enabled: true
    daemon_reload: true
Key features:
- Auto-start: Enables kubelet to start automatically on boot
- Service restart: Ensures kubelet starts with new configuration
- Daemon reload: Refreshes systemd to recognize any unit file changes
Target Nodes
The installation targets the k8s_cluster inventory group, which includes:
- Control plane nodes: bettley, cargyll, dalt (3 nodes)
- Worker nodes: All remaining Raspberry Pi nodes + velaryon GPU node (10 nodes)
This ensures all cluster nodes have consistent Kubernetes tooling.
Version Management Strategy
Repository Strategy:
- Version-pinned repositories: Uses
v1.32specific repository - Package holds: Prevents accidental upgrades via
dpkg --set-selections - Coordinated updates: Cluster-wide version management through Ansible
Upgrade Process:
- Update
kubernetes_versionvariable - Run
install_k8s_packages.yamlplaybook - Coordinate cluster upgrade using
kubeadm upgrade - Update containerd and other runtime components as needed
Integration with Container Runtime
The playbook ensures proper integration between Kubernetes and containerd:
Runtime Configuration:
- CRI socket:
/var/run/containerd/containerd.sock - Cgroup driver: systemd (required for Kubernetes 1.22+)
- Image service: containerd handles container image management
Service Dependencies:
- containerd must be running before kubelet starts
- kubelet configured to use containerd as container runtime
- Proper systemd service ordering ensures reliable startup
Command Line Integration
The installation integrates with the goldentooth CLI:
# Install Kubernetes packages across cluster
goldentooth install_k8s_packages

# Uninstall if needed (cleanup)
goldentooth uninstall_k8s_packages
Post-Installation Verification
After installation, you can verify the tools are properly installed:
# Check versions
goldentooth command k8s_cluster 'kubeadm version'
goldentooth command k8s_cluster 'kubectl version --client'
goldentooth command k8s_cluster 'kubelet --version'

# Verify package holds
goldentooth command k8s_cluster 'apt-mark showhold | grep kube'
Installing these tools is comparatively simple with the automated approach, just sudo apt-get install -y kubeadm kubectl kubelet, but the Ansible implementation adds important production considerations like version pinning, service management, and cluster-wide coordination that manual installation would miss.
kubeadm init
kubeadm does a wonderful job of simplifying Kubernetes cluster bootstrapping (if you don't believe me, just read Kubernetes the Hard Way), but there's still a decent amount of work involved. Since we're creating a high-availability cluster, we need to do some magic to convey secrets between the control plane nodes, generate join tokens for the worker nodes, etc.
So, we will:
- run
kubeadmon the first control plane node - copy some data around
- run a different
kubeadmcommand to join the rest of the control plane nodes to the cluster - copy some more data around
- run a different
kubeadmcommand to join the worker nodes to the cluster
and then we're done!
kubeadm init takes a number of command-line arguments.
You can look at the actual Ansible tasks bootstrapping my cluster, but this is what my command evaluates out to:
kubeadm init \
  --control-plane-endpoint="10.4.0.10:6443" \
  --kubernetes-version="stable-1.29" \
  --service-cidr="172.16.0.0/20" \
  --pod-network-cidr="192.168.0.0/16" \
  --cert-dir="/etc/kubernetes/pki" \
  --cri-socket="unix:///var/run/containerd/containerd.sock" \
  --upload-certs
I'll break that down line by line:
# Run through all of the phases of initializing a Kubernetes control plane.
kubeadm init \
  # Requests should target the load balancer, not this particular node.
  --control-plane-endpoint="10.4.0.10:6443" \
  # We don't need any more instability than we already have.
  # At time of writing, 1.29 is the current release.
  --kubernetes-version="stable-1.29" \
  # As described in the chapter on Networking, this is the CIDR from which
  # service IP addresses will be allocated.
  # This gives us 4,094 IP addresses to work with.
  --service-cidr="172.16.0.0/20" \
  # As described in the chapter on Networking, this is the CIDR from which
  # pod IP addresses will be allocated.
  # This gives us 65,534 IP addresses to work with.
  --pod-network-cidr="192.168.0.0/16"
  # This is the directory that will host TLS certificates, keys, etc for
  # cluster communication.
  --cert-dir="/etc/kubernetes/pki"
  # This is the URI of the container runtime interface socket, which allows
  # direct interaction with the container runtime.
  --cri-socket="unix:///var/run/containerd/containerd.sock"
  # Upload certificates into the appropriate secrets, rather than making us
  # do that manually.
  --upload-certs
Oh, you thought I was just going to blow right by this, didncha? No, this ain't Kubernetes the Hard Way, but I do want to make an effort to understand what's going on here. So here, courtesy of kubeadm init --help, is the list of phases that kubeadm runs through by default.
preflight                    Run pre-flight checks
certs                        Certificate generation
  /ca                          Generate the self-signed Kubernetes CA to provision identities for other Kubernetes components
  /apiserver                   Generate the certificate for serving the Kubernetes API
  /apiserver-kubelet-client    Generate the certificate for the API server to connect to kubelet
  /front-proxy-ca              Generate the self-signed CA to provision identities for front proxy
  /front-proxy-client          Generate the certificate for the front proxy client
  /etcd-ca                     Generate the self-signed CA to provision identities for etcd
  /etcd-server                 Generate the certificate for serving etcd
  /etcd-peer                   Generate the certificate for etcd nodes to communicate with each other
  /etcd-healthcheck-client     Generate the certificate for liveness probes to healthcheck etcd
  /apiserver-etcd-client       Generate the certificate the apiserver uses to access etcd
  /sa                          Generate a private key for signing service account tokens along with its public key
kubeconfig                   Generate all kubeconfig files necessary to establish the control plane and the admin kubeconfig file
  /admin                       Generate a kubeconfig file for the admin to use and for kubeadm itself
  /super-admin                 Generate a kubeconfig file for the super-admin
  /kubelet                     Generate a kubeconfig file for the kubelet to use *only* for cluster bootstrapping purposes
  /controller-manager          Generate a kubeconfig file for the controller manager to use
  /scheduler                   Generate a kubeconfig file for the scheduler to use
etcd                         Generate static Pod manifest file for local etcd
  /local                       Generate the static Pod manifest file for a local, single-node local etcd instance
control-plane                Generate all static Pod manifest files necessary to establish the control plane
  /apiserver                   Generates the kube-apiserver static Pod manifest
  /controller-manager          Generates the kube-controller-manager static Pod manifest
  /scheduler                   Generates the kube-scheduler static Pod manifest
kubelet-start                Write kubelet settings and (re)start the kubelet
upload-config                Upload the kubeadm and kubelet configuration to a ConfigMap
  /kubeadm                     Upload the kubeadm ClusterConfiguration to a ConfigMap
  /kubelet                     Upload the kubelet component config to a ConfigMap
upload-certs                 Upload certificates to kubeadm-certs
mark-control-plane           Mark a node as a control-plane
bootstrap-token              Generates bootstrap tokens used to join a node to a cluster
kubelet-finalize             Updates settings relevant to the kubelet after TLS bootstrap
  /experimental-cert-rotation  Enable kubelet client certificate rotation
addon                        Install required addons for passing conformance tests
  /coredns                     Install the CoreDNS addon to a Kubernetes cluster
  /kube-proxy                  Install the kube-proxy addon to a Kubernetes cluster
show-join-command            Show the join command for control-plane and worker node
So now I will go through each of these in turn to explain how the cluster is created.
kubeadm init phases
preflight
The preflight phase performs a number of checks of the environment to ensure it is suitable. These aren't, as far as I can tell, documented anywhere -- perhaps because documentation would inevitably drift out of sync with the code rather quickly. And, besides, we're engineers and this is an open-source project; if we care that much, we can just read the source code!
But I'll go through and mention a few of these checks, just for the sake of discussion and because there are some important concepts.
- Networking: It checks that certain ports are available and firewall settings do not prevent communication.
- Container Runtime: It requires a container runtime, since... Kubernetes is a container orchestration platform.
- Swap: Historically, Kubernetes has balked at running on a system with swap enabled, for performance and stability reasons, but this has been lifted recently.
- Uniqueness: It checks that each hostname is different in order to prevent networking conflicts.
- Kernel Parameters: It checks for certain cgroups (see the Node configuration chapter for more information). It used to check for some networking parameters as well, to ensure traffic can flow properly, but it appears this might not be a thing anymore in 1.30.
certs
This phase generates important certificates for communication between cluster components.
/ca
This generates a self-signed certificate authority that will be used to provision identities for all of the other Kubernetes components, and lays the groundwork for the security and reliability of their communication by ensuring that all components are able to trust one another.
By generating its own root CA, a Kubernetes cluster can be self-sufficient in managing the lifecycle of the certificates it uses for TLS. This includes generating, distributing, rotating, and revoking certificates as needed. This autonomy simplifies the setup and ongoing management of the cluster, especially in environments where integrating with an external CA might be challenging.
It's worth mentioning that this includes client certificates as well as server certificates, since client certificates aren't currently as well-known and ubiquitous as server certificates. So just as the API server has a server certificate that allows clients making requests to verify its identity, so clients will have a client certificate that allows the server to verify their identity.
So these certificate relationships maintain CIA (Confidentiality, Integrity, and Authentication) by:
- encrypting the data transmitted between the client and the server (Confidentiality)
- preventing tampering with the data transmitted between the client and the server (Integrity)
- verifying the identity of the server and the client (Authentication)
/apiserver
The Kubernetes API server is the central management entity of the cluster. The Kubernetes API allows users and internal and external processes and components to communicate and report and manage the state of the cluster. The API server accepts, validates, and executes REST operations, and is the only cluster component that interacts with etcd directly. etcd is the source of truth within the cluster, so it is essential that communication with the API server be secure.
/apiserver-kubelet-client
This is a client certificate for the API server, ensuring that it can authenticate itself to each kubelet and prove that it is a legitimate source of commands and requests.
/front-proxy-ca and front-proxy-client
The Front Proxy certificates seem to only be used in situations where kube-proxy is supporting an extension API server, and the API server/aggregator needs to connect to an extension API server respectively. This is beyond the scope of this project.
/etcd-ca
etcd can be configured to run "stacked" (deployed onto the control plane) or as an external cluster. For various reasons (security via isolation, access control, simplified rotation and management, etc), etcd is provided its own certificate authority.
/etcd-server
This is a server certificate for each etcd node, assuring the Kubernetes API server and etcd peers of its identity.
/etcd-peer
This is a client and server certificate, distributed to each etcd node, that enables them to communicate securely with one another.
/etcd-healthcheck-client
This is a client certificate that enables the caller to probe etcd. It permits broader access, in that multiple clients can use it, but the degree of that access is very restricted.
/apiserver-etcd-client
This is a client certificate permitting the API server to communicate with etcd.
/sa
This is a public and private key pair that is used for signing service account tokens.
Service accounts are used to provide an identity for processes that run in a Pod, permitting them to interact securely with the API server.
Service account tokens are JWTs (JSON Web Tokens). When a Pod accesses the Kubernetes API, it can present a service account token as a bearer token in the HTTP Authorization header. The API server then uses the public key to verify the signature on the token, and can then evaluate whether the claims are valid, etc.
kubeconfig
These phases write the necessary configuration files to secure and facilitate communication within the cluster and between administrator tools (like kubectl) and the cluster.
/admin
This is the kubeconfig file for the cluster administrator. It provides the admin user with full access to the cluster.
Now, per a change in 1.29, as Rory McCune explains, this admin credential is no longer a member of system:masters and instead has access granted via RBAC. This means that access can be revoked without having to manually rotate all of the cluster certificates.
/super-admin
This new credential also provides full access to the cluster, but via the system:masters group mechanism (read: irrevocable without rotating certificates). This also explains why, when watching my cluster spin up while using the admin.conf credentials, a time or two I saw access denied errors!
/kubelet
This credential is for use with the kubelet during cluster bootstrapping. It provides a baseline cluster-wide configuration for all kubelets in the cluster. It points to the client certificates that allow the kubelet to communicate with the API server so we can propagate cluster-level configuration to each kubelet.
/controller-manager
This credential is used by the Controller Manager. The Controller Manager is responsible for running controller processes, which watch the state of the cluster through the API server and make changes attempting to move the current state towards the desired state. This file contains credentials that allow the Controller Manager to communicate securely with the API server.
/scheduler
This credential is used by the Kubernetes Scheduler. The Scheduler is responsible for assigning work, in the form of Pods, to different nodes in the cluster. It makes these decisions based on resource availability, workload requirements, and other policies. This file contains the credentials needed for the Scheduler to interact with the API server.
etcd
This phase generates the static pod manifest file for local etcd.
Static pod manifests are files kept in (in our case) /etc/kubernetes/manifests; the kubelet observes this directory and will start/replace/delete pods accordingly. In the case of a "stacked" cluster, where we have critical control plane components like etcd and the API server running within pods, we need some method of creating and managing pods without those components. Static pod manifests provide this capability.
/local
This phase configures a local etcd instance to run on the same node as the other control plane components. This is what we'll be doing; later, when we join additional nodes to the control plane, the etcd cluster will expand.
For instance, the static pod manifest file for etcd on bettley, my first control plane node, has a spec.containers[0].command that looks like this:
....
  - command:
    - etcd
    - --advertise-client-urls=https://10.4.0.11:2379
    - --cert-file=/etc/kubernetes/pki/etcd/server.crt
    - --client-cert-auth=true
    - --data-dir=/var/lib/etcd
    - --experimental-initial-corrupt-check=true
    - --experimental-watch-progress-notify-interval=5s
    - --initial-advertise-peer-urls=https://10.4.0.11:2380
    - --initial-cluster=bettley=https://10.4.0.11:2380
    - --key-file=/etc/kubernetes/pki/etcd/server.key
    - --listen-client-urls=https://127.0.0.1:2379,https://10.4.0.11:2379
    - --listen-metrics-urls=http://127.0.0.1:2381
    - --listen-peer-urls=https://10.4.0.11:2380
    - --name=bettley
    - --peer-cert-file=/etc/kubernetes/pki/etcd/peer.crt
    - --peer-client-cert-auth=true
    - --peer-key-file=/etc/kubernetes/pki/etcd/peer.key
    - --peer-trusted-ca-file=/etc/kubernetes/pki/etcd/ca.crt
    - --snapshot-count=10000
    - --trusted-ca-file=/etc/kubernetes/pki/etcd/ca.crt
....
whereas on fenn, the second control plane node, the corresponding static pod manifest file looks like this:
  - command:
    - etcd
    - --advertise-client-urls=https://10.4.0.15:2379
    - --cert-file=/etc/kubernetes/pki/etcd/server.crt
    - --client-cert-auth=true
    - --data-dir=/var/lib/etcd
    - --experimental-initial-corrupt-check=true
    - --experimental-watch-progress-notify-interval=5s
    - --initial-advertise-peer-urls=https://10.4.0.15:2380
    - --initial-cluster=fenn=https://10.4.0.15:2380,gardener=https://10.4.0.16:2380,bettley=https://10.4.0.11:2380
    - --initial-cluster-state=existing
    - --key-file=/etc/kubernetes/pki/etcd/server.key
    - --listen-client-urls=https://127.0.0.1:2379,https://10.4.0.15:2379
    - --listen-metrics-urls=http://127.0.0.1:2381
    - --listen-peer-urls=https://10.4.0.15:2380
    - --name=fenn
    - --peer-cert-file=/etc/kubernetes/pki/etcd/peer.crt
    - --peer-client-cert-auth=true
    - --peer-key-file=/etc/kubernetes/pki/etcd/peer.key
    - --peer-trusted-ca-file=/etc/kubernetes/pki/etcd/ca.crt
    - --snapshot-count=10000
    - --trusted-ca-file=/etc/kubernetes/pki/etcd/ca.crt
and correspondingly, we can see three pods:
$ kubectl -n kube-system get pods
NAME                                       READY   STATUS    RESTARTS   AGE
etcd-bettley                               1/1     Running   19         3h23m
etcd-fenn                                  1/1     Running   0          3h22m
etcd-gardener                              1/1     Running   0          3h23m
control-plane
This phase generates the static pod manifest files for the other (non-etcd) control plane components.
/apiserver
This generates the static pod manifest file for the API server, which we've already discussed quite a bit.
/controller-manager
This generates the static pod manifest file for the controller manager. The controller manager embeds the core control loops shipped with Kubernetes. A controller is a loop that watches the shared state of the cluster through the API server and makes changes attempting to move the current state towards the desired state. Examples of controllers that are part of the Controller Manager include the Replication Controller, Endpoints Controller, Namespace Controller, and ServiceAccounts Controller.
/scheduler
This phase generates the static pod manifest file for the scheduler. The scheduler is responsible for allocating pods to nodes in the cluster based on various scheduling principles, including resource availability, constraints, affinities, etc.
kubelet-start
Throughout this process, the kubelet has been in a crash loop because it hasn't had a valid configuration.
This phase generates a config which (at least on my system) is stored at /var/lib/kubelet/config.yaml, as well as a "bootstrap" configuration that allows the kubelet to connect to the control plane (and retrieve credentials for longterm use).
Then the kubelet is restarted and will bootstrap with the control plane.
upload-certs
This phase enables the secure distribution of the certificates we created above, in the certs phases.
Some certificates need to be shared across the cluster (or at least across the control plane) for secure communication. This includes the certificates for the API server, etcd, the front proxy, etc.
kubeadm generates an encryption key that is used to encrypt the certificates, so they're not actually exposed in plain text at any point. Then the encrypted certificates are uploaded to etcd, a distributed key-value store that Kubernetes uses for persisting cluster state. To facilitate future joins of control plane nodes without having to manually distribute certificates, these encrypted certificates are stored in a specific kubeadm-certs secret.
The encryption key is required to decrypt the certificates for use by joining nodes. This key is not uploaded to the cluster for security reasons. Instead, it must be manually shared with any future control plane nodes that join the cluster. kubeadm outputs this key upon completion of the upload-certs phase, and it's the administrator's responsibility to securely transfer this key when adding new control plane nodes.
This process allows for the secure addition of new control plane nodes to the cluster by ensuring they have access to the necessary certificates to communicate securely with the rest of the cluster. Without this phase, administrators would have to manually copy certificates to each new node, which can be error-prone and insecure.
By automating the distribution of these certificates and utilizing encryption for their transfer, kubeadm significantly simplifies the process of scaling the cluster's control plane, while maintaining high standards of security.
mark-control-plane
In this phase, kubeadm applies a specific label to control plane nodes: node-role.kubernetes.io/control-plane=""; this marks the node as part of the control plane. Additionally, the node receives a taint, node-role.kubernetes.io/control-plane=:NoSchedule, which will prevent normal workloads from being scheduled on it.
As noted previously, I see no reason to remove this taint, although I'll probably enable some tolerations for certain workloads (monitoring, etc).
bootstrap-token
This phase creates bootstrap tokens, which are used to authenticate new nodes joining the cluster. This is how we are able to easily scale the cluster dynamically without copying multiple certificates and private keys around.
The "TLS bootstrap" process allows a kubelet to automatically request a certificate from the Kubernetes API server. This certificate is then used for secure communication within the cluster. The process involves the use of a bootstrap token and a Certificate Signing Request (CSR) that the kubelet generates. Once approved, the kubelet receives a certificate and key that it uses for authenticated communication with the API server.
Bootstrap tokens are a simple bearer token. This token is composed of two parts: an ID and a secret, formatted as <id>.<secret>. The ID and secret are randomly generated strings that authenticate the joining nodes to the cluster.
The generated token is configured with specific permissions using RBAC policies. These permissions typically allow the token to create a certificate signing request (CSR) that the Kubernetes control plane can then approve, granting the joining node the necessary certificates to communicate securely within the cluster.
By default, bootstrap tokens are set to expire after a certain period (24 hours by default), ensuring that tokens cannot be reused indefinitely for joining new nodes to the cluster. This behavior enhances the security posture of the cluster by limiting the window during which a token is valid.
Once generated and configured, the bootstrap token is stored as a secret in the kube-system namespace.
kubelet-finalize
This phase ensures that the kubelet is fully configured with the necessary settings to securely and effectively participate in the cluster. It involves applying any final kubelet configurations that might depend on the completion of the TLS bootstrap process.
addon
This phase sets up essential add-ons required for the cluster to meet the Kubernetes Conformance Tests.
/coredns
CoreDNS provides DNS services for the internal cluster network, allowing pods to find each other by name and services to load-balance across a set of pods.
/kube-proxy
kube-proxy is responsible for managing network communication inside the cluster, implementing part of the Kubernetes Service concept by maintaining network rules on nodes. These rules allow network communication to pods from network sessions inside or outside the cluster.
kube-proxy ensures that the networking aspect of Kubernetes services is correctly handled, allowing for the routing of traffic to the appropriate destinations. It operates in the user space, and it can also run in iptables mode, where it manipulates rules to allow network traffic. This allows services to be exposed to the external network, load balances traffic to pods across the multiple instances, etc.
show-join-command
This phase simplifies the process of expanding a Kubernetes cluster by generating bootstrap tokens and providing the necessary command to join additional nodes, whether they are worker nodes or additional control plane nodes.
In the next section, we'll actually bootstrap the cluster.
Bootstrapping the First Control Plane Node
With a solid idea of what it is that kubeadm init actually does, we can return to our command:
kubeadm init \
  --control-plane-endpoint="10.4.0.10:6443" \
  --kubernetes-version="stable-1.29" \
  --service-cidr="172.16.0.0/20" \
  --pod-network-cidr="192.168.0.0/16" \
  --cert-dir="/etc/kubernetes/pki" \
  --cri-socket="unix:///var/run/containerd/containerd.sock" \
  --upload-certs
It's really pleasantly concise, given how much is going on under the hood.
The Ansible tasks also symlinks the /etc/kubernetes/admin.conf file to ~/.kube/config (so we can use kubectl without having to specify the config file).
Then it sets up my preferred Container Network Interface addon, Calico. I have in the past sometimes used Flannel, but Flannel doesn't support NetworkPolicy resources as it is a Layer 3 networking solution, whereas Calico operates at Layer 3 and Layer 4, which allows it fine-grained control over traffic based on ports, protocol types, sources and destinations, etc.
I want to play with NetworkPolicy resources, so Calico it is.
The next couple of steps create bootstrap tokens so we can join the cluster.
Joining the Rest of the Control Plane
The next phase of bootstrapping is to admit the rest of the control plane nodes to the control plane.
Certificate Key Extraction
Before joining additional control plane nodes, we need to extract the certificate key from the initial kubeadm init output:
- name: 'Set the kubeadm certificate key.'
  ansible.builtin.set_fact:
    k8s_certificate_key: "{{ line | regex_search('--certificate-key ([^ ]+)', '\\1') | first }}"
  loop: "{{ hostvars[kubernetes.first]['kubeadm_init'].stdout_lines | default([]) }}"
  when: '(line | trim) is match(".*--certificate-key.*")'
This certificate key is crucial for securely downloading control plane certificates during the join process. The --upload-certs flag from the initial kubeadm init uploaded these certificates to the cluster, encrypted with this key.
Dynamic Token Generation
Rather than using a static token, we generate a fresh token for the join process:
- name: 'Create kubeadm token for joining nodes.'
  ansible.builtin.command:
    cmd: "kubeadm --kubeconfig {{ kubernetes.admin_conf_path }} token create"
  delegate_to: "{{ kubernetes.first }}"
  register: 'temp_token'

- name: 'Set kubeadm token fact.'
  ansible.builtin.set_fact:
    kubeadm_token: "{{ temp_token.stdout }}"
This approach:
- Security: Uses short-lived tokens (24-hour default expiry)
- Automation: No need to manually specify or distribute tokens
- Reliability: Fresh token for each bootstrap operation
JoinConfiguration Template
The JoinConfiguration manifest is generated from a Jinja2 template (kubeadm-controlplane.yaml.j2):
apiVersion: kubeadm.k8s.io/v1beta3
kind: JoinConfiguration
discovery:
  bootstrapToken:
    apiServerEndpoint: {{ haproxy.ipv4_address }}:6443
    token: {{ kubeadm_token }}
    unsafeSkipCAVerification: true
  timeout: 5m0s
  tlsBootstrapToken: {{ kubeadm_token }}
controlPlane:
  localAPIEndpoint:
    advertiseAddress: {{ ipv4_address }}
    bindPort: 6443
  certificateKey: {{ k8s_certificate_key }}
nodeRegistration:
  name: {{ inventory_hostname }}
  criSocket: {{ kubernetes.cri_socket_path }}
{% if inventory_hostname in kubernetes.rest %}
  taints:
  - effect: NoSchedule
    key: node-role.kubernetes.io/control-plane
{% else %}
  taints: []
{% endif %}
Key Configuration Elements:
Discovery Configuration:
- API Server Endpoint: Points to HAProxy load balancer (
10.4.0.10:6443) - Bootstrap Token: Dynamically generated token for secure cluster discovery
- CA Verification: Skipped for simplicity (acceptable in trusted network)
- Timeout: 5-minute timeout for discovery operations
Control Plane Configuration:
- Local API Endpoint: Each node advertises its own IP for API server communication
- Certificate Key: Enables secure download of control plane certificates
- Bind Port: Standard Kubernetes API server port (6443)
Node Registration:
- CRI Socket: Uses containerd socket (
unix:///var/run/containerd/containerd.sock) - Node Name: Uses Ansible inventory hostname for consistency
- Taints: Control plane nodes get NoSchedule taint to prevent workload scheduling
Control Plane Join Process
The actual joining process involves several orchestrated steps:
1. Configuration Setup
- name: 'Ensure presence of Kubernetes directory.'
  ansible.builtin.file:
    path: '/etc/kubernetes'
    state: 'directory'
    mode: '0755'

- name: 'Create kubeadm control plane config.'
  ansible.builtin.template:
    src: 'kubeadm-controlplane.yaml.j2'
    dest: '/etc/kubernetes/kubeadm-controlplane.yaml'
    mode: '0640'
    backup: true
2. Readiness Verification
- name: 'Wait for the kube-apiserver to be ready.'
  ansible.builtin.wait_for:
    host: "{{ haproxy.ipv4_address }}"
    port: '6443'
    timeout: 180
This ensures the load balancer and initial control plane node are ready before attempting to join.
3. Clean State Reset
- name: 'Reset certificate directory.'
  ansible.builtin.shell:
    cmd: |
      if [ -f /etc/kubernetes/manifests/kube-apiserver.yaml ]; then
        kubeadm reset -f --cert-dir {{ kubernetes.pki_path }};
      fi
This conditional reset ensures a clean state if a node was previously part of a cluster.
4. Control Plane Join
- name: 'Join the control plane node to the cluster.'
  ansible.builtin.command:
    cmd: kubeadm join --config /etc/kubernetes/kubeadm-controlplane.yaml
  register: 'kubeadm_join'
5. Administrative Access Setup
- name: 'Ensure .kube directory exists.'
  ansible.builtin.file:
    path: '~/.kube'
    state: 'directory'
    mode: '0755'

- name: 'Symlink the kubectl admin.conf to ~/.kube/config.'
  ansible.builtin.file:
    src: '/etc/kubernetes/admin.conf'
    dest: '~/.kube/config'
    state: 'link'
    mode: '0600'
This sets up kubectl access for the root user on each control plane node.
Target Nodes
The control plane joining process targets nodes in the kubernetes.rest group:
- bettley (10.4.0.11) - Second control plane node
- cargyll (10.4.0.12) - Third control plane node
This gives us a 3-node control plane for high availability, capable of surviving the failure of any single node.
High Availability Considerations
Load Balancer Integration:
- All control plane nodes use the HAProxy endpoint for cluster communication
- Even control plane nodes connect through the load balancer for API server access
- This ensures consistent behavior whether accessing from inside or outside the cluster
Certificate Management:
- Control plane certificates are automatically distributed via the certificate key mechanism
- Each node gets its own API server certificate with appropriate SANs
- Certificate rotation is handled through normal Kubernetes certificate management
Etcd Clustering:
- kubeadm automatically configures etcd clustering across all control plane nodes
- Stacked topology (etcd on same nodes as API server) for simplicity
- Quorum maintained with 3 nodes (can survive 1 node failure)
After these steps complete, a simple kubeadm join --config /etc/kubernetes/kubeadm-controlplane.yaml on each remaining control plane node is sufficient to complete the highly available control plane setup.
Admitting the Worker Nodes
After establishing a highly available control plane, the final phase of cluster bootstrapping involves admitting worker nodes. While conceptually simple, this process involves several important considerations for security, automation, and cluster topology.
Worker Node Join Command Generation
The process begins by generating a fresh join command from the first control plane node:
- name: 'Get a kubeadm join command for worker nodes.'
  ansible.builtin.command:
    cmd: 'kubeadm token create --print-join-command'
  changed_when: false
  when: 'ansible_hostname == kubernetes.first'
  register: 'kubeadm_join_command'
This command:
- Dynamic tokens: Creates a new bootstrap token with 24-hour expiry
- Complete command: Returns fully formed join command with discovery information
- Security: Each bootstrap operation gets a fresh token to minimize exposure
Join Command Structure
The generated join command typically looks like:
kubeadm join 10.4.0.10:6443 \
  --token abc123.defghijklmnopqrs \
  --discovery-token-ca-cert-hash sha256:1234567890abcdef...
Key components:
- API Server Endpoint: HAProxy load balancer address (
10.4.0.10:6443) - Bootstrap Token: Temporary authentication token for initial cluster access
- CA Certificate Hash: SHA256 hash of cluster CA certificate for secure discovery
Ansible Automation
The join command is distributed and executed across all worker nodes:
- name: 'Set the kubeadm join command fact.'
  ansible.builtin.set_fact:
    kubeadm_join_command: |
      {{ hostvars[kubernetes.first]['kubeadm_join_command'].stdout }} --ignore-preflight-errors=all

- name: 'Join node to Kubernetes control plane.'
  ansible.builtin.command:
    cmd: "{{ kubeadm_join_command }}"
  when: "clean_hostname in groups['k8s_worker']"
  changed_when: false
Automation features:
- Fact distribution: Join command shared across all hosts via Ansible facts
- Selective execution: Only runs on nodes in the
k8s_workerinventory group - Preflight error handling:
--ignore-preflight-errors=allallows join despite minor configuration warnings
Worker Node Inventory
The worker nodes are organized in the Ansible inventory under k8s_worker:
Raspberry Pi Workers (8 nodes):
- erenford (10.4.0.14) - Ray head node, ZFS storage
- fenn (10.4.0.15) - Ceph storage node
- gardener (10.4.0.16) - Grafana host, ZFS storage
- harlton (10.4.0.17) - General purpose worker
- inchfield (10.4.0.18) - Loki host, Seaweed storage
- jast (10.4.0.19) - Step-CA host, Seaweed storage
- karstark (10.4.0.20) - Ceph storage node
- lipps (10.4.0.21) - Ceph storage node
GPU Worker (1 node):
- velaryon (10.4.1.10) - x86 node with GPU acceleration
This topology provides:
- Heterogeneous compute: Mix of ARM64 (Pi) and x86_64 (velaryon) architectures
- Specialized workloads: GPU node for ML/AI workloads
- Storage diversity: Nodes optimized for different storage backends (ZFS, Ceph, Seaweed)
Node Registration Process
When a worker node joins the cluster, several automated processes occur:
1. TLS Bootstrap
# kubelet initiates TLS bootstrapping
kubelet --bootstrap-kubeconfig=/etc/kubernetes/bootstrap-kubelet.conf \
        --kubeconfig=/etc/kubernetes/kubelet.conf
This process:
- Uses bootstrap token for initial authentication
- Generates node-specific key pair
- Requests certificate signing from cluster CA
- Receives permanent kubeconfig upon approval
2. Node Labels and Taints
Automatic labels applied:
kubernetes.io/arch=arm64(Pi nodes) orkubernetes.io/arch=amd64(velaryon)kubernetes.io/os=linuxnode.kubernetes.io/instance-type=(based on node hardware)
No default taints: Worker nodes accept all workloads by default, unlike control plane nodes with NoSchedule taints.
3. Container Runtime Integration
Each worker node connects to the local containerd socket:
# kubelet configuration
criSocket: unix:///var/run/containerd/containerd.sock
This ensures:
- Container lifecycle: kubelet manages pod containers via containerd
- Image management: containerd handles container image pulls and storage
- Runtime security: Proper cgroup and namespace isolation
Cluster Topology Verification
After worker node admission, the cluster achieves the desired topology:
Control Plane (3 nodes)
- High availability: Survives single node failure
- Load balanced: All API requests go through HAProxy
- Etcd quorum: 3-node etcd cluster for data consistency
Worker Pool (9 nodes)
- Compute capacity: 8x Raspberry Pi 4B + 1x x86 GPU node
- Workload distribution: Scheduler can place pods across heterogeneous hardware
- Fault tolerance: Workloads can survive multiple worker node failures
Networking Integration
- Pod networking: Calico CNI provides cluster-wide pod connectivity
- Service networking: kube-proxy configures service load balancing
- External access: MetalLB provides LoadBalancer service implementation
Verification Commands
After worker node admission, verify cluster health:
# Check all nodes are Ready
kubectl get nodes -o wide

# Verify kubelet health across cluster
goldentooth command k8s_cluster 'systemctl status kubelet'

# Check pod networking
kubectl get pods -n kube-system -o wide

# Verify resource availability
kubectl top nodes
And voilà! We have a functioning cluster.
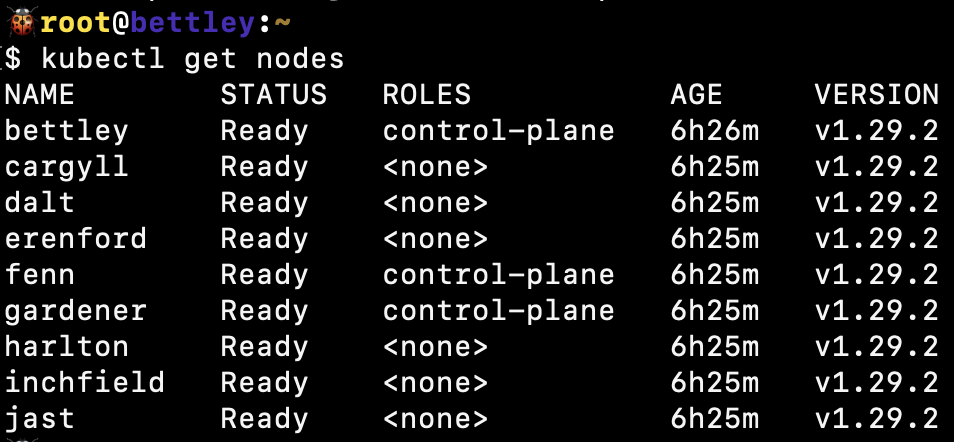
We can also see that the cluster is functioning well from HAProxy's perspective:
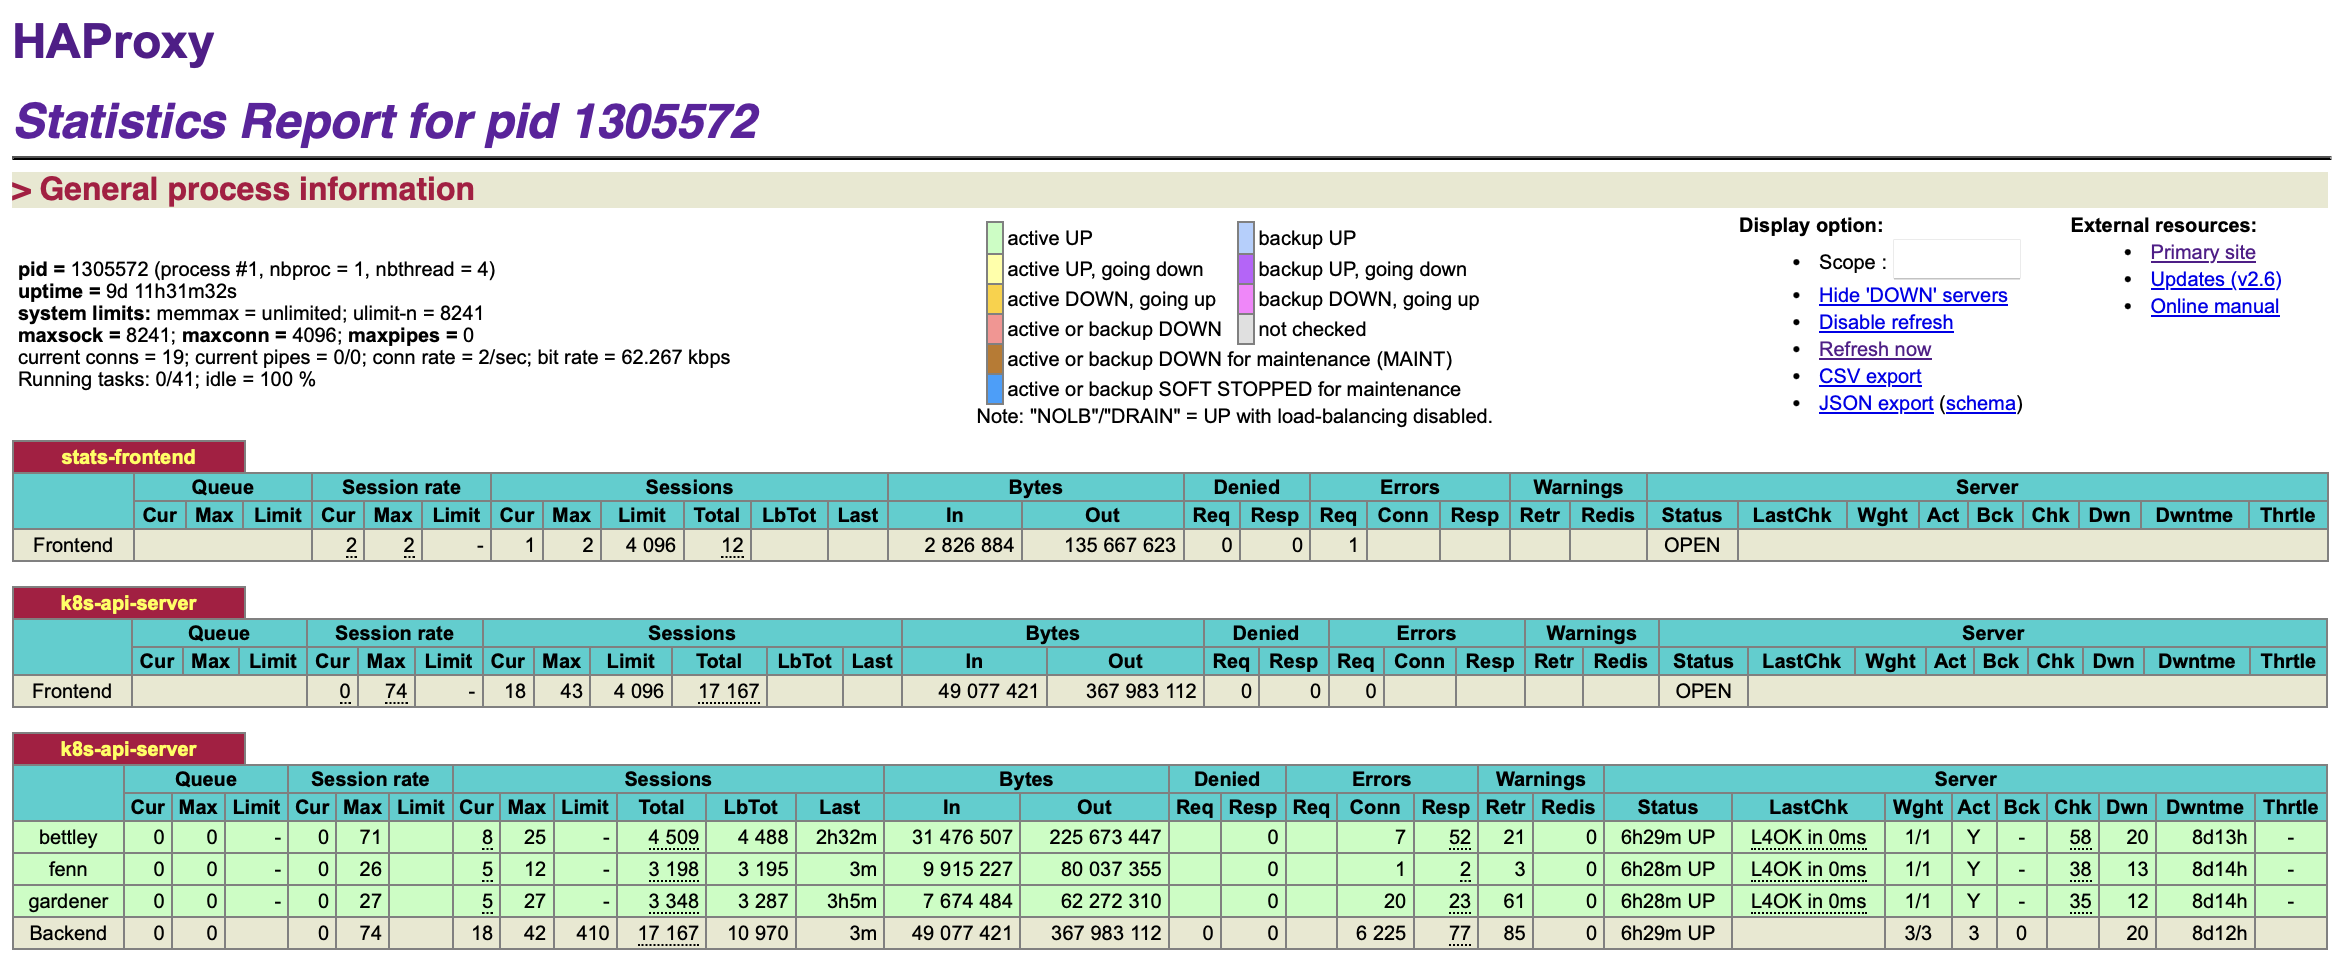
Implementation Details
The complete worker node admission process is automated in the bootstrap_k8s.yaml playbook, which orchestrates:
- Control plane initialization on the first node
- Control plane expansion to remaining master nodes
- Worker node admission across the entire worker pool
- Network configuration with Calico CNI
- Service mesh preparation for later HashiCorp Consul integration
This systematic approach ensures consistent cluster topology and provides a solid foundation for deploying containerized applications and platform services.
Where Do We Go From Here?
We have a functioning cluster now, which is to say that I've spent many hours of my life that I'm not going to get back just doing the same thing that the official documentation manages to convey in just a few lines.
Or that Jeff Geerling's geerlingguy.kubernetes has already managed to do.
And it's not a tenth of a percent as much as Kubespray can do.
Not much to be proud of, but again, this is a personal learning journey. I'm just trying to build a cluster thoughtfully, limiting the black boxes and the magic as much as practical.
The Foundation is Set
What we've accomplished so far represents the essential foundation of any production Kubernetes cluster:
Core Infrastructure ✅
- High availability control plane with 3 nodes and etcd quorum
- Load balanced API access through HAProxy for reliability
- Container runtime (containerd) with proper CRI integration
- Pod networking with Calico CNI providing cluster-wide connectivity
- Worker node pool with heterogeneous hardware (ARM64 + x86_64)
Automation and Reproducibility ✅
- Infrastructure as Code with comprehensive Ansible automation
- Idempotent operations ensuring consistent cluster state
- Version-pinned packages preventing unexpected upgrades
- Goldentooth CLI providing unified cluster management interface
But a bare Kubernetes cluster, while functional, is just the beginning. Real production workloads require additional platform services and operational capabilities.
The Platform Journey Ahead
The following phases will transform our basic cluster into a comprehensive container platform:
Phase 1: Application Platform Services
The next immediate priorities focus on making the cluster useful for application deployment:
GitOps and Application Management:
- Helm package management for standardized application packaging
- Argo CD for GitOps-based continuous deployment
- ApplicationSets for managing applications across environments
- Sealed Secrets for secure secret management in Git repositories
Ingress and Load Balancing:
- MetalLB for LoadBalancer service implementation
- BGP configuration for dynamic route advertisement
- External DNS for automatic DNS record management
- TLS certificate automation with cert-manager
Phase 2: Observability and Operations
Production clusters require comprehensive observability:
Metrics and Monitoring:
- Prometheus for metrics collection and alerting
- Grafana for visualization and dashboards
- Node exporters for hardware and OS metrics
- Custom metrics for application-specific monitoring
Logging and Troubleshooting:
- Loki for centralized log aggregation
- Vector for log collection and routing
- Distributed tracing for complex application debugging
- Alert routing for operational incident response
Phase 3: Storage and Data Management
Stateful applications require sophisticated storage solutions:
Distributed Storage:
- NFS exports for shared storage across the cluster
- Ceph cluster for distributed block and object storage
- ZFS replication for data durability and snapshots
- SeaweedFS for scalable object storage
Backup and Recovery:
- Velero for cluster backup and disaster recovery
- Database backup automation for stateful workloads
- Cross-datacenter replication for business continuity
Phase 4: Security and Compliance
Enterprise-grade security requires multiple layers:
PKI and Certificate Management:
- Step-CA for internal certificate authority
- Automatic certificate rotation for all cluster services
- SSH certificate authentication for secure node access
- mTLS everywhere for service-to-service communication
Secrets and Access Control:
- HashiCorp Vault for enterprise secret management
- AWS KMS integration for encryption key management
- RBAC policies for fine-grained access control
- Pod security standards for workload isolation
Phase 5: Multi-Orchestrator Hybrid Cloud
The final phase explores advanced orchestration patterns:
Service Mesh and Discovery:
- Consul service mesh for advanced networking and security
- Cross-platform service discovery between Kubernetes and Nomad
- Traffic management and circuit breaking patterns
Workload Distribution:
- Nomad integration for specialized workloads and batch jobs
- Ray cluster for distributed machine learning workloads
- GPU acceleration for AI/ML and scientific computing
Learning Philosophy
This journey prioritizes understanding over convenience:
Transparency Over Magic:
- Each component is manually configured to understand its purpose
- Ansible automation makes every configuration decision explicit
- Documentation captures the reasoning behind each choice
Production Patterns from Day One:
- High availability configurations even in the homelab
- Security-first approach with proper PKI and encryption
- Monitoring and observability built into every service
Platform Engineering Mindset:
- Reusable patterns that could scale to enterprise environments
- GitOps workflows that support team collaboration
- Self-service capabilities for application developers
The Road Ahead
The following chapters will implement these platform services systematically, building up the cluster's capabilities layer by layer. Each addition will:
- Solve a real operational problem (not just add complexity)
- Follow production best practices (high availability, security, monitoring)
- Integrate with existing services (leveraging our PKI, service discovery, etc.)
- Document the implementation (including failure modes and troubleshooting)
This methodical approach ensures that when we're done, we'll have not just a working cluster, but a deep understanding of how modern container platforms are built and operated.
In the following sections, I'll add more functionality.
Installing Helm
I have a lot of ambitions for this cluster, but after some deliberation, the thing I most want to do right now is deploy something to Kubernetes.
So I'll be starting out by installing Argo CD, and I'll do that... soon. In the next chapter. I decided to install Argo CD via Helm, since I expect that Helm will be useful in other situations as well, e.g. trying out applications before I commit (no pun intended) to bringing them into GitOps.
So I created a playbook and role to cover installing Helm.
Installation Implementation
Package Repository Approach
Rather than downloading binaries manually, I chose to use the official Helm APT repository for a more maintainable installation. The Ansible role adds the repository using the modern deb822_repository format:
- name: 'Add Helm package repository.'
  ansible.builtin.deb822_repository:
    name: 'helm'
    types: ['deb']
    uris: ['https://baltocdn.com/helm/stable/debian/']
    suites: ['all']
    components: ['main']
    architectures: ['arm64']
    signed_by: 'https://baltocdn.com/helm/signing.asc'
This approach provides several benefits:
- Automatic updates: Using
state: 'latest'ensures we get the most recent Helm version - Security: Uses the official Helm signing key for package verification
- Architecture support: Properly configured for ARM64 architecture on Raspberry Pi nodes
- Maintainability: Standard package management simplifies updates and removes manual binary management
Installation Scope
Helm is installed only on the Kubernetes control plane nodes (k8s_control_plane group). This is sufficient because:
- Post-Tiller Architecture: Modern Helm (v3+) doesn't require a server-side component
- Client-only Tool: Helm operates entirely as a client-side tool that communicates with the Kubernetes API
- Administrative Access: Control plane nodes are where cluster administration typically occurs
- Resource Efficiency: No need to install on every worker node
Integration with Cluster Architecture
Kubernetes Integration:
The installation leverages the existing kubernetes.core Ansible collection, ensuring proper integration with the cluster's Kubernetes components. The role depends on:
- Existing cluster RBAC configurations
- Kubernetes API server access from control plane nodes
- Standard kubeconfig files for authentication
GitOps Integration: Helm serves as a crucial component for the GitOps workflow, particularly for Argo CD installation. The integration follows this pattern:
- name: 'Add Argo Helm chart repository.'
  kubernetes.core.helm_repository:
    name: 'argo'
    repo_url: "{{ argo_cd.chart_repo_url }}"

- name: 'Install Argo CD from Helm chart.'
  kubernetes.core.helm:
    atomic: false
    chart_ref: 'argo/argo-cd'
    chart_version: "{{ argo_cd.chart_version }}"
    create_namespace: true
    release_name: 'argocd'
    release_namespace: "{{ argo_cd.namespace }}"
Security Considerations
The installation follows security best practices:
- Signed Packages: Uses official Helm signing key for package verification
- Trusted Repository: Sources packages directly from Helm's CDN
- No Custom RBAC: Relies on existing Kubernetes cluster RBAC rather than creating additional permissions
- System-level Installation: Installed as root for proper system integration
Command Line Integration
The installation integrates seamlessly with the goldentooth CLI:
goldentooth install_helm
This command maps directly to the Ansible playbook execution, maintaining consistency with the cluster's unified management interface.
Version Management Strategy
The configuration uses a state: 'latest' strategy, which means:
- Automatic Updates: Each playbook run ensures the latest Helm version is installed
- Application-level Pinning: Specific chart versions are managed at the application level (e.g., Argo CD chart version 7.1.5)
- Simplified Maintenance: No need to manually track Helm version updates
High Availability Considerations
By installing Helm on all control plane nodes, the configuration provides:
- Redundancy: Any control plane node can perform Helm operations
- Administrative Flexibility: Cluster administrators can use any control plane node
- Disaster Recovery: Helm operations can continue even if individual control plane nodes fail
Fortunately, this is fairly simple to install and trivial to configure, which is not something I can say for Argo CD 🙂
Installing Argo CD
GitOps is a methodology based around treating IaC stored in Git as a source of truth for the desired state of the infrastructure. Put simply, whatever you push to main becomes the desired state and your IaC systems, whether they be Terraform, Ansible, etc, will be invoked to bring the actual state into alignment.
Argo CD is a popular system for implementing GitOps with Kubernetes. It can observe a Git repository for changes and react to those changes accordingly, creating/destroying/replacing resources as needed within the cluster.
Argo CD is a large, complicated application in its own right; its Helm chart is thousands of lines long. I'm not trying to learn it all right now, and fortunately, I have a fairly simple structure in mind.
I'll install Argo CD via a new Ansible playbook and role that use Helm, which we set up in the last section.
None of this is particularly complex, but I'll document some of my values overrides here:
# I've seen a mix of `argocd` and `argo-cd` scattered around. I preferred
# `argocd`, but I will shift to `argo-cd` where possible to improve
# consistency.
#
# EDIT: The `argocd` CLI tool appears to be broken and does not allow me to
# override the names of certain components when port forwarding.
# See https://github.com/argoproj/argo-cd/issues/16266 for details.
# As a result, I've gone through and reverted my changes to standardize as much
# as possible on `argocd`. FML.
nameOverride: 'argocd'
global:
  # This evaluates to `argocd.goldentooth.hellholt.net`.
  domain: "{{ argocd_domain }}"
  # Add Prometheus scrape annotations to all metrics services. This can
  # be used as an alternative to the ServiceMonitors.
  addPrometheusAnnotations: true
  # Default network policy rules used by all components.
  networkPolicy:
    # Create NetworkPolicy objects for all components; this is currently false
    # but I think I'd like to create these later.
    create: false
    # Default deny all ingress traffic; I want to improve security, so I hope
    # to enable this later.
    defaultDenyIngress: false
configs:
  secret:
    createSecret: true
    # Specify a password. I store an "easy" password, which is in my muscle
    # memory, so I'll use that for right now.
    argocdServerAdminPassword: "{{ vault.easy_password | password_hash('bcrypt') }}"
  # Refer to the repositories that host our applications.
  repositories:
    # This is the main (and likely only) one.
    gitops:
      type: 'git'
      name: 'gitops'
      # This turns out to be https://github.com/goldentooth/gitops.git
      url: "{{ argocd_app_repo_url }}"

redis-ha:
  # Enable Redis high availability.
  enabled: true

controller:
  # The HA configuration keeps this at one, and I don't see a reason to change.
  replicas: 1

server:
  # Enable
  autoscaling:
    enabled: true
    # This immediately scaled up to 3 replicas.
    minReplicas: 2
  # I'll make this more secure _soon_.
  extraArgs:
    - '--insecure'
  # I don't have load balancing set up yet.
  service:
    type: 'ClusterIP'

repoServer:
  autoscaling:
    enabled: true
    minReplicas: 2

applicationSet:
  replicas: 2
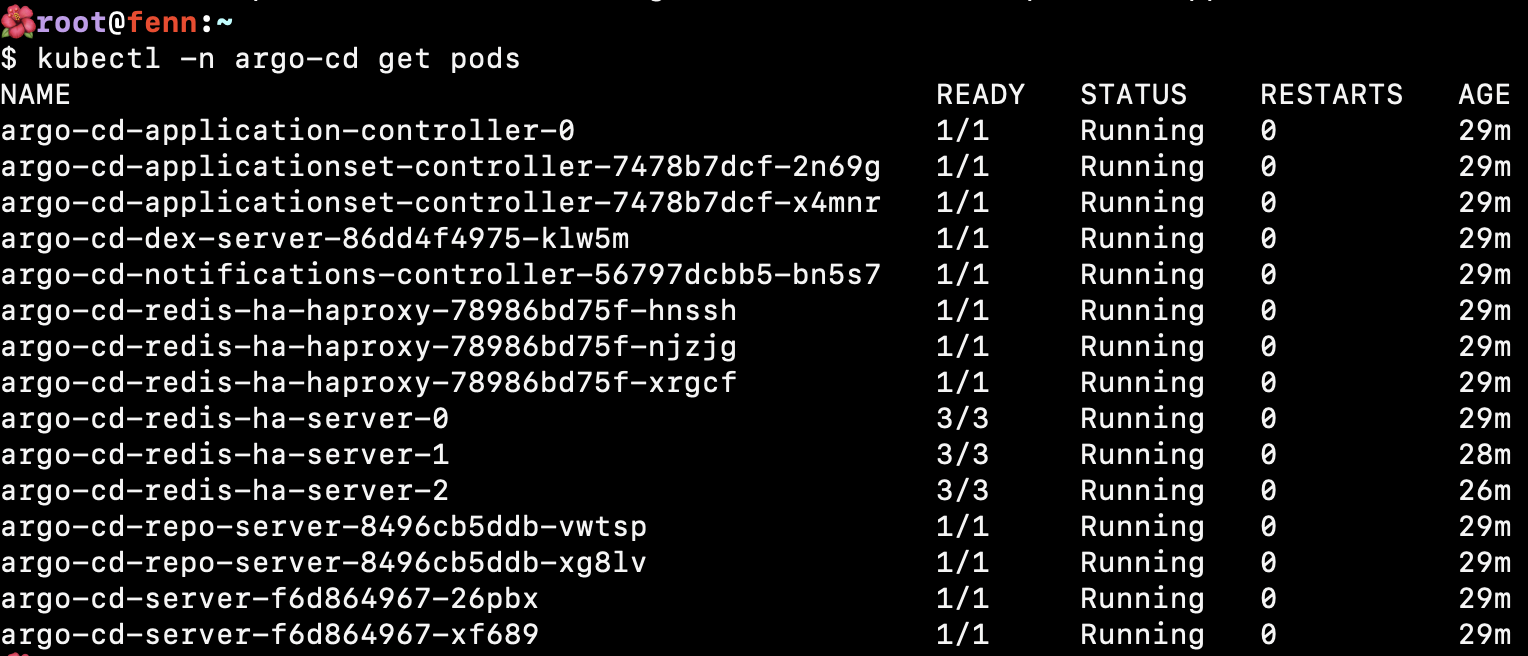
Installation Architecture
The Argo CD installation uses a sophisticated Helm-based approach with the following components:
- Chart Version: 7.1.5 from the official Argo repository (
https://argoproj.github.io/argo-helm) - CLI Installation: ARM64-specific Argo CD CLI installed to
/usr/local/bin/argocd - Namespace: Dedicated
argocdnamespace with proper resource isolation - Deployment Scope: Runs once on control plane nodes for efficient resource usage
High Availability Configuration
The installation implements enterprise-grade high availability:
Redis High Availability:
redis-ha:
  enabled: true
Component Scaling:
- Server: Autoscaling enabled with minimum 2 replicas for redundancy
- Repo Server: Autoscaling enabled with minimum 2 replicas for Git repository operations
- Application Set Controller: 2 replicas for ApplicationSet management
- Controller: 1 replica (following HA recommendations for the core controller)
This configuration ensures that Argo CD remains operational even during node failures or maintenance.
Security and Authentication
Admin Authentication: The cluster uses bcrypt-hashed passwords stored in the encrypted Ansible vault:
argocdServerAdminPassword: "{{ secret_vault.easy_password | password_hash('bcrypt') }}"
GitHub Integration: For private repository access, the installation creates a Kubernetes secret:
apiVersion: v1
kind: Secret
metadata:
  name: github-token
  namespace: argocd
data:
  token: "{{ secret_vault.github_token | b64encode }}"
Current Security Posture:
- Server configured with
--insecureflag (temporary for initial setup) - Network policies prepared but not yet enforced
- RBAC relies on default admin access patterns
Service and Network Integration
LoadBalancer Configuration: Unlike the basic ClusterIP shown in the values, the actual deployment uses:
service:
  type: LoadBalancer
  annotations:
    external-dns.alpha.kubernetes.io/hostname: "argocd.{{ cluster.domain }}"
    external-dns.alpha.kubernetes.io/ttl: "60"
This integration provides:
- MetalLB Integration: Automatic IP address assignment from the
10.4.11.0/24pool - External DNS: Automatic DNS record creation for
argocd.goldentooth.net - Public Access: Direct access from the broader network infrastructure
GitOps Implementation: App of Apps Pattern
The cluster implements the sophisticated "Application of Applications" pattern for managing GitOps workflows:
AppProject Configuration:
apiVersion: argoproj.io/v1alpha1
kind: AppProject
metadata:
  name: gitops-repo
spec:
  sourceRepos:
    - '*'  # Lab environment - all repositories allowed
  destinations:
    - namespace: '*'
       server: https://kubernetes.default.svc
  clusterResourceWhitelist:
    - group: '*'
      kind: '*'
ApplicationSet Generator: The cluster uses GitHub SCM Provider generator to automatically discover and deploy applications:
generators:
- scmProvider:
    github:
      organization: goldentooth
      labelSelector:
        matchLabels:
          gitops-repo: "true"
This pattern automatically creates Argo CD Applications for any repository in the goldentooth organization with the gitops-repo label.
Application Standards and Sync Policies
Standardized Sync Configuration: All applications follow consistent sync policies:
syncPolicy:
  automated:
    prune: true      # Remove resources not in Git
    selfHeal: true   # Automatically fix configuration drift
  syncOptions:
    - Validate=true
    - CreateNamespace=true
    - PrunePropagationPolicy=foreground
    - PruneLast=true
    - RespectIgnoreDifferences=true
    - ApplyOutOfSyncOnly=true
Wave-based Deployment:
Applications use argocd.argoproj.io/wave annotations for ordered deployment, ensuring dependencies are deployed before dependent services.
Monitoring Integration
Prometheus Integration:
global:
  addPrometheusAnnotations: true
This configuration ensures all Argo CD components expose metrics for the cluster's Prometheus monitoring stack, providing visibility into GitOps operations and performance.
Current Application Portfolio
The GitOps system currently manages:
- MetalLB: Load balancer implementation
- External Secrets: Integration with HashiCorp Vault
- Prometheus Node Exporter: Node-level monitoring
- Additional applications: Automatically discovered via the ApplicationSet pattern
Command Line Integration
The installation provides seamless CLI integration:
# Install Argo CD
goldentooth install_argo_cd

# Install managed applications
goldentooth install_argo_cd_apps
Access Methods
Web Interface Access:
- Production: Direct access via
https://argocd.goldentooth.net(LoadBalancer + External DNS) - Development: Port forwarding via
kubectl -n argocd port-forward service/argocd-server 8081:443 --address 0.0.0.0
After running the port-forward command on one of my control plane nodes, I'm able to view the web interface and log in. With the App of Apps pattern configured, the interface shows automatically discovered applications and their sync status.
The GitOps foundation is now established, enabling declarative application management across the entire cluster infrastructure.
The "Incubator" GitOps Application
Previously, we discussed GitOps and how Argo CD provides a platform for implementing GitOps for Kubernetes.
As mentioned, the general idea is to have some Git repository somewhere that defines an application. We create a corresponding resource in Argo CD to represent that application, and Argo CD will henceforth watch the repository and make changes to the running application as needed.
What does the repository actually include? Well, it might be a Helm chart, or a kustomization, or raw manifests, etc. Pretty much anything that could be done in Kubernetes.
Of course, setting this up involves some manual work; you need to actually create the application within Argo CD and, if you want it to hang around, you need to presumably commit that resource to some version control system somewhere. We of course want to be careful who has access to that repository, though, and we might not want engineers to have access to Argo CD itself. So suddenly there's a rather uncomfortable amount of work and coupling in all of this.
GitOps Deployment Patterns
Traditional Application Management Challenges
Manual application creation:
- Platform engineers must create Argo CD Application resources manually
- Direct access to Argo CD UI required for application management
- Configuration drift between different environments
- Difficulty managing permissions and access control at scale
Repository proliferation:
- Each application requires its own repository or subdirectory
- Inconsistent structure and standards across teams
- Complex permission management across multiple repositories
- Operational overhead for maintaining repository access
The App-of-Apps Pattern
A common pattern in Argo CD is the "app-of-apps" pattern. This is simply an Argo CD application pointing to a repository that contains other Argo CD applications. Thus you can have a single application created for you by the principal platform engineer, and you can turn it into fifty or a hundred finely grained pieces of infrastructure that said principal engineer doesn't have to know about 🙂
(If they haven't configured the security settings carefully, it can all just be your little secret 😉)
App-of-Apps Architecture:
Root Application (managed by platform team)
├── Application 1 (e.g., monitoring stack)
├── Application 2 (e.g., ingress controllers)
├── Application 3 (e.g., security tools)
└── Application N (e.g., developer applications)
Benefits of App-of-Apps:
- Single entry point: Platform team manages one root application
- Delegated management: Development teams control their applications
- Hierarchical organization: Logical grouping of related applications
- Simplified bootstrapping: New environments start with root application
Limitations of App-of-Apps:
- Resource proliferation: Each application creates an Application resource
- Dependency management: Complex inter-application dependencies
- Scaling challenges: Manual management of hundreds of applications
- Limited templating: Difficult to apply consistent patterns
ApplicationSet Pattern (Modern Approach)
A (relatively) new construct in Argo CD is the ApplicationSet construct, which seeks to more clearly define how applications are created and fix the problems with the "app-of-apps" approach. That's the approach we will take in this cluster for mature applications.
ApplicationSet Architecture:
ApplicationSet (template-driven)
├── Generator (Git directories, clusters, pull requests)
├── Template (Application template with parameters)
└── Applications (dynamically created from template)
ApplicationSet Generators:
- Git Generator: Scans Git repositories for directories or files
- Cluster Generator: Creates applications across multiple clusters
- List Generator: Creates applications from predefined lists
- Matrix Generator: Combines multiple generators for complex scenarios
Example ApplicationSet Configuration:
apiVersion: argoproj.io/v1alpha1
kind: ApplicationSet
metadata:
  name: gitops-repo
  namespace: argocd
spec:
  generators:
  - scmProvider:
      github:
        organization: goldentooth
        allBranches: false
        labelSelector:
          matchLabels:
            gitops-repo: "true"
  template:
    metadata:
      name: '{{repository}}'
    spec:
      project: gitops-repo
      source:
        repoURL: '{{url}}'
        targetRevision: '{{branch}}'
        path: .
      destination:
        server: https://kubernetes.default.svc
        namespace: '{{repository}}'
      syncPolicy:
        automated:
          prune: true
          selfHeal: true
        syncOptions:
        - CreateNamespace=true
The Incubator Project Strategy
Given that we're operating in a lab environment, we can use the "app-of-apps" approach for the Incubator, which is where we can try out new configurations. We can give it fairly unrestricted access while we work on getting things to deploy correctly, and then lock things down as we zero in on a stable configuration.
Development vs Production Patterns
Incubator (Development):
- App-of-Apps pattern: Manual application management for experimentation
- Permissive security: Broad access for rapid prototyping
- Flexible structure: Accommodate diverse application types
- Quick iteration: Fast deployment and testing cycles
Production (Mature Applications):
- ApplicationSet pattern: Template-driven automation at scale
- Restrictive security: Principle of least privilege
- Standardized structure: Consistent patterns and practices
- Controlled deployment: Change management and approval processes
But meanwhile, we'll create an AppProject manifest for the Incubator:
---
apiVersion: 'argoproj.io/v1alpha1'
kind: 'AppProject'
metadata:
  name: 'incubator'
  # Argo CD resources need to deploy into the Argo CD namespace.
  namespace: 'argocd'
  finalizers:
    - 'resources-finalizer.argocd.argoproj.io'
spec:
  description: 'Goldentooth incubator project'
  # Allow manifests to deploy from any Git repository.
  # This is an acceptable security risk because this is a lab environment
  # and I am the only user.
  sourceRepos:
    - '*'
  destinations:
    # Prevent any resources from deploying into the kube-system namespace.
    - namespace: '!kube-system'
      server: '*'
    # Allow resources to deploy into any other namespace.
    - namespace: '*'
      server: '*'
  clusterResourceWhitelist:
    # Allow any cluster resources to deploy.
    - group: '*'
      kind: '*'
As mentioned before, this is very permissive. It only slightly differs from the default project by preventing resources from deploying into the kube-system namespace.
We'll also create an Application manifest:
apiVersion: 'argoproj.io/v1alpha1'
kind: 'Application'
metadata:
  name: 'incubator'
  namespace: 'argocd'
  labels:
    name: 'incubator'
    managed-by: 'argocd'
spec:
  project: 'incubator'
  source:
    repoURL: "https://github.com/goldentooth/incubator.git"
    path: './'
    targetRevision: 'HEAD'
  destination:
    server: 'https://kubernetes.default.svc'
  syncPolicy:
    automated:
      prune: true
      selfHeal: true
    syncOptions:
      - Validate=true
      - CreateNamespace=true
      - PrunePropagationPolicy=foreground
      - PruneLast=true
      - RespectIgnoreDifferences=true
      - ApplyOutOfSyncOnly=true
That's sufficient to get it to pop up in the Applications view in Argo CD.
AppProject Configuration Deep Dive
Security Boundary Configuration
The AppProject resource provides security boundaries and policy enforcement:
spec:
  description: 'Goldentooth incubator project'
  sourceRepos:
    - '*'  # Allow any Git repository (lab environment only)
  destinations:
    - namespace: '!kube-system'  # Explicit exclusion
      server: '*'
    - namespace: '*'            # Allow all other namespaces
      server: '*'
  clusterResourceWhitelist:
    - group: '*'               # Allow any cluster-scoped resources
      kind: '*'
Security Trade-offs:
- Permissive source repos: Allows rapid experimentation with external charts
- Namespace protection: Prevents accidental modification of system namespaces
- Cluster resource access: Enables testing of operators and custom resources
- Lab environment justification: Security relaxed for learning and development
Production AppProject Example
For comparison, a production AppProject would be much more restrictive:
apiVersion: argoproj.io/v1alpha1
kind: AppProject
metadata:
  name: production-apps
  namespace: argocd
spec:
  description: 'Production applications with strict controls'
  sourceRepos:
    - 'https://github.com/goldentooth/helm-charts'
    - 'https://charts.bitnami.com/bitnami'
  destinations:
    - namespace: 'production-*'
      server: 'https://kubernetes.default.svc'
  clusterResourceWhitelist:
    - group: ''
      kind: 'Namespace'
    - group: 'rbac.authorization.k8s.io'
      kind: 'ClusterRole'
  namespaceResourceWhitelist:
    - group: 'apps'
      kind: 'Deployment'
    - group: ''
      kind: 'Service'
  roles:
    - name: 'developers'
      policies:
        - 'p, proj:production-apps:developers, applications, get, production-apps/*, allow'
        - 'p, proj:production-apps:developers, applications, sync, production-apps/*, allow'
Application Configuration Patterns
Sync Policy Configuration
The Application's sync policy defines automated behavior:
syncPolicy:
  automated:
    prune: true      # Remove resources deleted from Git
    selfHeal: true   # Automatically fix configuration drift
  syncOptions:
    - Validate=true                    # Validate resources before applying
    - CreateNamespace=true             # Auto-create target namespaces
    - PrunePropagationPolicy=foreground # Wait for dependent resources
    - PruneLast=true                   # Delete applications last
    - RespectIgnoreDifferences=true    # Honor ignoreDifferences rules
    - ApplyOutOfSyncOnly=true         # Only apply changed resources
Sync Policy Implications:
- Prune: Ensures Git repository is single source of truth
- Self-heal: Prevents manual changes from persisting
- Validation: Catches configuration errors before deployment
- Namespace creation: Reduces manual setup for new applications
Repository Structure for App-of-Apps
The incubator repository structure supports the app-of-apps pattern:
incubator/
├── README.md
├── applications/
│   ├── monitoring/
│   │   ├── prometheus.yaml
│   │   ├── grafana.yaml
│   │   └── alertmanager.yaml
│   ├── networking/
│   │   ├── metallb.yaml
│   │   ├── external-dns.yaml
│   │   └── cert-manager.yaml
│   └── storage/
│       ├── nfs-provisioner.yaml
│       ├── ceph-operator.yaml
│       └── seaweedfs.yaml
└── environments/
    ├── dev/
    ├── staging/
    └── production/
Directory Organization Benefits:
- Logical grouping: Applications organized by functional area
- Environment separation: Different configurations per environment
- Clear ownership: Teams can own specific directories
- Selective deployment: Enable/disable application groups easily
Integration with ApplicationSets
Migration Path from App-of-Apps
As applications mature, they can be migrated from the incubator to ApplicationSet management:
Migration Steps:
- Stabilize configuration: Test thoroughly in incubator environment
- Create Helm chart: Package application as reusable chart
- Add to gitops-repo: Tag repository for ApplicationSet discovery
- Remove from incubator: Delete Application from incubator repository
- Verify automation: Confirm ApplicationSet creates new Application
Example Migration:
# Before: Manual Application in incubator
apiVersion: argoproj.io/v1alpha1
kind: Application
metadata:
  name: monitoring-stack
  namespace: argocd
spec:
  project: incubator
  source:
    repoURL: 'https://github.com/goldentooth/monitoring'
    path: './manifests'

# After: Automatically generated by ApplicationSet
apiVersion: argoproj.io/v1alpha1
kind: Application
metadata:
  name: monitoring
  namespace: argocd
  ownerReferences:
  - apiVersion: argoproj.io/v1alpha1
    kind: ApplicationSet
    name: gitops-repo
spec:
  project: gitops-repo
  source:
    repoURL: 'https://github.com/goldentooth/monitoring'
    path: '.'
ApplicationSet Template Advantages
Consistent Configuration:
- All applications get same sync policy
- Standardized labeling and annotations
- Uniform security settings across applications
- Reduced configuration drift between applications
Template Parameters:
template:
  metadata:
    name: '{{repository}}'
    labels:
      environment: '{{environment}}'
      team: '{{team}}'
      gitops-managed: 'true'
  spec:
    project: '{{project}}'
    source:
      repoURL: '{{url}}'
      targetRevision: '{{branch}}'
      helm:
        valueFiles:
        - 'values-{{environment}}.yaml'
Operational Workflows
Development Workflow
Incubator Development Process:
- Create feature branch: Develop new application in isolated branch
- Add Application manifest: Define application in incubator repository
- Test deployment: Verify application deploys correctly
- Iterate configuration: Refine settings based on testing
- Merge to main: Deploy to shared incubator environment
- Monitor and debug: Observe application behavior and logs
Production Promotion
Graduation from Incubator:
- Create dedicated repository: Move application to own repository
- Package as Helm chart: Standardize configuration management
- Add gitops-repo label: Enable ApplicationSet discovery
- Configure environments: Set up dev/staging/production values
- Test automation: Verify ApplicationSet creates Application
- Remove from incubator: Clean up experimental Application
Monitoring and Observability
Application Health Monitoring:
# Check application sync status
kubectl -n argocd get applications

# View application details
argocd app get incubator

# Monitor sync operations
argocd app sync incubator --dry-run

# Check for configuration drift
argocd app diff incubator
Common Issues and Troubleshooting:
- Sync failures: Check resource validation and RBAC permissions
- Resource conflicts: Verify namespace isolation and resource naming
- Git access issues: Confirm repository permissions and authentication
- Health check failures: Review application health status and events
Best Practices for GitOps
Repository Management
Separation of Concerns:
- Application code: Business logic and container images
- Configuration: Kubernetes manifests and Helm values
- Infrastructure: Cluster setup and platform services
- Policies: Security rules and governance configurations
Version Control Strategy:
main branch    → Production environment
staging branch → Staging environment
dev branch     → Development environment
feature/*      → Feature testing
Security Considerations
Credential Management:
- Use Argo CD's credential templates for repository access
- Implement least-privilege access for Git repositories
- Rotate credentials regularly and audit access
- Consider using Git over SSH for enhanced security
Resource Isolation:
- Separate AppProjects for different security domains
- Use namespace-based isolation for applications
- Implement RBAC policies aligned with organizational structure
- Monitor cross-namespace resource access
This incubator approach provides a safe environment for experimenting with GitOps patterns while establishing the foundation for scalable, automated application management through ApplicationSets as the platform matures.
Prometheus Node Exporter
Sure, I could just jump straight into kube-prometheus, but where's the fun (and, more importantly, the learning) in that?
I'm going to try to build a system from the ground up, tweaking each component as I go.
Prometheus Node Exporter seems like a reasonable place to begin, as it will give me per-node statistics that I can look at immediately. Or almost immediately.
The first order of business is to modify our incubator repository to refer to the Prometheus Node Exporter Helm chart.
By adding the following in the incubator repo:
# templates/prometheus_node_exporter.yaml
apiVersion: v1
kind: Namespace
metadata:
  name: prometheus-node-exporter
---
apiVersion: argoproj.io/v1alpha1
kind: Application
metadata:
  name: prometheus-node-exporter
  namespace: argocd
  finalizers:
    - resources-finalizer.argocd.argoproj.io
spec:
  destination:
    namespace: prometheus-node-exporter
    server: 'https://kubernetes.default.svc'
  project: incubator
  source:
    repoURL: https://prometheus-community.github.io/helm-charts
    chart: prometheus-node-exporter
    targetRevision: 4.31.0
    helm:
      releaseName: prometheus-node-exporter
We'll soon see the resources created:
And we can curl a metric butt-ton of information:
$ curl localhost:9100/metrics
# HELP go_gc_duration_seconds A summary of the pause duration of garbage collection cycles.
# TYPE go_gc_duration_seconds summary
go_gc_duration_seconds{quantile="0"} 0
go_gc_duration_seconds{quantile="0.25"} 0
go_gc_duration_seconds{quantile="0.5"} 0
go_gc_duration_seconds{quantile="0.75"} 0
go_gc_duration_seconds{quantile="1"} 0
go_gc_duration_seconds_sum 0
go_gc_duration_seconds_count 0
# HELP go_goroutines Number of goroutines that currently exist.
# TYPE go_goroutines gauge
go_goroutines 7
# HELP go_info Information about the Go environment.
# TYPE go_info gauge
go_info{version="go1.21.4"} 1
# HELP go_memstats_alloc_bytes Number of bytes allocated and still in use.
# TYPE go_memstats_alloc_bytes gauge
go_memstats_alloc_bytes 829976
# HELP go_memstats_alloc_bytes_total Total number of bytes allocated, even if freed.
# TYPE go_memstats_alloc_bytes_total counter
go_memstats_alloc_bytes_total 829976
# HELP go_memstats_buck_hash_sys_bytes Number of bytes used by the profiling bucket hash table.
# TYPE go_memstats_buck_hash_sys_bytes gauge
go_memstats_buck_hash_sys_bytes 1.445756e+06
# HELP go_memstats_frees_total Total number of frees.
# TYPE go_memstats_frees_total counter
go_memstats_frees_total 704
# HELP go_memstats_gc_sys_bytes Number of bytes used for garbage collection system metadata.
# TYPE go_memstats_gc_sys_bytes gauge
go_memstats_gc_sys_bytes 2.909376e+06
# HELP go_memstats_heap_alloc_bytes Number of heap bytes allocated and still in use.
# TYPE go_memstats_heap_alloc_bytes gauge
go_memstats_heap_alloc_bytes 829976
# HELP go_memstats_heap_idle_bytes Number of heap bytes waiting to be used.
# TYPE go_memstats_heap_idle_bytes gauge
go_memstats_heap_idle_bytes 1.458176e+06
# HELP go_memstats_heap_inuse_bytes Number of heap bytes that are in use.
# TYPE go_memstats_heap_inuse_bytes gauge
go_memstats_heap_inuse_bytes 2.310144e+06
# HELP go_memstats_heap_objects Number of allocated objects.
# TYPE go_memstats_heap_objects gauge
go_memstats_heap_objects 8628
# HELP go_memstats_heap_released_bytes Number of heap bytes released to OS.
# TYPE go_memstats_heap_released_bytes gauge
go_memstats_heap_released_bytes 1.458176e+06
# HELP go_memstats_heap_sys_bytes Number of heap bytes obtained from system.
# TYPE go_memstats_heap_sys_bytes gauge
go_memstats_heap_sys_bytes 3.76832e+06
# HELP go_memstats_last_gc_time_seconds Number of seconds since 1970 of last garbage collection.
# TYPE go_memstats_last_gc_time_seconds gauge
go_memstats_last_gc_time_seconds 0
# HELP go_memstats_lookups_total Total number of pointer lookups.
# TYPE go_memstats_lookups_total counter
go_memstats_lookups_total 0
# HELP go_memstats_mallocs_total Total number of mallocs.
# TYPE go_memstats_mallocs_total counter
go_memstats_mallocs_total 9332
# HELP go_memstats_mcache_inuse_bytes Number of bytes in use by mcache structures.
# TYPE go_memstats_mcache_inuse_bytes gauge
go_memstats_mcache_inuse_bytes 1200
# HELP go_memstats_mcache_sys_bytes Number of bytes used for mcache structures obtained from system.
# TYPE go_memstats_mcache_sys_bytes gauge
go_memstats_mcache_sys_bytes 15600
# HELP go_memstats_mspan_inuse_bytes Number of bytes in use by mspan structures.
# TYPE go_memstats_mspan_inuse_bytes gauge
go_memstats_mspan_inuse_bytes 37968
# HELP go_memstats_mspan_sys_bytes Number of bytes used for mspan structures obtained from system.
# TYPE go_memstats_mspan_sys_bytes gauge
go_memstats_mspan_sys_bytes 48888
# HELP go_memstats_next_gc_bytes Number of heap bytes when next garbage collection will take place.
# TYPE go_memstats_next_gc_bytes gauge
go_memstats_next_gc_bytes 4.194304e+06
# HELP go_memstats_other_sys_bytes Number of bytes used for other system allocations.
# TYPE go_memstats_other_sys_bytes gauge
go_memstats_other_sys_bytes 795876
# HELP go_memstats_stack_inuse_bytes Number of bytes in use by the stack allocator.
# TYPE go_memstats_stack_inuse_bytes gauge
go_memstats_stack_inuse_bytes 425984
# HELP go_memstats_stack_sys_bytes Number of bytes obtained from system for stack allocator.
# TYPE go_memstats_stack_sys_bytes gauge
go_memstats_stack_sys_bytes 425984
# HELP go_memstats_sys_bytes Number of bytes obtained from system.
# TYPE go_memstats_sys_bytes gauge
go_memstats_sys_bytes 9.4098e+06
# HELP go_threads Number of OS threads created.
# TYPE go_threads gauge
go_threads 6
# HELP node_boot_time_seconds Node boot time, in unixtime.
# TYPE node_boot_time_seconds gauge
node_boot_time_seconds 1.706835386e+09
# HELP node_context_switches_total Total number of context switches.
# TYPE node_context_switches_total counter
node_context_switches_total 1.8612307682e+10
# HELP node_cooling_device_cur_state Current throttle state of the cooling device
# TYPE node_cooling_device_cur_state gauge
node_cooling_device_cur_state{name="0",type="gpio-fan"} 1
# HELP node_cooling_device_max_state Maximum throttle state of the cooling device
# TYPE node_cooling_device_max_state gauge
node_cooling_device_max_state{name="0",type="gpio-fan"} 1
# HELP node_cpu_frequency_max_hertz Maximum CPU thread frequency in hertz.
# TYPE node_cpu_frequency_max_hertz gauge
node_cpu_frequency_max_hertz{cpu="0"} 2e+09
node_cpu_frequency_max_hertz{cpu="1"} 2e+09
node_cpu_frequency_max_hertz{cpu="2"} 2e+09
node_cpu_frequency_max_hertz{cpu="3"} 2e+09
# HELP node_cpu_frequency_min_hertz Minimum CPU thread frequency in hertz.
# TYPE node_cpu_frequency_min_hertz gauge
node_cpu_frequency_min_hertz{cpu="0"} 6e+08
node_cpu_frequency_min_hertz{cpu="1"} 6e+08
node_cpu_frequency_min_hertz{cpu="2"} 6e+08
node_cpu_frequency_min_hertz{cpu="3"} 6e+08
# HELP node_cpu_guest_seconds_total Seconds the CPUs spent in guests (VMs) for each mode.
# TYPE node_cpu_guest_seconds_total counter
node_cpu_guest_seconds_total{cpu="0",mode="nice"} 0
node_cpu_guest_seconds_total{cpu="0",mode="user"} 0
node_cpu_guest_seconds_total{cpu="1",mode="nice"} 0
node_cpu_guest_seconds_total{cpu="1",mode="user"} 0
node_cpu_guest_seconds_total{cpu="2",mode="nice"} 0
node_cpu_guest_seconds_total{cpu="2",mode="user"} 0
node_cpu_guest_seconds_total{cpu="3",mode="nice"} 0
node_cpu_guest_seconds_total{cpu="3",mode="user"} 0
# HELP node_cpu_scaling_frequency_hertz Current scaled CPU thread frequency in hertz.
# TYPE node_cpu_scaling_frequency_hertz gauge
node_cpu_scaling_frequency_hertz{cpu="0"} 2e+09
node_cpu_scaling_frequency_hertz{cpu="1"} 2e+09
node_cpu_scaling_frequency_hertz{cpu="2"} 2e+09
node_cpu_scaling_frequency_hertz{cpu="3"} 7e+08
# HELP node_cpu_scaling_frequency_max_hertz Maximum scaled CPU thread frequency in hertz.
# TYPE node_cpu_scaling_frequency_max_hertz gauge
node_cpu_scaling_frequency_max_hertz{cpu="0"} 2e+09
node_cpu_scaling_frequency_max_hertz{cpu="1"} 2e+09
node_cpu_scaling_frequency_max_hertz{cpu="2"} 2e+09
node_cpu_scaling_frequency_max_hertz{cpu="3"} 2e+09
# HELP node_cpu_scaling_frequency_min_hertz Minimum scaled CPU thread frequency in hertz.
# TYPE node_cpu_scaling_frequency_min_hertz gauge
node_cpu_scaling_frequency_min_hertz{cpu="0"} 6e+08
node_cpu_scaling_frequency_min_hertz{cpu="1"} 6e+08
node_cpu_scaling_frequency_min_hertz{cpu="2"} 6e+08
node_cpu_scaling_frequency_min_hertz{cpu="3"} 6e+08
# HELP node_cpu_scaling_governor Current enabled CPU frequency governor.
# TYPE node_cpu_scaling_governor gauge
node_cpu_scaling_governor{cpu="0",governor="conservative"} 0
node_cpu_scaling_governor{cpu="0",governor="ondemand"} 1
node_cpu_scaling_governor{cpu="0",governor="performance"} 0
node_cpu_scaling_governor{cpu="0",governor="powersave"} 0
node_cpu_scaling_governor{cpu="0",governor="schedutil"} 0
node_cpu_scaling_governor{cpu="0",governor="userspace"} 0
node_cpu_scaling_governor{cpu="1",governor="conservative"} 0
node_cpu_scaling_governor{cpu="1",governor="ondemand"} 1
node_cpu_scaling_governor{cpu="1",governor="performance"} 0
node_cpu_scaling_governor{cpu="1",governor="powersave"} 0
node_cpu_scaling_governor{cpu="1",governor="schedutil"} 0
node_cpu_scaling_governor{cpu="1",governor="userspace"} 0
node_cpu_scaling_governor{cpu="2",governor="conservative"} 0
node_cpu_scaling_governor{cpu="2",governor="ondemand"} 1
node_cpu_scaling_governor{cpu="2",governor="performance"} 0
node_cpu_scaling_governor{cpu="2",governor="powersave"} 0
node_cpu_scaling_governor{cpu="2",governor="schedutil"} 0
node_cpu_scaling_governor{cpu="2",governor="userspace"} 0
node_cpu_scaling_governor{cpu="3",governor="conservative"} 0
node_cpu_scaling_governor{cpu="3",governor="ondemand"} 1
node_cpu_scaling_governor{cpu="3",governor="performance"} 0
node_cpu_scaling_governor{cpu="3",governor="powersave"} 0
node_cpu_scaling_governor{cpu="3",governor="schedutil"} 0
node_cpu_scaling_governor{cpu="3",governor="userspace"} 0
# HELP node_cpu_seconds_total Seconds the CPUs spent in each mode.
# TYPE node_cpu_seconds_total counter
node_cpu_seconds_total{cpu="0",mode="idle"} 2.68818165e+06
node_cpu_seconds_total{cpu="0",mode="iowait"} 8376.2
node_cpu_seconds_total{cpu="0",mode="irq"} 0
node_cpu_seconds_total{cpu="0",mode="nice"} 64.64
node_cpu_seconds_total{cpu="0",mode="softirq"} 17095.42
node_cpu_seconds_total{cpu="0",mode="steal"} 0
node_cpu_seconds_total{cpu="0",mode="system"} 69354.3
node_cpu_seconds_total{cpu="0",mode="user"} 100985.22
node_cpu_seconds_total{cpu="1",mode="idle"} 2.70092994e+06
node_cpu_seconds_total{cpu="1",mode="iowait"} 10578.32
node_cpu_seconds_total{cpu="1",mode="irq"} 0
node_cpu_seconds_total{cpu="1",mode="nice"} 61.07
node_cpu_seconds_total{cpu="1",mode="softirq"} 3442.94
node_cpu_seconds_total{cpu="1",mode="steal"} 0
node_cpu_seconds_total{cpu="1",mode="system"} 72718.57
node_cpu_seconds_total{cpu="1",mode="user"} 112849.28
node_cpu_seconds_total{cpu="2",mode="idle"} 2.70036651e+06
node_cpu_seconds_total{cpu="2",mode="iowait"} 10596.56
node_cpu_seconds_total{cpu="2",mode="irq"} 0
node_cpu_seconds_total{cpu="2",mode="nice"} 44.05
node_cpu_seconds_total{cpu="2",mode="softirq"} 3462.77
node_cpu_seconds_total{cpu="2",mode="steal"} 0
node_cpu_seconds_total{cpu="2",mode="system"} 73257.94
node_cpu_seconds_total{cpu="2",mode="user"} 112932.46
node_cpu_seconds_total{cpu="3",mode="idle"} 2.7039725e+06
node_cpu_seconds_total{cpu="3",mode="iowait"} 10525.98
node_cpu_seconds_total{cpu="3",mode="irq"} 0
node_cpu_seconds_total{cpu="3",mode="nice"} 56.42
node_cpu_seconds_total{cpu="3",mode="softirq"} 3434.8
node_cpu_seconds_total{cpu="3",mode="steal"} 0
node_cpu_seconds_total{cpu="3",mode="system"} 71924.93
node_cpu_seconds_total{cpu="3",mode="user"} 111615.13
# HELP node_disk_discard_time_seconds_total This is the total number of seconds spent by all discards.
# TYPE node_disk_discard_time_seconds_total counter
node_disk_discard_time_seconds_total{device="mmcblk0"} 6.008
node_disk_discard_time_seconds_total{device="mmcblk0p1"} 0.11800000000000001
node_disk_discard_time_seconds_total{device="mmcblk0p2"} 5.889
# HELP node_disk_discarded_sectors_total The total number of sectors discarded successfully.
# TYPE node_disk_discarded_sectors_total counter
node_disk_discarded_sectors_total{device="mmcblk0"} 2.7187894e+08
node_disk_discarded_sectors_total{device="mmcblk0p1"} 4.57802e+06
node_disk_discarded_sectors_total{device="mmcblk0p2"} 2.6730092e+08
# HELP node_disk_discards_completed_total The total number of discards completed successfully.
# TYPE node_disk_discards_completed_total counter
node_disk_discards_completed_total{device="mmcblk0"} 1330
node_disk_discards_completed_total{device="mmcblk0p1"} 20
node_disk_discards_completed_total{device="mmcblk0p2"} 1310
# HELP node_disk_discards_merged_total The total number of discards merged.
# TYPE node_disk_discards_merged_total counter
node_disk_discards_merged_total{device="mmcblk0"} 306
node_disk_discards_merged_total{device="mmcblk0p1"} 20
node_disk_discards_merged_total{device="mmcblk0p2"} 286
# HELP node_disk_filesystem_info Info about disk filesystem.
# TYPE node_disk_filesystem_info gauge
node_disk_filesystem_info{device="mmcblk0p1",type="vfat",usage="filesystem",uuid="5DF9-E225",version="FAT32"} 1
node_disk_filesystem_info{device="mmcblk0p2",type="ext4",usage="filesystem",uuid="3b614a3f-4a65-4480-876a-8a998e01ac9b",version="1.0"} 1
# HELP node_disk_flush_requests_time_seconds_total This is the total number of seconds spent by all flush requests.
# TYPE node_disk_flush_requests_time_seconds_total counter
node_disk_flush_requests_time_seconds_total{device="mmcblk0"} 4597.003
node_disk_flush_requests_time_seconds_total{device="mmcblk0p1"} 0
node_disk_flush_requests_time_seconds_total{device="mmcblk0p2"} 0
# HELP node_disk_flush_requests_total The total number of flush requests completed successfully
# TYPE node_disk_flush_requests_total counter
node_disk_flush_requests_total{device="mmcblk0"} 2.0808855e+07
node_disk_flush_requests_total{device="mmcblk0p1"} 0
node_disk_flush_requests_total{device="mmcblk0p2"} 0
# HELP node_disk_info Info of /sys/block/<block_device>.
# TYPE node_disk_info gauge
node_disk_info{device="mmcblk0",major="179",minor="0",model="",path="platform-fe340000.mmc",revision="",serial="",wwn=""} 1
node_disk_info{device="mmcblk0p1",major="179",minor="1",model="",path="platform-fe340000.mmc",revision="",serial="",wwn=""} 1
node_disk_info{device="mmcblk0p2",major="179",minor="2",model="",path="platform-fe340000.mmc",revision="",serial="",wwn=""} 1
# HELP node_disk_io_now The number of I/Os currently in progress.
# TYPE node_disk_io_now gauge
node_disk_io_now{device="mmcblk0"} 0
node_disk_io_now{device="mmcblk0p1"} 0
node_disk_io_now{device="mmcblk0p2"} 0
# HELP node_disk_io_time_seconds_total Total seconds spent doing I/Os.
# TYPE node_disk_io_time_seconds_total counter
node_disk_io_time_seconds_total{device="mmcblk0"} 109481.804
node_disk_io_time_seconds_total{device="mmcblk0p1"} 4.172
node_disk_io_time_seconds_total{device="mmcblk0p2"} 109479.144
# HELP node_disk_io_time_weighted_seconds_total The weighted # of seconds spent doing I/Os.
# TYPE node_disk_io_time_weighted_seconds_total counter
node_disk_io_time_weighted_seconds_total{device="mmcblk0"} 254357.374
node_disk_io_time_weighted_seconds_total{device="mmcblk0p1"} 168.897
node_disk_io_time_weighted_seconds_total{device="mmcblk0p2"} 249591.36000000002
# HELP node_disk_read_bytes_total The total number of bytes read successfully.
# TYPE node_disk_read_bytes_total counter
node_disk_read_bytes_total{device="mmcblk0"} 1.142326272e+09
node_disk_read_bytes_total{device="mmcblk0p1"} 8.704e+06
node_disk_read_bytes_total{device="mmcblk0p2"} 1.132397568e+09
# HELP node_disk_read_time_seconds_total The total number of seconds spent by all reads.
# TYPE node_disk_read_time_seconds_total counter
node_disk_read_time_seconds_total{device="mmcblk0"} 72.763
node_disk_read_time_seconds_total{device="mmcblk0p1"} 0.8140000000000001
node_disk_read_time_seconds_total{device="mmcblk0p2"} 71.888
# HELP node_disk_reads_completed_total The total number of reads completed successfully.
# TYPE node_disk_reads_completed_total counter
node_disk_reads_completed_total{device="mmcblk0"} 26194
node_disk_reads_completed_total{device="mmcblk0p1"} 234
node_disk_reads_completed_total{device="mmcblk0p2"} 25885
# HELP node_disk_reads_merged_total The total number of reads merged.
# TYPE node_disk_reads_merged_total counter
node_disk_reads_merged_total{device="mmcblk0"} 4740
node_disk_reads_merged_total{device="mmcblk0p1"} 1119
node_disk_reads_merged_total{device="mmcblk0p2"} 3621
# HELP node_disk_write_time_seconds_total This is the total number of seconds spent by all writes.
# TYPE node_disk_write_time_seconds_total counter
node_disk_write_time_seconds_total{device="mmcblk0"} 249681.59900000002
node_disk_write_time_seconds_total{device="mmcblk0p1"} 167.964
node_disk_write_time_seconds_total{device="mmcblk0p2"} 249513.581
# HELP node_disk_writes_completed_total The total number of writes completed successfully.
# TYPE node_disk_writes_completed_total counter
node_disk_writes_completed_total{device="mmcblk0"} 6.356576e+07
node_disk_writes_completed_total{device="mmcblk0p1"} 749
node_disk_writes_completed_total{device="mmcblk0p2"} 6.3564908e+07
# HELP node_disk_writes_merged_total The number of writes merged.
# TYPE node_disk_writes_merged_total counter
node_disk_writes_merged_total{device="mmcblk0"} 9.074629e+06
node_disk_writes_merged_total{device="mmcblk0p1"} 1554
node_disk_writes_merged_total{device="mmcblk0p2"} 9.073075e+06
# HELP node_disk_written_bytes_total The total number of bytes written successfully.
# TYPE node_disk_written_bytes_total counter
node_disk_written_bytes_total{device="mmcblk0"} 2.61909222912e+11
node_disk_written_bytes_total{device="mmcblk0p1"} 8.3293696e+07
node_disk_written_bytes_total{device="mmcblk0p2"} 2.61825929216e+11
# HELP node_entropy_available_bits Bits of available entropy.
# TYPE node_entropy_available_bits gauge
node_entropy_available_bits 256
# HELP node_entropy_pool_size_bits Bits of entropy pool.
# TYPE node_entropy_pool_size_bits gauge
node_entropy_pool_size_bits 256
# HELP node_exporter_build_info A metric with a constant '1' value labeled by version, revision, branch, goversion from which node_exporter was built, and the goos and goarch for the build.
# TYPE node_exporter_build_info gauge
node_exporter_build_info{branch="HEAD",goarch="arm64",goos="linux",goversion="go1.21.4",revision="7333465abf9efba81876303bb57e6fadb946041b",tags="netgo osusergo static_build",version="1.7.0"} 1
# HELP node_filefd_allocated File descriptor statistics: allocated.
# TYPE node_filefd_allocated gauge
node_filefd_allocated 2080
# HELP node_filefd_maximum File descriptor statistics: maximum.
# TYPE node_filefd_maximum gauge
node_filefd_maximum 9.223372036854776e+18
# HELP node_filesystem_avail_bytes Filesystem space available to non-root users in bytes.
# TYPE node_filesystem_avail_bytes gauge
node_filesystem_avail_bytes{device="/dev/mmcblk0p1",fstype="vfat",mountpoint="/boot/firmware"} 4.6998528e+08
node_filesystem_avail_bytes{device="/dev/mmcblk0p2",fstype="ext4",mountpoint="/"} 1.12564281344e+11
node_filesystem_avail_bytes{device="shm",fstype="tmpfs",mountpoint="/run/containerd/io.containerd.grpc.v1.cri/sandboxes/0208f7a11dc33d5bc8bd289bad919bb17181316989d0b67797b9bc600eca5feb/shm"} 6.7108864e+07
node_filesystem_avail_bytes{device="shm",fstype="tmpfs",mountpoint="/run/containerd/io.containerd.grpc.v1.cri/sandboxes/11d4155c4c3ccf57a41200b7ec3de847c49956a051889aed26bcb0efe751d221/shm"} 6.7108864e+07
node_filesystem_avail_bytes{device="shm",fstype="tmpfs",mountpoint="/run/containerd/io.containerd.grpc.v1.cri/sandboxes/29e8b6a960d1f80aa5dba931d282e3e896f4689b6d27e0f29296860ac03fa6b4/shm"} 6.7108864e+07
node_filesystem_avail_bytes{device="shm",fstype="tmpfs",mountpoint="/run/containerd/io.containerd.grpc.v1.cri/sandboxes/3577c3db4143954a3f4213a5a6dedd3dfb336f135900eecf207414ad4770f1b0/shm"} 6.7108864e+07
node_filesystem_avail_bytes{device="shm",fstype="tmpfs",mountpoint="/run/containerd/io.containerd.grpc.v1.cri/sandboxes/576fad5789d19fda4bfcc5999d388e6f99e262000d11112356e37c6a929059ed/shm"} 6.7108864e+07
node_filesystem_avail_bytes{device="shm",fstype="tmpfs",mountpoint="/run/containerd/io.containerd.grpc.v1.cri/sandboxes/8524e37b55f671a6cb14491142d00badcfe7dc62a7e73540d107378f68b68667/shm"} 6.7108864e+07
node_filesystem_avail_bytes{device="shm",fstype="tmpfs",mountpoint="/run/containerd/io.containerd.grpc.v1.cri/sandboxes/a15cd8217349b0597cc3fb05844d99db669880444ca3957a26e5c57c326550c0/shm"} 6.7108864e+07
node_filesystem_avail_bytes{device="shm",fstype="tmpfs",mountpoint="/run/containerd/io.containerd.grpc.v1.cri/sandboxes/d2d3f63c7fd3e21f208a8a2a2d0428cc248f979655bc87ad89e38f6f93e7d1ac/shm"} 6.7108864e+07
node_filesystem_avail_bytes{device="shm",fstype="tmpfs",mountpoint="/run/containerd/io.containerd.grpc.v1.cri/sandboxes/e9738e9d4d1902e832e290dfac1f0a6b6a1d87ba172c64818a032f0ae131b124/shm"} 6.7108864e+07
node_filesystem_avail_bytes{device="shm",fstype="tmpfs",mountpoint="/run/containerd/io.containerd.grpc.v1.cri/sandboxes/eea73d4ab31da1cdcbbbfe69e4c1e3b2338d7b659fee3d8e05a33b3e6cf4638c/shm"} 6.7108864e+07
node_filesystem_avail_bytes{device="tmpfs",fstype="tmpfs",mountpoint="/run"} 8.16193536e+08
node_filesystem_avail_bytes{device="tmpfs",fstype="tmpfs",mountpoint="/run/lock"} 5.226496e+06
node_filesystem_avail_bytes{device="tmpfs",fstype="tmpfs",mountpoint="/run/user/1000"} 8.19064832e+08
# HELP node_filesystem_device_error Whether an error occurred while getting statistics for the given device.
# TYPE node_filesystem_device_error gauge
node_filesystem_device_error{device="/dev/mmcblk0p1",fstype="vfat",mountpoint="/boot/firmware"} 0
node_filesystem_device_error{device="/dev/mmcblk0p2",fstype="ext4",mountpoint="/"} 0
node_filesystem_device_error{device="shm",fstype="tmpfs",mountpoint="/run/containerd/io.containerd.grpc.v1.cri/sandboxes/0208f7a11dc33d5bc8bd289bad919bb17181316989d0b67797b9bc600eca5feb/shm"} 0
node_filesystem_device_error{device="shm",fstype="tmpfs",mountpoint="/run/containerd/io.containerd.grpc.v1.cri/sandboxes/11d4155c4c3ccf57a41200b7ec3de847c49956a051889aed26bcb0efe751d221/shm"} 0
node_filesystem_device_error{device="shm",fstype="tmpfs",mountpoint="/run/containerd/io.containerd.grpc.v1.cri/sandboxes/29e8b6a960d1f80aa5dba931d282e3e896f4689b6d27e0f29296860ac03fa6b4/shm"} 0
node_filesystem_device_error{device="shm",fstype="tmpfs",mountpoint="/run/containerd/io.containerd.grpc.v1.cri/sandboxes/3577c3db4143954a3f4213a5a6dedd3dfb336f135900eecf207414ad4770f1b0/shm"} 0
node_filesystem_device_error{device="shm",fstype="tmpfs",mountpoint="/run/containerd/io.containerd.grpc.v1.cri/sandboxes/576fad5789d19fda4bfcc5999d388e6f99e262000d11112356e37c6a929059ed/shm"} 0
node_filesystem_device_error{device="shm",fstype="tmpfs",mountpoint="/run/containerd/io.containerd.grpc.v1.cri/sandboxes/8524e37b55f671a6cb14491142d00badcfe7dc62a7e73540d107378f68b68667/shm"} 0
node_filesystem_device_error{device="shm",fstype="tmpfs",mountpoint="/run/containerd/io.containerd.grpc.v1.cri/sandboxes/a15cd8217349b0597cc3fb05844d99db669880444ca3957a26e5c57c326550c0/shm"} 0
node_filesystem_device_error{device="shm",fstype="tmpfs",mountpoint="/run/containerd/io.containerd.grpc.v1.cri/sandboxes/d2d3f63c7fd3e21f208a8a2a2d0428cc248f979655bc87ad89e38f6f93e7d1ac/shm"} 0
node_filesystem_device_error{device="shm",fstype="tmpfs",mountpoint="/run/containerd/io.containerd.grpc.v1.cri/sandboxes/e9738e9d4d1902e832e290dfac1f0a6b6a1d87ba172c64818a032f0ae131b124/shm"} 0
node_filesystem_device_error{device="shm",fstype="tmpfs",mountpoint="/run/containerd/io.containerd.grpc.v1.cri/sandboxes/eea73d4ab31da1cdcbbbfe69e4c1e3b2338d7b659fee3d8e05a33b3e6cf4638c/shm"} 0
node_filesystem_device_error{device="tmpfs",fstype="tmpfs",mountpoint="/run"} 0
node_filesystem_device_error{device="tmpfs",fstype="tmpfs",mountpoint="/run/lock"} 0
node_filesystem_device_error{device="tmpfs",fstype="tmpfs",mountpoint="/run/user/1000"} 0
node_filesystem_device_error{device="tmpfs",fstype="tmpfs",mountpoint="/var/lib/kubelet/pods/0e619376-d2fe-4f79-bc74-64fe5b3c8232/volumes/kubernetes.io~projected/kube-api-access-2f5p9"} 1
node_filesystem_device_error{device="tmpfs",fstype="tmpfs",mountpoint="/var/lib/kubelet/pods/61bde493-1e9f-4d4d-b77f-1df095f775c4/volumes/kubernetes.io~projected/kube-api-access-rdrm2"} 1
node_filesystem_device_error{device="tmpfs",fstype="tmpfs",mountpoint="/var/lib/kubelet/pods/878c2007-167d-4437-b654-43ef9cc0a5f0/volumes/kubernetes.io~projected/kube-api-access-j5fzh"} 1
node_filesystem_device_error{device="tmpfs",fstype="tmpfs",mountpoint="/var/lib/kubelet/pods/9660f563-0f88-41aa-9d38-654911a04158/volumes/kubernetes.io~projected/kube-api-access-n494p"} 1
node_filesystem_device_error{device="tmpfs",fstype="tmpfs",mountpoint="/var/lib/kubelet/pods/c008ef0e-9212-42ce-9a34-6ccaf6b087d1/volumes/kubernetes.io~projected/kube-api-access-9c8sx"} 1
# HELP node_filesystem_files Filesystem total file nodes.
# TYPE node_filesystem_files gauge
node_filesystem_files{device="/dev/mmcblk0p1",fstype="vfat",mountpoint="/boot/firmware"} 0
node_filesystem_files{device="/dev/mmcblk0p2",fstype="ext4",mountpoint="/"} 7.500896e+06
node_filesystem_files{device="shm",fstype="tmpfs",mountpoint="/run/containerd/io.containerd.grpc.v1.cri/sandboxes/0208f7a11dc33d5bc8bd289bad919bb17181316989d0b67797b9bc600eca5feb/shm"} 999839
node_filesystem_files{device="shm",fstype="tmpfs",mountpoint="/run/containerd/io.containerd.grpc.v1.cri/sandboxes/11d4155c4c3ccf57a41200b7ec3de847c49956a051889aed26bcb0efe751d221/shm"} 999839
node_filesystem_files{device="shm",fstype="tmpfs",mountpoint="/run/containerd/io.containerd.grpc.v1.cri/sandboxes/29e8b6a960d1f80aa5dba931d282e3e896f4689b6d27e0f29296860ac03fa6b4/shm"} 999839
node_filesystem_files{device="shm",fstype="tmpfs",mountpoint="/run/containerd/io.containerd.grpc.v1.cri/sandboxes/3577c3db4143954a3f4213a5a6dedd3dfb336f135900eecf207414ad4770f1b0/shm"} 999839
node_filesystem_files{device="shm",fstype="tmpfs",mountpoint="/run/containerd/io.containerd.grpc.v1.cri/sandboxes/576fad5789d19fda4bfcc5999d388e6f99e262000d11112356e37c6a929059ed/shm"} 999839
node_filesystem_files{device="shm",fstype="tmpfs",mountpoint="/run/containerd/io.containerd.grpc.v1.cri/sandboxes/8524e37b55f671a6cb14491142d00badcfe7dc62a7e73540d107378f68b68667/shm"} 999839
node_filesystem_files{device="shm",fstype="tmpfs",mountpoint="/run/containerd/io.containerd.grpc.v1.cri/sandboxes/a15cd8217349b0597cc3fb05844d99db669880444ca3957a26e5c57c326550c0/shm"} 999839
node_filesystem_files{device="shm",fstype="tmpfs",mountpoint="/run/containerd/io.containerd.grpc.v1.cri/sandboxes/d2d3f63c7fd3e21f208a8a2a2d0428cc248f979655bc87ad89e38f6f93e7d1ac/shm"} 999839
node_filesystem_files{device="shm",fstype="tmpfs",mountpoint="/run/containerd/io.containerd.grpc.v1.cri/sandboxes/e9738e9d4d1902e832e290dfac1f0a6b6a1d87ba172c64818a032f0ae131b124/shm"} 999839
node_filesystem_files{device="shm",fstype="tmpfs",mountpoint="/run/containerd/io.containerd.grpc.v1.cri/sandboxes/eea73d4ab31da1cdcbbbfe69e4c1e3b2338d7b659fee3d8e05a33b3e6cf4638c/shm"} 999839
node_filesystem_files{device="tmpfs",fstype="tmpfs",mountpoint="/run"} 999839
node_filesystem_files{device="tmpfs",fstype="tmpfs",mountpoint="/run/lock"} 999839
node_filesystem_files{device="tmpfs",fstype="tmpfs",mountpoint="/run/user/1000"} 199967
# HELP node_filesystem_files_free Filesystem total free file nodes.
# TYPE node_filesystem_files_free gauge
node_filesystem_files_free{device="/dev/mmcblk0p1",fstype="vfat",mountpoint="/boot/firmware"} 0
node_filesystem_files_free{device="/dev/mmcblk0p2",fstype="ext4",mountpoint="/"} 7.421624e+06
node_filesystem_files_free{device="shm",fstype="tmpfs",mountpoint="/run/containerd/io.containerd.grpc.v1.cri/sandboxes/0208f7a11dc33d5bc8bd289bad919bb17181316989d0b67797b9bc600eca5feb/shm"} 999838
node_filesystem_files_free{device="shm",fstype="tmpfs",mountpoint="/run/containerd/io.containerd.grpc.v1.cri/sandboxes/11d4155c4c3ccf57a41200b7ec3de847c49956a051889aed26bcb0efe751d221/shm"} 999838
node_filesystem_files_free{device="shm",fstype="tmpfs",mountpoint="/run/containerd/io.containerd.grpc.v1.cri/sandboxes/29e8b6a960d1f80aa5dba931d282e3e896f4689b6d27e0f29296860ac03fa6b4/shm"} 999838
node_filesystem_files_free{device="shm",fstype="tmpfs",mountpoint="/run/containerd/io.containerd.grpc.v1.cri/sandboxes/3577c3db4143954a3f4213a5a6dedd3dfb336f135900eecf207414ad4770f1b0/shm"} 999838
node_filesystem_files_free{device="shm",fstype="tmpfs",mountpoint="/run/containerd/io.containerd.grpc.v1.cri/sandboxes/576fad5789d19fda4bfcc5999d388e6f99e262000d11112356e37c6a929059ed/shm"} 999838
node_filesystem_files_free{device="shm",fstype="tmpfs",mountpoint="/run/containerd/io.containerd.grpc.v1.cri/sandboxes/8524e37b55f671a6cb14491142d00badcfe7dc62a7e73540d107378f68b68667/shm"} 999838
node_filesystem_files_free{device="shm",fstype="tmpfs",mountpoint="/run/containerd/io.containerd.grpc.v1.cri/sandboxes/a15cd8217349b0597cc3fb05844d99db669880444ca3957a26e5c57c326550c0/shm"} 999838
node_filesystem_files_free{device="shm",fstype="tmpfs",mountpoint="/run/containerd/io.containerd.grpc.v1.cri/sandboxes/d2d3f63c7fd3e21f208a8a2a2d0428cc248f979655bc87ad89e38f6f93e7d1ac/shm"} 999838
node_filesystem_files_free{device="shm",fstype="tmpfs",mountpoint="/run/containerd/io.containerd.grpc.v1.cri/sandboxes/e9738e9d4d1902e832e290dfac1f0a6b6a1d87ba172c64818a032f0ae131b124/shm"} 999838
node_filesystem_files_free{device="shm",fstype="tmpfs",mountpoint="/run/containerd/io.containerd.grpc.v1.cri/sandboxes/eea73d4ab31da1cdcbbbfe69e4c1e3b2338d7b659fee3d8e05a33b3e6cf4638c/shm"} 999838
node_filesystem_files_free{device="tmpfs",fstype="tmpfs",mountpoint="/run"} 998519
node_filesystem_files_free{device="tmpfs",fstype="tmpfs",mountpoint="/run/lock"} 999833
node_filesystem_files_free{device="tmpfs",fstype="tmpfs",mountpoint="/run/user/1000"} 199947
# HELP node_filesystem_free_bytes Filesystem free space in bytes.
# TYPE node_filesystem_free_bytes gauge
node_filesystem_free_bytes{device="/dev/mmcblk0p1",fstype="vfat",mountpoint="/boot/firmware"} 4.6998528e+08
node_filesystem_free_bytes{device="/dev/mmcblk0p2",fstype="ext4",mountpoint="/"} 1.18947086336e+11
node_filesystem_free_bytes{device="shm",fstype="tmpfs",mountpoint="/run/containerd/io.containerd.grpc.v1.cri/sandboxes/0208f7a11dc33d5bc8bd289bad919bb17181316989d0b67797b9bc600eca5feb/shm"} 6.7108864e+07
node_filesystem_free_bytes{device="shm",fstype="tmpfs",mountpoint="/run/containerd/io.containerd.grpc.v1.cri/sandboxes/11d4155c4c3ccf57a41200b7ec3de847c49956a051889aed26bcb0efe751d221/shm"} 6.7108864e+07
node_filesystem_free_bytes{device="shm",fstype="tmpfs",mountpoint="/run/containerd/io.containerd.grpc.v1.cri/sandboxes/29e8b6a960d1f80aa5dba931d282e3e896f4689b6d27e0f29296860ac03fa6b4/shm"} 6.7108864e+07
node_filesystem_free_bytes{device="shm",fstype="tmpfs",mountpoint="/run/containerd/io.containerd.grpc.v1.cri/sandboxes/3577c3db4143954a3f4213a5a6dedd3dfb336f135900eecf207414ad4770f1b0/shm"} 6.7108864e+07
node_filesystem_free_bytes{device="shm",fstype="tmpfs",mountpoint="/run/containerd/io.containerd.grpc.v1.cri/sandboxes/576fad5789d19fda4bfcc5999d388e6f99e262000d11112356e37c6a929059ed/shm"} 6.7108864e+07
node_filesystem_free_bytes{device="shm",fstype="tmpfs",mountpoint="/run/containerd/io.containerd.grpc.v1.cri/sandboxes/8524e37b55f671a6cb14491142d00badcfe7dc62a7e73540d107378f68b68667/shm"} 6.7108864e+07
node_filesystem_free_bytes{device="shm",fstype="tmpfs",mountpoint="/run/containerd/io.containerd.grpc.v1.cri/sandboxes/a15cd8217349b0597cc3fb05844d99db669880444ca3957a26e5c57c326550c0/shm"} 6.7108864e+07
node_filesystem_free_bytes{device="shm",fstype="tmpfs",mountpoint="/run/containerd/io.containerd.grpc.v1.cri/sandboxes/d2d3f63c7fd3e21f208a8a2a2d0428cc248f979655bc87ad89e38f6f93e7d1ac/shm"} 6.7108864e+07
node_filesystem_free_bytes{device="shm",fstype="tmpfs",mountpoint="/run/containerd/io.containerd.grpc.v1.cri/sandboxes/e9738e9d4d1902e832e290dfac1f0a6b6a1d87ba172c64818a032f0ae131b124/shm"} 6.7108864e+07
node_filesystem_free_bytes{device="shm",fstype="tmpfs",mountpoint="/run/containerd/io.containerd.grpc.v1.cri/sandboxes/eea73d4ab31da1cdcbbbfe69e4c1e3b2338d7b659fee3d8e05a33b3e6cf4638c/shm"} 6.7108864e+07
node_filesystem_free_bytes{device="tmpfs",fstype="tmpfs",mountpoint="/run"} 8.16193536e+08
node_filesystem_free_bytes{device="tmpfs",fstype="tmpfs",mountpoint="/run/lock"} 5.226496e+06
node_filesystem_free_bytes{device="tmpfs",fstype="tmpfs",mountpoint="/run/user/1000"} 8.19064832e+08
# HELP node_filesystem_readonly Filesystem read-only status.
# TYPE node_filesystem_readonly gauge
node_filesystem_readonly{device="/dev/mmcblk0p1",fstype="vfat",mountpoint="/boot/firmware"} 0
node_filesystem_readonly{device="/dev/mmcblk0p2",fstype="ext4",mountpoint="/"} 0
node_filesystem_readonly{device="shm",fstype="tmpfs",mountpoint="/run/containerd/io.containerd.grpc.v1.cri/sandboxes/0208f7a11dc33d5bc8bd289bad919bb17181316989d0b67797b9bc600eca5feb/shm"} 0
node_filesystem_readonly{device="shm",fstype="tmpfs",mountpoint="/run/containerd/io.containerd.grpc.v1.cri/sandboxes/11d4155c4c3ccf57a41200b7ec3de847c49956a051889aed26bcb0efe751d221/shm"} 0
node_filesystem_readonly{device="shm",fstype="tmpfs",mountpoint="/run/containerd/io.containerd.grpc.v1.cri/sandboxes/29e8b6a960d1f80aa5dba931d282e3e896f4689b6d27e0f29296860ac03fa6b4/shm"} 0
node_filesystem_readonly{device="shm",fstype="tmpfs",mountpoint="/run/containerd/io.containerd.grpc.v1.cri/sandboxes/3577c3db4143954a3f4213a5a6dedd3dfb336f135900eecf207414ad4770f1b0/shm"} 0
node_filesystem_readonly{device="shm",fstype="tmpfs",mountpoint="/run/containerd/io.containerd.grpc.v1.cri/sandboxes/576fad5789d19fda4bfcc5999d388e6f99e262000d11112356e37c6a929059ed/shm"} 0
node_filesystem_readonly{device="shm",fstype="tmpfs",mountpoint="/run/containerd/io.containerd.grpc.v1.cri/sandboxes/8524e37b55f671a6cb14491142d00badcfe7dc62a7e73540d107378f68b68667/shm"} 0
node_filesystem_readonly{device="shm",fstype="tmpfs",mountpoint="/run/containerd/io.containerd.grpc.v1.cri/sandboxes/a15cd8217349b0597cc3fb05844d99db669880444ca3957a26e5c57c326550c0/shm"} 0
node_filesystem_readonly{device="shm",fstype="tmpfs",mountpoint="/run/containerd/io.containerd.grpc.v1.cri/sandboxes/d2d3f63c7fd3e21f208a8a2a2d0428cc248f979655bc87ad89e38f6f93e7d1ac/shm"} 0
node_filesystem_readonly{device="shm",fstype="tmpfs",mountpoint="/run/containerd/io.containerd.grpc.v1.cri/sandboxes/e9738e9d4d1902e832e290dfac1f0a6b6a1d87ba172c64818a032f0ae131b124/shm"} 0
node_filesystem_readonly{device="shm",fstype="tmpfs",mountpoint="/run/containerd/io.containerd.grpc.v1.cri/sandboxes/eea73d4ab31da1cdcbbbfe69e4c1e3b2338d7b659fee3d8e05a33b3e6cf4638c/shm"} 0
node_filesystem_readonly{device="tmpfs",fstype="tmpfs",mountpoint="/run"} 0
node_filesystem_readonly{device="tmpfs",fstype="tmpfs",mountpoint="/run/lock"} 0
node_filesystem_readonly{device="tmpfs",fstype="tmpfs",mountpoint="/run/user/1000"} 0
node_filesystem_readonly{device="tmpfs",fstype="tmpfs",mountpoint="/var/lib/kubelet/pods/0e619376-d2fe-4f79-bc74-64fe5b3c8232/volumes/kubernetes.io~projected/kube-api-access-2f5p9"} 0
node_filesystem_readonly{device="tmpfs",fstype="tmpfs",mountpoint="/var/lib/kubelet/pods/61bde493-1e9f-4d4d-b77f-1df095f775c4/volumes/kubernetes.io~projected/kube-api-access-rdrm2"} 0
node_filesystem_readonly{device="tmpfs",fstype="tmpfs",mountpoint="/var/lib/kubelet/pods/878c2007-167d-4437-b654-43ef9cc0a5f0/volumes/kubernetes.io~projected/kube-api-access-j5fzh"} 0
node_filesystem_readonly{device="tmpfs",fstype="tmpfs",mountpoint="/var/lib/kubelet/pods/9660f563-0f88-41aa-9d38-654911a04158/volumes/kubernetes.io~projected/kube-api-access-n494p"} 0
node_filesystem_readonly{device="tmpfs",fstype="tmpfs",mountpoint="/var/lib/kubelet/pods/c008ef0e-9212-42ce-9a34-6ccaf6b087d1/volumes/kubernetes.io~projected/kube-api-access-9c8sx"} 0
# HELP node_filesystem_size_bytes Filesystem size in bytes.
# TYPE node_filesystem_size_bytes gauge
node_filesystem_size_bytes{device="/dev/mmcblk0p1",fstype="vfat",mountpoint="/boot/firmware"} 5.34765568e+08
node_filesystem_size_bytes{device="/dev/mmcblk0p2",fstype="ext4",mountpoint="/"} 1.25321166848e+11
node_filesystem_size_bytes{device="shm",fstype="tmpfs",mountpoint="/run/containerd/io.containerd.grpc.v1.cri/sandboxes/0208f7a11dc33d5bc8bd289bad919bb17181316989d0b67797b9bc600eca5feb/shm"} 6.7108864e+07
node_filesystem_size_bytes{device="shm",fstype="tmpfs",mountpoint="/run/containerd/io.containerd.grpc.v1.cri/sandboxes/11d4155c4c3ccf57a41200b7ec3de847c49956a051889aed26bcb0efe751d221/shm"} 6.7108864e+07
node_filesystem_size_bytes{device="shm",fstype="tmpfs",mountpoint="/run/containerd/io.containerd.grpc.v1.cri/sandboxes/29e8b6a960d1f80aa5dba931d282e3e896f4689b6d27e0f29296860ac03fa6b4/shm"} 6.7108864e+07
node_filesystem_size_bytes{device="shm",fstype="tmpfs",mountpoint="/run/containerd/io.containerd.grpc.v1.cri/sandboxes/3577c3db4143954a3f4213a5a6dedd3dfb336f135900eecf207414ad4770f1b0/shm"} 6.7108864e+07
node_filesystem_size_bytes{device="shm",fstype="tmpfs",mountpoint="/run/containerd/io.containerd.grpc.v1.cri/sandboxes/576fad5789d19fda4bfcc5999d388e6f99e262000d11112356e37c6a929059ed/shm"} 6.7108864e+07
node_filesystem_size_bytes{device="shm",fstype="tmpfs",mountpoint="/run/containerd/io.containerd.grpc.v1.cri/sandboxes/8524e37b55f671a6cb14491142d00badcfe7dc62a7e73540d107378f68b68667/shm"} 6.7108864e+07
node_filesystem_size_bytes{device="shm",fstype="tmpfs",mountpoint="/run/containerd/io.containerd.grpc.v1.cri/sandboxes/a15cd8217349b0597cc3fb05844d99db669880444ca3957a26e5c57c326550c0/shm"} 6.7108864e+07
node_filesystem_size_bytes{device="shm",fstype="tmpfs",mountpoint="/run/containerd/io.containerd.grpc.v1.cri/sandboxes/d2d3f63c7fd3e21f208a8a2a2d0428cc248f979655bc87ad89e38f6f93e7d1ac/shm"} 6.7108864e+07
node_filesystem_size_bytes{device="shm",fstype="tmpfs",mountpoint="/run/containerd/io.containerd.grpc.v1.cri/sandboxes/e9738e9d4d1902e832e290dfac1f0a6b6a1d87ba172c64818a032f0ae131b124/shm"} 6.7108864e+07
node_filesystem_size_bytes{device="shm",fstype="tmpfs",mountpoint="/run/containerd/io.containerd.grpc.v1.cri/sandboxes/eea73d4ab31da1cdcbbbfe69e4c1e3b2338d7b659fee3d8e05a33b3e6cf4638c/shm"} 6.7108864e+07
node_filesystem_size_bytes{device="tmpfs",fstype="tmpfs",mountpoint="/run"} 8.19068928e+08
node_filesystem_size_bytes{device="tmpfs",fstype="tmpfs",mountpoint="/run/lock"} 5.24288e+06
node_filesystem_size_bytes{device="tmpfs",fstype="tmpfs",mountpoint="/run/user/1000"} 8.19064832e+08
# HELP node_forks_total Total number of forks.
# TYPE node_forks_total counter
node_forks_total 1.9002994e+07
# HELP node_hwmon_chip_names Annotation metric for human-readable chip names
# TYPE node_hwmon_chip_names gauge
node_hwmon_chip_names{chip="platform_gpio_fan_0",chip_name="gpio_fan"} 1
node_hwmon_chip_names{chip="soc:firmware_raspberrypi_hwmon",chip_name="rpi_volt"} 1
node_hwmon_chip_names{chip="thermal_thermal_zone0",chip_name="cpu_thermal"} 1
# HELP node_hwmon_fan_max_rpm Hardware monitor for fan revolutions per minute (max)
# TYPE node_hwmon_fan_max_rpm gauge
node_hwmon_fan_max_rpm{chip="platform_gpio_fan_0",sensor="fan1"} 5000
# HELP node_hwmon_fan_min_rpm Hardware monitor for fan revolutions per minute (min)
# TYPE node_hwmon_fan_min_rpm gauge
node_hwmon_fan_min_rpm{chip="platform_gpio_fan_0",sensor="fan1"} 0
# HELP node_hwmon_fan_rpm Hardware monitor for fan revolutions per minute (input)
# TYPE node_hwmon_fan_rpm gauge
node_hwmon_fan_rpm{chip="platform_gpio_fan_0",sensor="fan1"} 5000
# HELP node_hwmon_fan_target_rpm Hardware monitor for fan revolutions per minute (target)
# TYPE node_hwmon_fan_target_rpm gauge
node_hwmon_fan_target_rpm{chip="platform_gpio_fan_0",sensor="fan1"} 5000
# HELP node_hwmon_in_lcrit_alarm_volts Hardware monitor for voltage (lcrit_alarm)
# TYPE node_hwmon_in_lcrit_alarm_volts gauge
node_hwmon_in_lcrit_alarm_volts{chip="soc:firmware_raspberrypi_hwmon",sensor="in0"} 0
# HELP node_hwmon_pwm Hardware monitor pwm element
# TYPE node_hwmon_pwm gauge
node_hwmon_pwm{chip="platform_gpio_fan_0",sensor="pwm1"} 255
# HELP node_hwmon_pwm_enable Hardware monitor pwm element enable
# TYPE node_hwmon_pwm_enable gauge
node_hwmon_pwm_enable{chip="platform_gpio_fan_0",sensor="pwm1"} 1
# HELP node_hwmon_pwm_mode Hardware monitor pwm element mode
# TYPE node_hwmon_pwm_mode gauge
node_hwmon_pwm_mode{chip="platform_gpio_fan_0",sensor="pwm1"} 0
# HELP node_hwmon_temp_celsius Hardware monitor for temperature (input)
# TYPE node_hwmon_temp_celsius gauge
node_hwmon_temp_celsius{chip="thermal_thermal_zone0",sensor="temp0"} 27.745
node_hwmon_temp_celsius{chip="thermal_thermal_zone0",sensor="temp1"} 27.745
# HELP node_hwmon_temp_crit_celsius Hardware monitor for temperature (crit)
# TYPE node_hwmon_temp_crit_celsius gauge
node_hwmon_temp_crit_celsius{chip="thermal_thermal_zone0",sensor="temp1"} 110
# HELP node_intr_total Total number of interrupts serviced.
# TYPE node_intr_total counter
node_intr_total 1.0312668562e+10
# HELP node_ipvs_connections_total The total number of connections made.
# TYPE node_ipvs_connections_total counter
node_ipvs_connections_total 2907
# HELP node_ipvs_incoming_bytes_total The total amount of incoming data.
# TYPE node_ipvs_incoming_bytes_total counter
node_ipvs_incoming_bytes_total 2.77474522e+08
# HELP node_ipvs_incoming_packets_total The total number of incoming packets.
# TYPE node_ipvs_incoming_packets_total counter
node_ipvs_incoming_packets_total 3.761541e+06
# HELP node_ipvs_outgoing_bytes_total The total amount of outgoing data.
# TYPE node_ipvs_outgoing_bytes_total counter
node_ipvs_outgoing_bytes_total 7.406631703e+09
# HELP node_ipvs_outgoing_packets_total The total number of outgoing packets.
# TYPE node_ipvs_outgoing_packets_total counter
node_ipvs_outgoing_packets_total 4.224817e+06
# HELP node_load1 1m load average.
# TYPE node_load1 gauge
node_load1 0.87
# HELP node_load15 15m load average.
# TYPE node_load15 gauge
node_load15 0.63
# HELP node_load5 5m load average.
# TYPE node_load5 gauge
node_load5 0.58
# HELP node_memory_Active_anon_bytes Memory information field Active_anon_bytes.
# TYPE node_memory_Active_anon_bytes gauge
node_memory_Active_anon_bytes 1.043009536e+09
# HELP node_memory_Active_bytes Memory information field Active_bytes.
# TYPE node_memory_Active_bytes gauge
node_memory_Active_bytes 1.62168832e+09
# HELP node_memory_Active_file_bytes Memory information field Active_file_bytes.
# TYPE node_memory_Active_file_bytes gauge
node_memory_Active_file_bytes 5.78678784e+08
# HELP node_memory_AnonPages_bytes Memory information field AnonPages_bytes.
# TYPE node_memory_AnonPages_bytes gauge
node_memory_AnonPages_bytes 1.043357696e+09
# HELP node_memory_Bounce_bytes Memory information field Bounce_bytes.
# TYPE node_memory_Bounce_bytes gauge
node_memory_Bounce_bytes 0
# HELP node_memory_Buffers_bytes Memory information field Buffers_bytes.
# TYPE node_memory_Buffers_bytes gauge
node_memory_Buffers_bytes 1.36790016e+08
# HELP node_memory_Cached_bytes Memory information field Cached_bytes.
# TYPE node_memory_Cached_bytes gauge
node_memory_Cached_bytes 4.609712128e+09
# HELP node_memory_CmaFree_bytes Memory information field CmaFree_bytes.
# TYPE node_memory_CmaFree_bytes gauge
node_memory_CmaFree_bytes 5.25586432e+08
# HELP node_memory_CmaTotal_bytes Memory information field CmaTotal_bytes.
# TYPE node_memory_CmaTotal_bytes gauge
node_memory_CmaTotal_bytes 5.36870912e+08
# HELP node_memory_CommitLimit_bytes Memory information field CommitLimit_bytes.
# TYPE node_memory_CommitLimit_bytes gauge
node_memory_CommitLimit_bytes 4.095340544e+09
# HELP node_memory_Committed_AS_bytes Memory information field Committed_AS_bytes.
# TYPE node_memory_Committed_AS_bytes gauge
node_memory_Committed_AS_bytes 3.449647104e+09
# HELP node_memory_Dirty_bytes Memory information field Dirty_bytes.
# TYPE node_memory_Dirty_bytes gauge
node_memory_Dirty_bytes 65536
# HELP node_memory_Inactive_anon_bytes Memory information field Inactive_anon_bytes.
# TYPE node_memory_Inactive_anon_bytes gauge
node_memory_Inactive_anon_bytes 3.25632e+06
# HELP node_memory_Inactive_bytes Memory information field Inactive_bytes.
# TYPE node_memory_Inactive_bytes gauge
node_memory_Inactive_bytes 4.168126464e+09
# HELP node_memory_Inactive_file_bytes Memory information field Inactive_file_bytes.
# TYPE node_memory_Inactive_file_bytes gauge
node_memory_Inactive_file_bytes 4.164870144e+09
# HELP node_memory_KReclaimable_bytes Memory information field KReclaimable_bytes.
# TYPE node_memory_KReclaimable_bytes gauge
node_memory_KReclaimable_bytes 4.01215488e+08
# HELP node_memory_KernelStack_bytes Memory information field KernelStack_bytes.
# TYPE node_memory_KernelStack_bytes gauge
node_memory_KernelStack_bytes 8.667136e+06
# HELP node_memory_Mapped_bytes Memory information field Mapped_bytes.
# TYPE node_memory_Mapped_bytes gauge
node_memory_Mapped_bytes 6.4243712e+08
# HELP node_memory_MemAvailable_bytes Memory information field MemAvailable_bytes.
# TYPE node_memory_MemAvailable_bytes gauge
node_memory_MemAvailable_bytes 6.829756416e+09
# HELP node_memory_MemFree_bytes Memory information field MemFree_bytes.
# TYPE node_memory_MemFree_bytes gauge
node_memory_MemFree_bytes 1.837809664e+09
# HELP node_memory_MemTotal_bytes Memory information field MemTotal_bytes.
# TYPE node_memory_MemTotal_bytes gauge
node_memory_MemTotal_bytes 8.190685184e+09
# HELP node_memory_Mlocked_bytes Memory information field Mlocked_bytes.
# TYPE node_memory_Mlocked_bytes gauge
node_memory_Mlocked_bytes 0
# HELP node_memory_NFS_Unstable_bytes Memory information field NFS_Unstable_bytes.
# TYPE node_memory_NFS_Unstable_bytes gauge
node_memory_NFS_Unstable_bytes 0
# HELP node_memory_PageTables_bytes Memory information field PageTables_bytes.
# TYPE node_memory_PageTables_bytes gauge
node_memory_PageTables_bytes 1.128448e+07
# HELP node_memory_Percpu_bytes Memory information field Percpu_bytes.
# TYPE node_memory_Percpu_bytes gauge
node_memory_Percpu_bytes 3.52256e+06
# HELP node_memory_SReclaimable_bytes Memory information field SReclaimable_bytes.
# TYPE node_memory_SReclaimable_bytes gauge
node_memory_SReclaimable_bytes 4.01215488e+08
# HELP node_memory_SUnreclaim_bytes Memory information field SUnreclaim_bytes.
# TYPE node_memory_SUnreclaim_bytes gauge
node_memory_SUnreclaim_bytes 8.0576512e+07
# HELP node_memory_SecPageTables_bytes Memory information field SecPageTables_bytes.
# TYPE node_memory_SecPageTables_bytes gauge
node_memory_SecPageTables_bytes 0
# HELP node_memory_Shmem_bytes Memory information field Shmem_bytes.
# TYPE node_memory_Shmem_bytes gauge
node_memory_Shmem_bytes 2.953216e+06
# HELP node_memory_Slab_bytes Memory information field Slab_bytes.
# TYPE node_memory_Slab_bytes gauge
node_memory_Slab_bytes 4.81792e+08
# HELP node_memory_SwapCached_bytes Memory information field SwapCached_bytes.
# TYPE node_memory_SwapCached_bytes gauge
node_memory_SwapCached_bytes 0
# HELP node_memory_SwapFree_bytes Memory information field SwapFree_bytes.
# TYPE node_memory_SwapFree_bytes gauge
node_memory_SwapFree_bytes 0
# HELP node_memory_SwapTotal_bytes Memory information field SwapTotal_bytes.
# TYPE node_memory_SwapTotal_bytes gauge
node_memory_SwapTotal_bytes 0
# HELP node_memory_Unevictable_bytes Memory information field Unevictable_bytes.
# TYPE node_memory_Unevictable_bytes gauge
node_memory_Unevictable_bytes 0
# HELP node_memory_VmallocChunk_bytes Memory information field VmallocChunk_bytes.
# TYPE node_memory_VmallocChunk_bytes gauge
node_memory_VmallocChunk_bytes 0
# HELP node_memory_VmallocTotal_bytes Memory information field VmallocTotal_bytes.
# TYPE node_memory_VmallocTotal_bytes gauge
node_memory_VmallocTotal_bytes 2.65885319168e+11
# HELP node_memory_VmallocUsed_bytes Memory information field VmallocUsed_bytes.
# TYPE node_memory_VmallocUsed_bytes gauge
node_memory_VmallocUsed_bytes 2.3687168e+07
# HELP node_memory_WritebackTmp_bytes Memory information field WritebackTmp_bytes.
# TYPE node_memory_WritebackTmp_bytes gauge
node_memory_WritebackTmp_bytes 0
# HELP node_memory_Writeback_bytes Memory information field Writeback_bytes.
# TYPE node_memory_Writeback_bytes gauge
node_memory_Writeback_bytes 0
# HELP node_memory_Zswap_bytes Memory information field Zswap_bytes.
# TYPE node_memory_Zswap_bytes gauge
node_memory_Zswap_bytes 0
# HELP node_memory_Zswapped_bytes Memory information field Zswapped_bytes.
# TYPE node_memory_Zswapped_bytes gauge
node_memory_Zswapped_bytes 0
# HELP node_netstat_Icmp6_InErrors Statistic Icmp6InErrors.
# TYPE node_netstat_Icmp6_InErrors untyped
node_netstat_Icmp6_InErrors 0
# HELP node_netstat_Icmp6_InMsgs Statistic Icmp6InMsgs.
# TYPE node_netstat_Icmp6_InMsgs untyped
node_netstat_Icmp6_InMsgs 2
# HELP node_netstat_Icmp6_OutMsgs Statistic Icmp6OutMsgs.
# TYPE node_netstat_Icmp6_OutMsgs untyped
node_netstat_Icmp6_OutMsgs 1601
# HELP node_netstat_Icmp_InErrors Statistic IcmpInErrors.
# TYPE node_netstat_Icmp_InErrors untyped
node_netstat_Icmp_InErrors 1
# HELP node_netstat_Icmp_InMsgs Statistic IcmpInMsgs.
# TYPE node_netstat_Icmp_InMsgs untyped
node_netstat_Icmp_InMsgs 17
# HELP node_netstat_Icmp_OutMsgs Statistic IcmpOutMsgs.
# TYPE node_netstat_Icmp_OutMsgs untyped
node_netstat_Icmp_OutMsgs 14
# HELP node_netstat_Ip6_InOctets Statistic Ip6InOctets.
# TYPE node_netstat_Ip6_InOctets untyped
node_netstat_Ip6_InOctets 3.997070725e+09
# HELP node_netstat_Ip6_OutOctets Statistic Ip6OutOctets.
# TYPE node_netstat_Ip6_OutOctets untyped
node_netstat_Ip6_OutOctets 3.997073515e+09
# HELP node_netstat_IpExt_InOctets Statistic IpExtInOctets.
# TYPE node_netstat_IpExt_InOctets untyped
node_netstat_IpExt_InOctets 1.08144717251e+11
# HELP node_netstat_IpExt_OutOctets Statistic IpExtOutOctets.
# TYPE node_netstat_IpExt_OutOctets untyped
node_netstat_IpExt_OutOctets 1.56294035787e+11
# HELP node_netstat_Ip_Forwarding Statistic IpForwarding.
# TYPE node_netstat_Ip_Forwarding untyped
node_netstat_Ip_Forwarding 1
# HELP node_netstat_TcpExt_ListenDrops Statistic TcpExtListenDrops.
# TYPE node_netstat_TcpExt_ListenDrops untyped
node_netstat_TcpExt_ListenDrops 0
# HELP node_netstat_TcpExt_ListenOverflows Statistic TcpExtListenOverflows.
# TYPE node_netstat_TcpExt_ListenOverflows untyped
node_netstat_TcpExt_ListenOverflows 0
# HELP node_netstat_TcpExt_SyncookiesFailed Statistic TcpExtSyncookiesFailed.
# TYPE node_netstat_TcpExt_SyncookiesFailed untyped
node_netstat_TcpExt_SyncookiesFailed 0
# HELP node_netstat_TcpExt_SyncookiesRecv Statistic TcpExtSyncookiesRecv.
# TYPE node_netstat_TcpExt_SyncookiesRecv untyped
node_netstat_TcpExt_SyncookiesRecv 0
# HELP node_netstat_TcpExt_SyncookiesSent Statistic TcpExtSyncookiesSent.
# TYPE node_netstat_TcpExt_SyncookiesSent untyped
node_netstat_TcpExt_SyncookiesSent 0
# HELP node_netstat_TcpExt_TCPSynRetrans Statistic TcpExtTCPSynRetrans.
# TYPE node_netstat_TcpExt_TCPSynRetrans untyped
node_netstat_TcpExt_TCPSynRetrans 342
# HELP node_netstat_TcpExt_TCPTimeouts Statistic TcpExtTCPTimeouts.
# TYPE node_netstat_TcpExt_TCPTimeouts untyped
node_netstat_TcpExt_TCPTimeouts 513
# HELP node_netstat_Tcp_ActiveOpens Statistic TcpActiveOpens.
# TYPE node_netstat_Tcp_ActiveOpens untyped
node_netstat_Tcp_ActiveOpens 7.121624e+06
# HELP node_netstat_Tcp_CurrEstab Statistic TcpCurrEstab.
# TYPE node_netstat_Tcp_CurrEstab untyped
node_netstat_Tcp_CurrEstab 236
# HELP node_netstat_Tcp_InErrs Statistic TcpInErrs.
# TYPE node_netstat_Tcp_InErrs untyped
node_netstat_Tcp_InErrs 0
# HELP node_netstat_Tcp_InSegs Statistic TcpInSegs.
# TYPE node_netstat_Tcp_InSegs untyped
node_netstat_Tcp_InSegs 5.82648533e+08
# HELP node_netstat_Tcp_OutRsts Statistic TcpOutRsts.
# TYPE node_netstat_Tcp_OutRsts untyped
node_netstat_Tcp_OutRsts 5.798397e+06
# HELP node_netstat_Tcp_OutSegs Statistic TcpOutSegs.
# TYPE node_netstat_Tcp_OutSegs untyped
node_netstat_Tcp_OutSegs 6.13524809e+08
# HELP node_netstat_Tcp_PassiveOpens Statistic TcpPassiveOpens.
# TYPE node_netstat_Tcp_PassiveOpens untyped
node_netstat_Tcp_PassiveOpens 6.751246e+06
# HELP node_netstat_Tcp_RetransSegs Statistic TcpRetransSegs.
# TYPE node_netstat_Tcp_RetransSegs untyped
node_netstat_Tcp_RetransSegs 173853
# HELP node_netstat_Udp6_InDatagrams Statistic Udp6InDatagrams.
# TYPE node_netstat_Udp6_InDatagrams untyped
node_netstat_Udp6_InDatagrams 279
# HELP node_netstat_Udp6_InErrors Statistic Udp6InErrors.
# TYPE node_netstat_Udp6_InErrors untyped
node_netstat_Udp6_InErrors 0
# HELP node_netstat_Udp6_NoPorts Statistic Udp6NoPorts.
# TYPE node_netstat_Udp6_NoPorts untyped
node_netstat_Udp6_NoPorts 0
# HELP node_netstat_Udp6_OutDatagrams Statistic Udp6OutDatagrams.
# TYPE node_netstat_Udp6_OutDatagrams untyped
node_netstat_Udp6_OutDatagrams 236
# HELP node_netstat_Udp6_RcvbufErrors Statistic Udp6RcvbufErrors.
# TYPE node_netstat_Udp6_RcvbufErrors untyped
node_netstat_Udp6_RcvbufErrors 0
# HELP node_netstat_Udp6_SndbufErrors Statistic Udp6SndbufErrors.
# TYPE node_netstat_Udp6_SndbufErrors untyped
node_netstat_Udp6_SndbufErrors 0
# HELP node_netstat_UdpLite6_InErrors Statistic UdpLite6InErrors.
# TYPE node_netstat_UdpLite6_InErrors untyped
node_netstat_UdpLite6_InErrors 0
# HELP node_netstat_UdpLite_InErrors Statistic UdpLiteInErrors.
# TYPE node_netstat_UdpLite_InErrors untyped
node_netstat_UdpLite_InErrors 0
# HELP node_netstat_Udp_InDatagrams Statistic UdpInDatagrams.
# TYPE node_netstat_Udp_InDatagrams untyped
node_netstat_Udp_InDatagrams 6.547468e+06
# HELP node_netstat_Udp_InErrors Statistic UdpInErrors.
# TYPE node_netstat_Udp_InErrors untyped
node_netstat_Udp_InErrors 0
# HELP node_netstat_Udp_NoPorts Statistic UdpNoPorts.
# TYPE node_netstat_Udp_NoPorts untyped
node_netstat_Udp_NoPorts 9
# HELP node_netstat_Udp_OutDatagrams Statistic UdpOutDatagrams.
# TYPE node_netstat_Udp_OutDatagrams untyped
node_netstat_Udp_OutDatagrams 3.213419e+06
# HELP node_netstat_Udp_RcvbufErrors Statistic UdpRcvbufErrors.
# TYPE node_netstat_Udp_RcvbufErrors untyped
node_netstat_Udp_RcvbufErrors 0
# HELP node_netstat_Udp_SndbufErrors Statistic UdpSndbufErrors.
# TYPE node_netstat_Udp_SndbufErrors untyped
node_netstat_Udp_SndbufErrors 0
# HELP node_network_address_assign_type Network device property: address_assign_type
# TYPE node_network_address_assign_type gauge
node_network_address_assign_type{device="cali60e575ce8db"} 3
node_network_address_assign_type{device="cali85a56337055"} 3
node_network_address_assign_type{device="cali8c459f6702e"} 3
node_network_address_assign_type{device="eth0"} 0
node_network_address_assign_type{device="lo"} 0
node_network_address_assign_type{device="tunl0"} 0
node_network_address_assign_type{device="wlan0"} 0
# HELP node_network_carrier Network device property: carrier
# TYPE node_network_carrier gauge
node_network_carrier{device="cali60e575ce8db"} 1
node_network_carrier{device="cali85a56337055"} 1
node_network_carrier{device="cali8c459f6702e"} 1
node_network_carrier{device="eth0"} 1
node_network_carrier{device="lo"} 1
node_network_carrier{device="tunl0"} 1
node_network_carrier{device="wlan0"} 0
# HELP node_network_carrier_changes_total Network device property: carrier_changes_total
# TYPE node_network_carrier_changes_total counter
node_network_carrier_changes_total{device="cali60e575ce8db"} 4
node_network_carrier_changes_total{device="cali85a56337055"} 4
node_network_carrier_changes_total{device="cali8c459f6702e"} 4
node_network_carrier_changes_total{device="eth0"} 1
node_network_carrier_changes_total{device="lo"} 0
node_network_carrier_changes_total{device="tunl0"} 0
node_network_carrier_changes_total{device="wlan0"} 1
# HELP node_network_carrier_down_changes_total Network device property: carrier_down_changes_total
# TYPE node_network_carrier_down_changes_total counter
node_network_carrier_down_changes_total{device="cali60e575ce8db"} 2
node_network_carrier_down_changes_total{device="cali85a56337055"} 2
node_network_carrier_down_changes_total{device="cali8c459f6702e"} 2
node_network_carrier_down_changes_total{device="eth0"} 0
node_network_carrier_down_changes_total{device="lo"} 0
node_network_carrier_down_changes_total{device="tunl0"} 0
node_network_carrier_down_changes_total{device="wlan0"} 1
# HELP node_network_carrier_up_changes_total Network device property: carrier_up_changes_total
# TYPE node_network_carrier_up_changes_total counter
node_network_carrier_up_changes_total{device="cali60e575ce8db"} 2
node_network_carrier_up_changes_total{device="cali85a56337055"} 2
node_network_carrier_up_changes_total{device="cali8c459f6702e"} 2
node_network_carrier_up_changes_total{device="eth0"} 1
node_network_carrier_up_changes_total{device="lo"} 0
node_network_carrier_up_changes_total{device="tunl0"} 0
node_network_carrier_up_changes_total{device="wlan0"} 0
# HELP node_network_device_id Network device property: device_id
# TYPE node_network_device_id gauge
node_network_device_id{device="cali60e575ce8db"} 0
node_network_device_id{device="cali85a56337055"} 0
node_network_device_id{device="cali8c459f6702e"} 0
node_network_device_id{device="eth0"} 0
node_network_device_id{device="lo"} 0
node_network_device_id{device="tunl0"} 0
node_network_device_id{device="wlan0"} 0
# HELP node_network_dormant Network device property: dormant
# TYPE node_network_dormant gauge
node_network_dormant{device="cali60e575ce8db"} 0
node_network_dormant{device="cali85a56337055"} 0
node_network_dormant{device="cali8c459f6702e"} 0
node_network_dormant{device="eth0"} 0
node_network_dormant{device="lo"} 0
node_network_dormant{device="tunl0"} 0
node_network_dormant{device="wlan0"} 0
# HELP node_network_flags Network device property: flags
# TYPE node_network_flags gauge
node_network_flags{device="cali60e575ce8db"} 4099
node_network_flags{device="cali85a56337055"} 4099
node_network_flags{device="cali8c459f6702e"} 4099
node_network_flags{device="eth0"} 4099
node_network_flags{device="lo"} 9
node_network_flags{device="tunl0"} 129
node_network_flags{device="wlan0"} 4099
# HELP node_network_iface_id Network device property: iface_id
# TYPE node_network_iface_id gauge
node_network_iface_id{device="cali60e575ce8db"} 73
node_network_iface_id{device="cali85a56337055"} 74
node_network_iface_id{device="cali8c459f6702e"} 70
node_network_iface_id{device="eth0"} 2
node_network_iface_id{device="lo"} 1
node_network_iface_id{device="tunl0"} 18
node_network_iface_id{device="wlan0"} 3
# HELP node_network_iface_link Network device property: iface_link
# TYPE node_network_iface_link gauge
node_network_iface_link{device="cali60e575ce8db"} 4
node_network_iface_link{device="cali85a56337055"} 4
node_network_iface_link{device="cali8c459f6702e"} 4
node_network_iface_link{device="eth0"} 2
node_network_iface_link{device="lo"} 1
node_network_iface_link{device="tunl0"} 0
node_network_iface_link{device="wlan0"} 3
# HELP node_network_iface_link_mode Network device property: iface_link_mode
# TYPE node_network_iface_link_mode gauge
node_network_iface_link_mode{device="cali60e575ce8db"} 0
node_network_iface_link_mode{device="cali85a56337055"} 0
node_network_iface_link_mode{device="cali8c459f6702e"} 0
node_network_iface_link_mode{device="eth0"} 0
node_network_iface_link_mode{device="lo"} 0
node_network_iface_link_mode{device="tunl0"} 0
node_network_iface_link_mode{device="wlan0"} 1
# HELP node_network_info Non-numeric data from /sys/class/net/<iface>, value is always 1.
# TYPE node_network_info gauge
node_network_info{address="00:00:00:00",adminstate="up",broadcast="00:00:00:00",device="tunl0",duplex="",ifalias="",operstate="unknown"} 1
node_network_info{address="00:00:00:00:00:00",adminstate="up",broadcast="00:00:00:00:00:00",device="lo",duplex="",ifalias="",operstate="unknown"} 1
node_network_info{address="d8:3a:dd:89:c1:0b",adminstate="up",broadcast="ff:ff:ff:ff:ff:ff",device="eth0",duplex="full",ifalias="",operstate="up"} 1
node_network_info{address="d8:3a:dd:89:c1:0c",adminstate="up",broadcast="ff:ff:ff:ff:ff:ff",device="wlan0",duplex="",ifalias="",operstate="down"} 1
node_network_info{address="ee:ee:ee:ee:ee:ee",adminstate="up",broadcast="ff:ff:ff:ff:ff:ff",device="cali60e575ce8db",duplex="full",ifalias="",operstate="up"} 1
node_network_info{address="ee:ee:ee:ee:ee:ee",adminstate="up",broadcast="ff:ff:ff:ff:ff:ff",device="cali85a56337055",duplex="full",ifalias="",operstate="up"} 1
node_network_info{address="ee:ee:ee:ee:ee:ee",adminstate="up",broadcast="ff:ff:ff:ff:ff:ff",device="cali8c459f6702e",duplex="full",ifalias="",operstate="up"} 1
# HELP node_network_mtu_bytes Network device property: mtu_bytes
# TYPE node_network_mtu_bytes gauge
node_network_mtu_bytes{device="cali60e575ce8db"} 1480
node_network_mtu_bytes{device="cali85a56337055"} 1480
node_network_mtu_bytes{device="cali8c459f6702e"} 1480
node_network_mtu_bytes{device="eth0"} 1500
node_network_mtu_bytes{device="lo"} 65536
node_network_mtu_bytes{device="tunl0"} 1480
node_network_mtu_bytes{device="wlan0"} 1500
# HELP node_network_name_assign_type Network device property: name_assign_type
# TYPE node_network_name_assign_type gauge
node_network_name_assign_type{device="cali60e575ce8db"} 3
node_network_name_assign_type{device="cali85a56337055"} 3
node_network_name_assign_type{device="cali8c459f6702e"} 3
node_network_name_assign_type{device="eth0"} 1
node_network_name_assign_type{device="lo"} 2
# HELP node_network_net_dev_group Network device property: net_dev_group
# TYPE node_network_net_dev_group gauge
node_network_net_dev_group{device="cali60e575ce8db"} 0
node_network_net_dev_group{device="cali85a56337055"} 0
node_network_net_dev_group{device="cali8c459f6702e"} 0
node_network_net_dev_group{device="eth0"} 0
node_network_net_dev_group{device="lo"} 0
node_network_net_dev_group{device="tunl0"} 0
node_network_net_dev_group{device="wlan0"} 0
# HELP node_network_protocol_type Network device property: protocol_type
# TYPE node_network_protocol_type gauge
node_network_protocol_type{device="cali60e575ce8db"} 1
node_network_protocol_type{device="cali85a56337055"} 1
node_network_protocol_type{device="cali8c459f6702e"} 1
node_network_protocol_type{device="eth0"} 1
node_network_protocol_type{device="lo"} 772
node_network_protocol_type{device="tunl0"} 768
node_network_protocol_type{device="wlan0"} 1
# HELP node_network_receive_bytes_total Network device statistic receive_bytes.
# TYPE node_network_receive_bytes_total counter
node_network_receive_bytes_total{device="cali60e575ce8db"} 6.800154e+07
node_network_receive_bytes_total{device="cali85a56337055"} 6.6751833e+07
node_network_receive_bytes_total{device="cali8c459f6702e"} 5.9727975e+07
node_network_receive_bytes_total{device="eth0"} 5.6372248596e+10
node_network_receive_bytes_total{device="lo"} 6.0342387372e+10
node_network_receive_bytes_total{device="tunl0"} 3.599596e+06
node_network_receive_bytes_total{device="wlan0"} 0
# HELP node_network_receive_compressed_total Network device statistic receive_compressed.
# TYPE node_network_receive_compressed_total counter
node_network_receive_compressed_total{device="cali60e575ce8db"} 0
node_network_receive_compressed_total{device="cali85a56337055"} 0
node_network_receive_compressed_total{device="cali8c459f6702e"} 0
node_network_receive_compressed_total{device="eth0"} 0
node_network_receive_compressed_total{device="lo"} 0
node_network_receive_compressed_total{device="tunl0"} 0
node_network_receive_compressed_total{device="wlan0"} 0
# HELP node_network_receive_drop_total Network device statistic receive_drop.
# TYPE node_network_receive_drop_total counter
node_network_receive_drop_total{device="cali60e575ce8db"} 1
node_network_receive_drop_total{device="cali85a56337055"} 1
node_network_receive_drop_total{device="cali8c459f6702e"} 1
node_network_receive_drop_total{device="eth0"} 0
node_network_receive_drop_total{device="lo"} 0
node_network_receive_drop_total{device="tunl0"} 0
node_network_receive_drop_total{device="wlan0"} 0
# HELP node_network_receive_errs_total Network device statistic receive_errs.
# TYPE node_network_receive_errs_total counter
node_network_receive_errs_total{device="cali60e575ce8db"} 0
node_network_receive_errs_total{device="cali85a56337055"} 0
node_network_receive_errs_total{device="cali8c459f6702e"} 0
node_network_receive_errs_total{device="eth0"} 0
node_network_receive_errs_total{device="lo"} 0
node_network_receive_errs_total{device="tunl0"} 0
node_network_receive_errs_total{device="wlan0"} 0
# HELP node_network_receive_fifo_total Network device statistic receive_fifo.
# TYPE node_network_receive_fifo_total counter
node_network_receive_fifo_total{device="cali60e575ce8db"} 0
node_network_receive_fifo_total{device="cali85a56337055"} 0
node_network_receive_fifo_total{device="cali8c459f6702e"} 0
node_network_receive_fifo_total{device="eth0"} 0
node_network_receive_fifo_total{device="lo"} 0
node_network_receive_fifo_total{device="tunl0"} 0
node_network_receive_fifo_total{device="wlan0"} 0
# HELP node_network_receive_frame_total Network device statistic receive_frame.
# TYPE node_network_receive_frame_total counter
node_network_receive_frame_total{device="cali60e575ce8db"} 0
node_network_receive_frame_total{device="cali85a56337055"} 0
node_network_receive_frame_total{device="cali8c459f6702e"} 0
node_network_receive_frame_total{device="eth0"} 0
node_network_receive_frame_total{device="lo"} 0
node_network_receive_frame_total{device="tunl0"} 0
node_network_receive_frame_total{device="wlan0"} 0
# HELP node_network_receive_multicast_total Network device statistic receive_multicast.
# TYPE node_network_receive_multicast_total counter
node_network_receive_multicast_total{device="cali60e575ce8db"} 0
node_network_receive_multicast_total{device="cali85a56337055"} 0
node_network_receive_multicast_total{device="cali8c459f6702e"} 0
node_network_receive_multicast_total{device="eth0"} 3.336362e+06
node_network_receive_multicast_total{device="lo"} 0
node_network_receive_multicast_total{device="tunl0"} 0
node_network_receive_multicast_total{device="wlan0"} 0
# HELP node_network_receive_nohandler_total Network device statistic receive_nohandler.
# TYPE node_network_receive_nohandler_total counter
node_network_receive_nohandler_total{device="cali60e575ce8db"} 0
node_network_receive_nohandler_total{device="cali85a56337055"} 0
node_network_receive_nohandler_total{device="cali8c459f6702e"} 0
node_network_receive_nohandler_total{device="eth0"} 0
node_network_receive_nohandler_total{device="lo"} 0
node_network_receive_nohandler_total{device="tunl0"} 0
node_network_receive_nohandler_total{device="wlan0"} 0
# HELP node_network_receive_packets_total Network device statistic receive_packets.
# TYPE node_network_receive_packets_total counter
node_network_receive_packets_total{device="cali60e575ce8db"} 800641
node_network_receive_packets_total{device="cali85a56337055"} 781891
node_network_receive_packets_total{device="cali8c459f6702e"} 680023
node_network_receive_packets_total{device="eth0"} 3.3310639e+08
node_network_receive_packets_total{device="lo"} 2.57029971e+08
node_network_receive_packets_total{device="tunl0"} 39699
node_network_receive_packets_total{device="wlan0"} 0
# HELP node_network_speed_bytes Network device property: speed_bytes
# TYPE node_network_speed_bytes gauge
node_network_speed_bytes{device="cali60e575ce8db"} 1.25e+09
node_network_speed_bytes{device="cali85a56337055"} 1.25e+09
node_network_speed_bytes{device="cali8c459f6702e"} 1.25e+09
node_network_speed_bytes{device="eth0"} 1.25e+08
# HELP node_network_transmit_bytes_total Network device statistic transmit_bytes.
# TYPE node_network_transmit_bytes_total counter
node_network_transmit_bytes_total{device="cali60e575ce8db"} 5.2804647e+07
node_network_transmit_bytes_total{device="cali85a56337055"} 5.4239763e+07
node_network_transmit_bytes_total{device="cali8c459f6702e"} 1.115901473e+09
node_network_transmit_bytes_total{device="eth0"} 1.02987658518e+11
node_network_transmit_bytes_total{device="lo"} 6.0342387372e+10
node_network_transmit_bytes_total{device="tunl0"} 8.407628e+06
node_network_transmit_bytes_total{device="wlan0"} 0
# HELP node_network_transmit_carrier_total Network device statistic transmit_carrier.
# TYPE node_network_transmit_carrier_total counter
node_network_transmit_carrier_total{device="cali60e575ce8db"} 0
node_network_transmit_carrier_total{device="cali85a56337055"} 0
node_network_transmit_carrier_total{device="cali8c459f6702e"} 0
node_network_transmit_carrier_total{device="eth0"} 0
node_network_transmit_carrier_total{device="lo"} 0
node_network_transmit_carrier_total{device="tunl0"} 0
node_network_transmit_carrier_total{device="wlan0"} 0
# HELP node_network_transmit_colls_total Network device statistic transmit_colls.
# TYPE node_network_transmit_colls_total counter
node_network_transmit_colls_total{device="cali60e575ce8db"} 0
node_network_transmit_colls_total{device="cali85a56337055"} 0
node_network_transmit_colls_total{device="cali8c459f6702e"} 0
node_network_transmit_colls_total{device="eth0"} 0
node_network_transmit_colls_total{device="lo"} 0
node_network_transmit_colls_total{device="tunl0"} 0
node_network_transmit_colls_total{device="wlan0"} 0
# HELP node_network_transmit_compressed_total Network device statistic transmit_compressed.
# TYPE node_network_transmit_compressed_total counter
node_network_transmit_compressed_total{device="cali60e575ce8db"} 0
node_network_transmit_compressed_total{device="cali85a56337055"} 0
node_network_transmit_compressed_total{device="cali8c459f6702e"} 0
node_network_transmit_compressed_total{device="eth0"} 0
node_network_transmit_compressed_total{device="lo"} 0
node_network_transmit_compressed_total{device="tunl0"} 0
node_network_transmit_compressed_total{device="wlan0"} 0
# HELP node_network_transmit_drop_total Network device statistic transmit_drop.
# TYPE node_network_transmit_drop_total counter
node_network_transmit_drop_total{device="cali60e575ce8db"} 0
node_network_transmit_drop_total{device="cali85a56337055"} 0
node_network_transmit_drop_total{device="cali8c459f6702e"} 0
node_network_transmit_drop_total{device="eth0"} 0
node_network_transmit_drop_total{device="lo"} 0
node_network_transmit_drop_total{device="tunl0"} 0
node_network_transmit_drop_total{device="wlan0"} 0
# HELP node_network_transmit_errs_total Network device statistic transmit_errs.
# TYPE node_network_transmit_errs_total counter
node_network_transmit_errs_total{device="cali60e575ce8db"} 0
node_network_transmit_errs_total{device="cali85a56337055"} 0
node_network_transmit_errs_total{device="cali8c459f6702e"} 0
node_network_transmit_errs_total{device="eth0"} 0
node_network_transmit_errs_total{device="lo"} 0
node_network_transmit_errs_total{device="tunl0"} 0
node_network_transmit_errs_total{device="wlan0"} 0
# HELP node_network_transmit_fifo_total Network device statistic transmit_fifo.
# TYPE node_network_transmit_fifo_total counter
node_network_transmit_fifo_total{device="cali60e575ce8db"} 0
node_network_transmit_fifo_total{device="cali85a56337055"} 0
node_network_transmit_fifo_total{device="cali8c459f6702e"} 0
node_network_transmit_fifo_total{device="eth0"} 0
node_network_transmit_fifo_total{device="lo"} 0
node_network_transmit_fifo_total{device="tunl0"} 0
node_network_transmit_fifo_total{device="wlan0"} 0
# HELP node_network_transmit_packets_total Network device statistic transmit_packets.
# TYPE node_network_transmit_packets_total counter
node_network_transmit_packets_total{device="cali60e575ce8db"} 560412
node_network_transmit_packets_total{device="cali85a56337055"} 582260
node_network_transmit_packets_total{device="cali8c459f6702e"} 733054
node_network_transmit_packets_total{device="eth0"} 3.54151866e+08
node_network_transmit_packets_total{device="lo"} 2.57029971e+08
node_network_transmit_packets_total{device="tunl0"} 39617
node_network_transmit_packets_total{device="wlan0"} 0
# HELP node_network_transmit_queue_length Network device property: transmit_queue_length
# TYPE node_network_transmit_queue_length gauge
node_network_transmit_queue_length{device="cali60e575ce8db"} 0
node_network_transmit_queue_length{device="cali85a56337055"} 0
node_network_transmit_queue_length{device="cali8c459f6702e"} 0
node_network_transmit_queue_length{device="eth0"} 1000
node_network_transmit_queue_length{device="lo"} 1000
node_network_transmit_queue_length{device="tunl0"} 1000
node_network_transmit_queue_length{device="wlan0"} 1000
# HELP node_network_up Value is 1 if operstate is 'up', 0 otherwise.
# TYPE node_network_up gauge
node_network_up{device="cali60e575ce8db"} 1
node_network_up{device="cali85a56337055"} 1
node_network_up{device="cali8c459f6702e"} 1
node_network_up{device="eth0"} 1
node_network_up{device="lo"} 0
node_network_up{device="tunl0"} 0
node_network_up{device="wlan0"} 0
# HELP node_nf_conntrack_entries Number of currently allocated flow entries for connection tracking.
# TYPE node_nf_conntrack_entries gauge
node_nf_conntrack_entries 474
# HELP node_nf_conntrack_entries_limit Maximum size of connection tracking table.
# TYPE node_nf_conntrack_entries_limit gauge
node_nf_conntrack_entries_limit 131072
# HELP node_nfs_connections_total Total number of NFSd TCP connections.
# TYPE node_nfs_connections_total counter
node_nfs_connections_total 0
# HELP node_nfs_packets_total Total NFSd network packets (sent+received) by protocol type.
# TYPE node_nfs_packets_total counter
node_nfs_packets_total{protocol="tcp"} 0
node_nfs_packets_total{protocol="udp"} 0
# HELP node_nfs_requests_total Number of NFS procedures invoked.
# TYPE node_nfs_requests_total counter
node_nfs_requests_total{method="Access",proto="3"} 0
node_nfs_requests_total{method="Access",proto="4"} 0
node_nfs_requests_total{method="Allocate",proto="4"} 0
node_nfs_requests_total{method="BindConnToSession",proto="4"} 0
node_nfs_requests_total{method="Clone",proto="4"} 0
node_nfs_requests_total{method="Close",proto="4"} 0
node_nfs_requests_total{method="Commit",proto="3"} 0
node_nfs_requests_total{method="Commit",proto="4"} 0
node_nfs_requests_total{method="Create",proto="2"} 0
node_nfs_requests_total{method="Create",proto="3"} 0
node_nfs_requests_total{method="Create",proto="4"} 0
node_nfs_requests_total{method="CreateSession",proto="4"} 0
node_nfs_requests_total{method="DeAllocate",proto="4"} 0
node_nfs_requests_total{method="DelegReturn",proto="4"} 0
node_nfs_requests_total{method="DestroyClientID",proto="4"} 0
node_nfs_requests_total{method="DestroySession",proto="4"} 0
node_nfs_requests_total{method="ExchangeID",proto="4"} 0
node_nfs_requests_total{method="FreeStateID",proto="4"} 0
node_nfs_requests_total{method="FsInfo",proto="3"} 0
node_nfs_requests_total{method="FsInfo",proto="4"} 0
node_nfs_requests_total{method="FsLocations",proto="4"} 0
node_nfs_requests_total{method="FsStat",proto="2"} 0
node_nfs_requests_total{method="FsStat",proto="3"} 0
node_nfs_requests_total{method="FsidPresent",proto="4"} 0
node_nfs_requests_total{method="GetACL",proto="4"} 0
node_nfs_requests_total{method="GetAttr",proto="2"} 0
node_nfs_requests_total{method="GetAttr",proto="3"} 0
node_nfs_requests_total{method="GetDeviceInfo",proto="4"} 0
node_nfs_requests_total{method="GetDeviceList",proto="4"} 0
node_nfs_requests_total{method="GetLeaseTime",proto="4"} 0
node_nfs_requests_total{method="Getattr",proto="4"} 0
node_nfs_requests_total{method="LayoutCommit",proto="4"} 0
node_nfs_requests_total{method="LayoutGet",proto="4"} 0
node_nfs_requests_total{method="LayoutReturn",proto="4"} 0
node_nfs_requests_total{method="LayoutStats",proto="4"} 0
node_nfs_requests_total{method="Link",proto="2"} 0
node_nfs_requests_total{method="Link",proto="3"} 0
node_nfs_requests_total{method="Link",proto="4"} 0
node_nfs_requests_total{method="Lock",proto="4"} 0
node_nfs_requests_total{method="Lockt",proto="4"} 0
node_nfs_requests_total{method="Locku",proto="4"} 0
node_nfs_requests_total{method="Lookup",proto="2"} 0
node_nfs_requests_total{method="Lookup",proto="3"} 0
node_nfs_requests_total{method="Lookup",proto="4"} 0
node_nfs_requests_total{method="LookupRoot",proto="4"} 0
node_nfs_requests_total{method="MkDir",proto="2"} 0
node_nfs_requests_total{method="MkDir",proto="3"} 0
node_nfs_requests_total{method="MkNod",proto="3"} 0
node_nfs_requests_total{method="Null",proto="2"} 0
node_nfs_requests_total{method="Null",proto="3"} 0
node_nfs_requests_total{method="Null",proto="4"} 0
node_nfs_requests_total{method="Open",proto="4"} 0
node_nfs_requests_total{method="OpenConfirm",proto="4"} 0
node_nfs_requests_total{method="OpenDowngrade",proto="4"} 0
node_nfs_requests_total{method="OpenNoattr",proto="4"} 0
node_nfs_requests_total{method="PathConf",proto="3"} 0
node_nfs_requests_total{method="Pathconf",proto="4"} 0
node_nfs_requests_total{method="Read",proto="2"} 0
node_nfs_requests_total{method="Read",proto="3"} 0
node_nfs_requests_total{method="Read",proto="4"} 0
node_nfs_requests_total{method="ReadDir",proto="2"} 0
node_nfs_requests_total{method="ReadDir",proto="3"} 0
node_nfs_requests_total{method="ReadDir",proto="4"} 0
node_nfs_requests_total{method="ReadDirPlus",proto="3"} 0
node_nfs_requests_total{method="ReadLink",proto="2"} 0
node_nfs_requests_total{method="ReadLink",proto="3"} 0
node_nfs_requests_total{method="ReadLink",proto="4"} 0
node_nfs_requests_total{method="ReclaimComplete",proto="4"} 0
node_nfs_requests_total{method="ReleaseLockowner",proto="4"} 0
node_nfs_requests_total{method="Remove",proto="2"} 0
node_nfs_requests_total{method="Remove",proto="3"} 0
node_nfs_requests_total{method="Remove",proto="4"} 0
node_nfs_requests_total{method="Rename",proto="2"} 0
node_nfs_requests_total{method="Rename",proto="3"} 0
node_nfs_requests_total{method="Rename",proto="4"} 0
node_nfs_requests_total{method="Renew",proto="4"} 0
node_nfs_requests_total{method="RmDir",proto="2"} 0
node_nfs_requests_total{method="RmDir",proto="3"} 0
node_nfs_requests_total{method="Root",proto="2"} 0
node_nfs_requests_total{method="Secinfo",proto="4"} 0
node_nfs_requests_total{method="SecinfoNoName",proto="4"} 0
node_nfs_requests_total{method="Seek",proto="4"} 0
node_nfs_requests_total{method="Sequence",proto="4"} 0
node_nfs_requests_total{method="ServerCaps",proto="4"} 0
node_nfs_requests_total{method="SetACL",proto="4"} 0
node_nfs_requests_total{method="SetAttr",proto="2"} 0
node_nfs_requests_total{method="SetAttr",proto="3"} 0
node_nfs_requests_total{method="SetClientID",proto="4"} 0
node_nfs_requests_total{method="SetClientIDConfirm",proto="4"} 0
node_nfs_requests_total{method="Setattr",proto="4"} 0
node_nfs_requests_total{method="StatFs",proto="4"} 0
node_nfs_requests_total{method="SymLink",proto="2"} 0
node_nfs_requests_total{method="SymLink",proto="3"} 0
node_nfs_requests_total{method="Symlink",proto="4"} 0
node_nfs_requests_total{method="TestStateID",proto="4"} 0
node_nfs_requests_total{method="WrCache",proto="2"} 0
node_nfs_requests_total{method="Write",proto="2"} 0
node_nfs_requests_total{method="Write",proto="3"} 0
node_nfs_requests_total{method="Write",proto="4"} 0
# HELP node_nfs_rpc_authentication_refreshes_total Number of RPC authentication refreshes performed.
# TYPE node_nfs_rpc_authentication_refreshes_total counter
node_nfs_rpc_authentication_refreshes_total 0
# HELP node_nfs_rpc_retransmissions_total Number of RPC transmissions performed.
# TYPE node_nfs_rpc_retransmissions_total counter
node_nfs_rpc_retransmissions_total 0
# HELP node_nfs_rpcs_total Total number of RPCs performed.
# TYPE node_nfs_rpcs_total counter
node_nfs_rpcs_total 0
# HELP node_os_info A metric with a constant '1' value labeled by build_id, id, id_like, image_id, image_version, name, pretty_name, variant, variant_id, version, version_codename, version_id.
# TYPE node_os_info gauge
node_os_info{build_id="",id="debian",id_like="",image_id="",image_version="",name="Debian GNU/Linux",pretty_name="Debian GNU/Linux 12 (bookworm)",variant="",variant_id="",version="12 (bookworm)",version_codename="bookworm",version_id="12"} 1
# HELP node_os_version Metric containing the major.minor part of the OS version.
# TYPE node_os_version gauge
node_os_version{id="debian",id_like="",name="Debian GNU/Linux"} 12
# HELP node_procs_blocked Number of processes blocked waiting for I/O to complete.
# TYPE node_procs_blocked gauge
node_procs_blocked 0
# HELP node_procs_running Number of processes in runnable state.
# TYPE node_procs_running gauge
node_procs_running 2
# HELP node_schedstat_running_seconds_total Number of seconds CPU spent running a process.
# TYPE node_schedstat_running_seconds_total counter
node_schedstat_running_seconds_total{cpu="0"} 193905.40964483
node_schedstat_running_seconds_total{cpu="1"} 201807.778053838
node_schedstat_running_seconds_total{cpu="2"} 202480.951626566
node_schedstat_running_seconds_total{cpu="3"} 199368.582085578
# HELP node_schedstat_timeslices_total Number of timeslices executed by CPU.
# TYPE node_schedstat_timeslices_total counter
node_schedstat_timeslices_total{cpu="0"} 2.671310666e+09
node_schedstat_timeslices_total{cpu="1"} 2.839935261e+09
node_schedstat_timeslices_total{cpu="2"} 2.840250945e+09
node_schedstat_timeslices_total{cpu="3"} 2.791566809e+09
# HELP node_schedstat_waiting_seconds_total Number of seconds spent by processing waiting for this CPU.
# TYPE node_schedstat_waiting_seconds_total counter
node_schedstat_waiting_seconds_total{cpu="0"} 146993.907550125
node_schedstat_waiting_seconds_total{cpu="1"} 148954.872956911
node_schedstat_waiting_seconds_total{cpu="2"} 149496.824640957
node_schedstat_waiting_seconds_total{cpu="3"} 148325.351612478
# HELP node_scrape_collector_duration_seconds node_exporter: Duration of a collector scrape.
# TYPE node_scrape_collector_duration_seconds gauge
node_scrape_collector_duration_seconds{collector="arp"} 0.000472051
node_scrape_collector_duration_seconds{collector="bcache"} 9.7776e-05
node_scrape_collector_duration_seconds{collector="bonding"} 0.00025022
node_scrape_collector_duration_seconds{collector="btrfs"} 0.018567631
node_scrape_collector_duration_seconds{collector="conntrack"} 0.014180114
node_scrape_collector_duration_seconds{collector="cpu"} 0.004748662
node_scrape_collector_duration_seconds{collector="cpufreq"} 0.049445245
node_scrape_collector_duration_seconds{collector="diskstats"} 0.001468727
node_scrape_collector_duration_seconds{collector="dmi"} 1.093e-06
node_scrape_collector_duration_seconds{collector="edac"} 7.6574e-05
node_scrape_collector_duration_seconds{collector="entropy"} 0.000781326
node_scrape_collector_duration_seconds{collector="fibrechannel"} 3.0574e-05
node_scrape_collector_duration_seconds{collector="filefd"} 0.000214998
node_scrape_collector_duration_seconds{collector="filesystem"} 0.041031802
node_scrape_collector_duration_seconds{collector="hwmon"} 0.007842633
node_scrape_collector_duration_seconds{collector="infiniband"} 4.1777e-05
node_scrape_collector_duration_seconds{collector="ipvs"} 0.000964547
node_scrape_collector_duration_seconds{collector="loadavg"} 0.000368979
node_scrape_collector_duration_seconds{collector="mdadm"} 7.6555e-05
node_scrape_collector_duration_seconds{collector="meminfo"} 0.001052527
node_scrape_collector_duration_seconds{collector="netclass"} 0.036469213
node_scrape_collector_duration_seconds{collector="netdev"} 0.002758901
node_scrape_collector_duration_seconds{collector="netstat"} 0.002033075
node_scrape_collector_duration_seconds{collector="nfs"} 0.000542699
node_scrape_collector_duration_seconds{collector="nfsd"} 0.000331331
node_scrape_collector_duration_seconds{collector="nvme"} 0.000140017
node_scrape_collector_duration_seconds{collector="os"} 0.000326923
node_scrape_collector_duration_seconds{collector="powersupplyclass"} 0.000183962
node_scrape_collector_duration_seconds{collector="pressure"} 6.4647e-05
node_scrape_collector_duration_seconds{collector="rapl"} 0.000149461
node_scrape_collector_duration_seconds{collector="schedstat"} 0.000511218
node_scrape_collector_duration_seconds{collector="selinux"} 0.000327182
node_scrape_collector_duration_seconds{collector="sockstat"} 0.001023898
node_scrape_collector_duration_seconds{collector="softnet"} 0.000578402
node_scrape_collector_duration_seconds{collector="stat"} 0.013851062
node_scrape_collector_duration_seconds{collector="tapestats"} 0.000176499
node_scrape_collector_duration_seconds{collector="textfile"} 5.7296e-05
node_scrape_collector_duration_seconds{collector="thermal_zone"} 0.017899137
node_scrape_collector_duration_seconds{collector="time"} 0.000422885
node_scrape_collector_duration_seconds{collector="timex"} 0.000182517
node_scrape_collector_duration_seconds{collector="udp_queues"} 0.001325488
node_scrape_collector_duration_seconds{collector="uname"} 7.0184e-05
node_scrape_collector_duration_seconds{collector="vmstat"} 0.000352664
node_scrape_collector_duration_seconds{collector="xfs"} 4.2481e-05
node_scrape_collector_duration_seconds{collector="zfs"} 0.00011237
# HELP node_scrape_collector_success node_exporter: Whether a collector succeeded.
# TYPE node_scrape_collector_success gauge
node_scrape_collector_success{collector="arp"} 0
node_scrape_collector_success{collector="bcache"} 1
node_scrape_collector_success{collector="bonding"} 0
node_scrape_collector_success{collector="btrfs"} 1
node_scrape_collector_success{collector="conntrack"} 0
node_scrape_collector_success{collector="cpu"} 1
node_scrape_collector_success{collector="cpufreq"} 1
node_scrape_collector_success{collector="diskstats"} 1
node_scrape_collector_success{collector="dmi"} 0
node_scrape_collector_success{collector="edac"} 1
node_scrape_collector_success{collector="entropy"} 1
node_scrape_collector_success{collector="fibrechannel"} 0
node_scrape_collector_success{collector="filefd"} 1
node_scrape_collector_success{collector="filesystem"} 1
node_scrape_collector_success{collector="hwmon"} 1
node_scrape_collector_success{collector="infiniband"} 0
node_scrape_collector_success{collector="ipvs"} 1
node_scrape_collector_success{collector="loadavg"} 1
node_scrape_collector_success{collector="mdadm"} 0
node_scrape_collector_success{collector="meminfo"} 1
node_scrape_collector_success{collector="netclass"} 1
node_scrape_collector_success{collector="netdev"} 1
node_scrape_collector_success{collector="netstat"} 1
node_scrape_collector_success{collector="nfs"} 1
node_scrape_collector_success{collector="nfsd"} 0
node_scrape_collector_success{collector="nvme"} 1
node_scrape_collector_success{collector="os"} 1
node_scrape_collector_success{collector="powersupplyclass"} 1
node_scrape_collector_success{collector="pressure"} 0
node_scrape_collector_success{collector="rapl"} 0
node_scrape_collector_success{collector="schedstat"} 1
node_scrape_collector_success{collector="selinux"} 1
node_scrape_collector_success{collector="sockstat"} 1
node_scrape_collector_success{collector="softnet"} 1
node_scrape_collector_success{collector="stat"} 1
node_scrape_collector_success{collector="tapestats"} 0
node_scrape_collector_success{collector="textfile"} 1
node_scrape_collector_success{collector="thermal_zone"} 1
node_scrape_collector_success{collector="time"} 1
node_scrape_collector_success{collector="timex"} 1
node_scrape_collector_success{collector="udp_queues"} 1
node_scrape_collector_success{collector="uname"} 1
node_scrape_collector_success{collector="vmstat"} 1
node_scrape_collector_success{collector="xfs"} 1
node_scrape_collector_success{collector="zfs"} 0
# HELP node_selinux_enabled SELinux is enabled, 1 is true, 0 is false
# TYPE node_selinux_enabled gauge
node_selinux_enabled 0
# HELP node_sockstat_FRAG6_inuse Number of FRAG6 sockets in state inuse.
# TYPE node_sockstat_FRAG6_inuse gauge
node_sockstat_FRAG6_inuse 0
# HELP node_sockstat_FRAG6_memory Number of FRAG6 sockets in state memory.
# TYPE node_sockstat_FRAG6_memory gauge
node_sockstat_FRAG6_memory 0
# HELP node_sockstat_FRAG_inuse Number of FRAG sockets in state inuse.
# TYPE node_sockstat_FRAG_inuse gauge
node_sockstat_FRAG_inuse 0
# HELP node_sockstat_FRAG_memory Number of FRAG sockets in state memory.
# TYPE node_sockstat_FRAG_memory gauge
node_sockstat_FRAG_memory 0
# HELP node_sockstat_RAW6_inuse Number of RAW6 sockets in state inuse.
# TYPE node_sockstat_RAW6_inuse gauge
node_sockstat_RAW6_inuse 1
# HELP node_sockstat_RAW_inuse Number of RAW sockets in state inuse.
# TYPE node_sockstat_RAW_inuse gauge
node_sockstat_RAW_inuse 0
# HELP node_sockstat_TCP6_inuse Number of TCP6 sockets in state inuse.
# TYPE node_sockstat_TCP6_inuse gauge
node_sockstat_TCP6_inuse 44
# HELP node_sockstat_TCP_alloc Number of TCP sockets in state alloc.
# TYPE node_sockstat_TCP_alloc gauge
node_sockstat_TCP_alloc 272
# HELP node_sockstat_TCP_inuse Number of TCP sockets in state inuse.
# TYPE node_sockstat_TCP_inuse gauge
node_sockstat_TCP_inuse 211
# HELP node_sockstat_TCP_mem Number of TCP sockets in state mem.
# TYPE node_sockstat_TCP_mem gauge
node_sockstat_TCP_mem 665
# HELP node_sockstat_TCP_mem_bytes Number of TCP sockets in state mem_bytes.
# TYPE node_sockstat_TCP_mem_bytes gauge
node_sockstat_TCP_mem_bytes 2.72384e+06
# HELP node_sockstat_TCP_orphan Number of TCP sockets in state orphan.
# TYPE node_sockstat_TCP_orphan gauge
node_sockstat_TCP_orphan 0
# HELP node_sockstat_TCP_tw Number of TCP sockets in state tw.
# TYPE node_sockstat_TCP_tw gauge
node_sockstat_TCP_tw 55
# HELP node_sockstat_UDP6_inuse Number of UDP6 sockets in state inuse.
# TYPE node_sockstat_UDP6_inuse gauge
node_sockstat_UDP6_inuse 2
# HELP node_sockstat_UDPLITE6_inuse Number of UDPLITE6 sockets in state inuse.
# TYPE node_sockstat_UDPLITE6_inuse gauge
node_sockstat_UDPLITE6_inuse 0
# HELP node_sockstat_UDPLITE_inuse Number of UDPLITE sockets in state inuse.
# TYPE node_sockstat_UDPLITE_inuse gauge
node_sockstat_UDPLITE_inuse 0
# HELP node_sockstat_UDP_inuse Number of UDP sockets in state inuse.
# TYPE node_sockstat_UDP_inuse gauge
node_sockstat_UDP_inuse 3
# HELP node_sockstat_UDP_mem Number of UDP sockets in state mem.
# TYPE node_sockstat_UDP_mem gauge
node_sockstat_UDP_mem 249
# HELP node_sockstat_UDP_mem_bytes Number of UDP sockets in state mem_bytes.
# TYPE node_sockstat_UDP_mem_bytes gauge
node_sockstat_UDP_mem_bytes 1.019904e+06
# HELP node_sockstat_sockets_used Number of IPv4 sockets in use.
# TYPE node_sockstat_sockets_used gauge
node_sockstat_sockets_used 563
# HELP node_softnet_backlog_len Softnet backlog status
# TYPE node_softnet_backlog_len gauge
node_softnet_backlog_len{cpu="0"} 0
node_softnet_backlog_len{cpu="1"} 0
node_softnet_backlog_len{cpu="2"} 0
node_softnet_backlog_len{cpu="3"} 0
# HELP node_softnet_cpu_collision_total Number of collision occur while obtaining device lock while transmitting
# TYPE node_softnet_cpu_collision_total counter
node_softnet_cpu_collision_total{cpu="0"} 0
node_softnet_cpu_collision_total{cpu="1"} 0
node_softnet_cpu_collision_total{cpu="2"} 0
node_softnet_cpu_collision_total{cpu="3"} 0
# HELP node_softnet_dropped_total Number of dropped packets
# TYPE node_softnet_dropped_total counter
node_softnet_dropped_total{cpu="0"} 0
node_softnet_dropped_total{cpu="1"} 0
node_softnet_dropped_total{cpu="2"} 0
node_softnet_dropped_total{cpu="3"} 0
# HELP node_softnet_flow_limit_count_total Number of times flow limit has been reached
# TYPE node_softnet_flow_limit_count_total counter
node_softnet_flow_limit_count_total{cpu="0"} 0
node_softnet_flow_limit_count_total{cpu="1"} 0
node_softnet_flow_limit_count_total{cpu="2"} 0
node_softnet_flow_limit_count_total{cpu="3"} 0
# HELP node_softnet_processed_total Number of processed packets
# TYPE node_softnet_processed_total counter
node_softnet_processed_total{cpu="0"} 3.91430308e+08
node_softnet_processed_total{cpu="1"} 7.0427743e+07
node_softnet_processed_total{cpu="2"} 7.2377954e+07
node_softnet_processed_total{cpu="3"} 7.0743949e+07
# HELP node_softnet_received_rps_total Number of times cpu woken up received_rps
# TYPE node_softnet_received_rps_total counter
node_softnet_received_rps_total{cpu="0"} 0
node_softnet_received_rps_total{cpu="1"} 0
node_softnet_received_rps_total{cpu="2"} 0
node_softnet_received_rps_total{cpu="3"} 0
# HELP node_softnet_times_squeezed_total Number of times processing packets ran out of quota
# TYPE node_softnet_times_squeezed_total counter
node_softnet_times_squeezed_total{cpu="0"} 298183
node_softnet_times_squeezed_total{cpu="1"} 0
node_softnet_times_squeezed_total{cpu="2"} 0
node_softnet_times_squeezed_total{cpu="3"} 0
# HELP node_textfile_scrape_error 1 if there was an error opening or reading a file, 0 otherwise
# TYPE node_textfile_scrape_error gauge
node_textfile_scrape_error 0
# HELP node_thermal_zone_temp Zone temperature in Celsius
# TYPE node_thermal_zone_temp gauge
node_thermal_zone_temp{type="cpu-thermal",zone="0"} 28.232
# HELP node_time_clocksource_available_info Available clocksources read from '/sys/devices/system/clocksource'.
# TYPE node_time_clocksource_available_info gauge
node_time_clocksource_available_info{clocksource="arch_sys_counter",device="0"} 1
# HELP node_time_clocksource_current_info Current clocksource read from '/sys/devices/system/clocksource'.
# TYPE node_time_clocksource_current_info gauge
node_time_clocksource_current_info{clocksource="arch_sys_counter",device="0"} 1
# HELP node_time_seconds System time in seconds since epoch (1970).
# TYPE node_time_seconds gauge
node_time_seconds 1.7097658934862518e+09
# HELP node_time_zone_offset_seconds System time zone offset in seconds.
# TYPE node_time_zone_offset_seconds gauge
node_time_zone_offset_seconds{time_zone="UTC"} 0
# HELP node_timex_estimated_error_seconds Estimated error in seconds.
# TYPE node_timex_estimated_error_seconds gauge
node_timex_estimated_error_seconds 0
# HELP node_timex_frequency_adjustment_ratio Local clock frequency adjustment.
# TYPE node_timex_frequency_adjustment_ratio gauge
node_timex_frequency_adjustment_ratio 0.9999922578277588
# HELP node_timex_loop_time_constant Phase-locked loop time constant.
# TYPE node_timex_loop_time_constant gauge
node_timex_loop_time_constant 7
# HELP node_timex_maxerror_seconds Maximum error in seconds.
# TYPE node_timex_maxerror_seconds gauge
node_timex_maxerror_seconds 0.672
# HELP node_timex_offset_seconds Time offset in between local system and reference clock.
# TYPE node_timex_offset_seconds gauge
node_timex_offset_seconds -0.000593063
# HELP node_timex_pps_calibration_total Pulse per second count of calibration intervals.
# TYPE node_timex_pps_calibration_total counter
node_timex_pps_calibration_total 0
# HELP node_timex_pps_error_total Pulse per second count of calibration errors.
# TYPE node_timex_pps_error_total counter
node_timex_pps_error_total 0
# HELP node_timex_pps_frequency_hertz Pulse per second frequency.
# TYPE node_timex_pps_frequency_hertz gauge
node_timex_pps_frequency_hertz 0
# HELP node_timex_pps_jitter_seconds Pulse per second jitter.
# TYPE node_timex_pps_jitter_seconds gauge
node_timex_pps_jitter_seconds 0
# HELP node_timex_pps_jitter_total Pulse per second count of jitter limit exceeded events.
# TYPE node_timex_pps_jitter_total counter
node_timex_pps_jitter_total 0
# HELP node_timex_pps_shift_seconds Pulse per second interval duration.
# TYPE node_timex_pps_shift_seconds gauge
node_timex_pps_shift_seconds 0
# HELP node_timex_pps_stability_exceeded_total Pulse per second count of stability limit exceeded events.
# TYPE node_timex_pps_stability_exceeded_total counter
node_timex_pps_stability_exceeded_total 0
# HELP node_timex_pps_stability_hertz Pulse per second stability, average of recent frequency changes.
# TYPE node_timex_pps_stability_hertz gauge
node_timex_pps_stability_hertz 0
# HELP node_timex_status Value of the status array bits.
# TYPE node_timex_status gauge
node_timex_status 24577
# HELP node_timex_sync_status Is clock synchronized to a reliable server (1 = yes, 0 = no).
# TYPE node_timex_sync_status gauge
node_timex_sync_status 1
# HELP node_timex_tai_offset_seconds International Atomic Time (TAI) offset.
# TYPE node_timex_tai_offset_seconds gauge
node_timex_tai_offset_seconds 0
# HELP node_timex_tick_seconds Seconds between clock ticks.
# TYPE node_timex_tick_seconds gauge
node_timex_tick_seconds 0.01
# HELP node_udp_queues Number of allocated memory in the kernel for UDP datagrams in bytes.
# TYPE node_udp_queues gauge
node_udp_queues{ip="v4",queue="rx"} 0
node_udp_queues{ip="v4",queue="tx"} 0
node_udp_queues{ip="v6",queue="rx"} 0
node_udp_queues{ip="v6",queue="tx"} 0
# HELP node_uname_info Labeled system information as provided by the uname system call.
# TYPE node_uname_info gauge
node_uname_info{domainname="(none)",machine="aarch64",nodename="bettley",release="6.1.0-rpi7-rpi-v8",sysname="Linux",version="#1 SMP PREEMPT Debian 1:6.1.63-1+rpt1 (2023-11-24)"} 1
# HELP node_vmstat_oom_kill /proc/vmstat information field oom_kill.
# TYPE node_vmstat_oom_kill untyped
node_vmstat_oom_kill 0
# HELP node_vmstat_pgfault /proc/vmstat information field pgfault.
# TYPE node_vmstat_pgfault untyped
node_vmstat_pgfault 3.706999478e+09
# HELP node_vmstat_pgmajfault /proc/vmstat information field pgmajfault.
# TYPE node_vmstat_pgmajfault untyped
node_vmstat_pgmajfault 5791
# HELP node_vmstat_pgpgin /proc/vmstat information field pgpgin.
# TYPE node_vmstat_pgpgin untyped
node_vmstat_pgpgin 1.115617e+06
# HELP node_vmstat_pgpgout /proc/vmstat information field pgpgout.
# TYPE node_vmstat_pgpgout untyped
node_vmstat_pgpgout 2.55770725e+08
# HELP node_vmstat_pswpin /proc/vmstat information field pswpin.
# TYPE node_vmstat_pswpin untyped
node_vmstat_pswpin 0
# HELP node_vmstat_pswpout /proc/vmstat information field pswpout.
# TYPE node_vmstat_pswpout untyped
node_vmstat_pswpout 0
# HELP process_cpu_seconds_total Total user and system CPU time spent in seconds.
# TYPE process_cpu_seconds_total counter
process_cpu_seconds_total 0.05
# HELP process_max_fds Maximum number of open file descriptors.
# TYPE process_max_fds gauge
process_max_fds 1.048576e+06
# HELP process_open_fds Number of open file descriptors.
# TYPE process_open_fds gauge
process_open_fds 9
# HELP process_resident_memory_bytes Resident memory size in bytes.
# TYPE process_resident_memory_bytes gauge
process_resident_memory_bytes 1.2292096e+07
# HELP process_start_time_seconds Start time of the process since unix epoch in seconds.
# TYPE process_start_time_seconds gauge
process_start_time_seconds 1.7097658257e+09
# HELP process_virtual_memory_bytes Virtual memory size in bytes.
# TYPE process_virtual_memory_bytes gauge
process_virtual_memory_bytes 1.269604352e+09
# HELP process_virtual_memory_max_bytes Maximum amount of virtual memory available in bytes.
# TYPE process_virtual_memory_max_bytes gauge
process_virtual_memory_max_bytes 1.8446744073709552e+19
# HELP promhttp_metric_handler_errors_total Total number of internal errors encountered by the promhttp metric handler.
# TYPE promhttp_metric_handler_errors_total counter
promhttp_metric_handler_errors_total{cause="encoding"} 0
promhttp_metric_handler_errors_total{cause="gathering"} 0
# HELP promhttp_metric_handler_requests_in_flight Current number of scrapes being served.
# TYPE promhttp_metric_handler_requests_in_flight gauge
promhttp_metric_handler_requests_in_flight 1
# HELP promhttp_metric_handler_requests_total Total number of scrapes by HTTP status code.
# TYPE promhttp_metric_handler_requests_total counter
promhttp_metric_handler_requests_total{code="200"} 0
promhttp_metric_handler_requests_total{code="500"} 0
promhttp_metric_handler_requests_total{code="503"} 0
So... yay?
We could shift this to a separate repository, or we can just rip it back out of the incubator and create a separate Application resource for it in this task file. We could organize it a thousand different ways. A prometheus_node_exporter repository? A prometheus repository? A monitoring repository?
Because I'm not really sure which I'd like to do, I'll just defer the decision until a later date and move on to other things.
Router BGP Configuration
Before I go too much further, I want to get load balancer services working.
With major cloud vendors that support Kubernetes, creating a service of type LoadBalancer will create a load balancer within that platform that provides external access to that service. This spares us from having to use ClusterIP, etc, to access our services.
This functionality isn't automatically available in a homelab. Why would it be? How could it know what you want? Regardless of the complexities preventing this from Just Working™, this topic is often a source of irritation to the homelabber.
Fortunately, a gentleman and scholar named Dave Anderson spent (I assume) a significant amount of time and devised a system, MetalLB, to bring load balancer functionality to bare metal clusters.
With a reasonable amount of effort, we can configure a router supporting BGP and a Kubernetes cluster running MetalLB into a pretty clean network infrastructure.
Network Architecture Overview
The BGP configuration creates a sophisticated routing topology that enables dynamic load balancer allocation:
Network Segmentation
- Infrastructure CIDR:
10.4.0.0/20(main cluster network) - Service CIDR:
172.16.0.0/20(Kubernetes internal services) - Pod CIDR:
192.168.0.0/16(container networking) - MetalLB Pool:
10.4.11.0/24(load balancer IP range:10.4.11.0 - 10.4.15.254)
BGP Autonomous System Design
- Router ASN:
64500(OPNsense gateway acting as route reflector) - Cluster ASN:
64501(all Kubernetes nodes share this AS number) - Peer relationship: eBGP (External BGP) between different AS numbers
This design follows RFC 7938 recommendations for private AS numbers in the range 64512-65534.
OPNsense Router Configuration
In my case, this starts with configuring my router/firewall (running OPNsense) to support BGP.
Step 1: FRR Plugin Installation
This means installing the os-frr (for "Free-Range Routing") plugin:
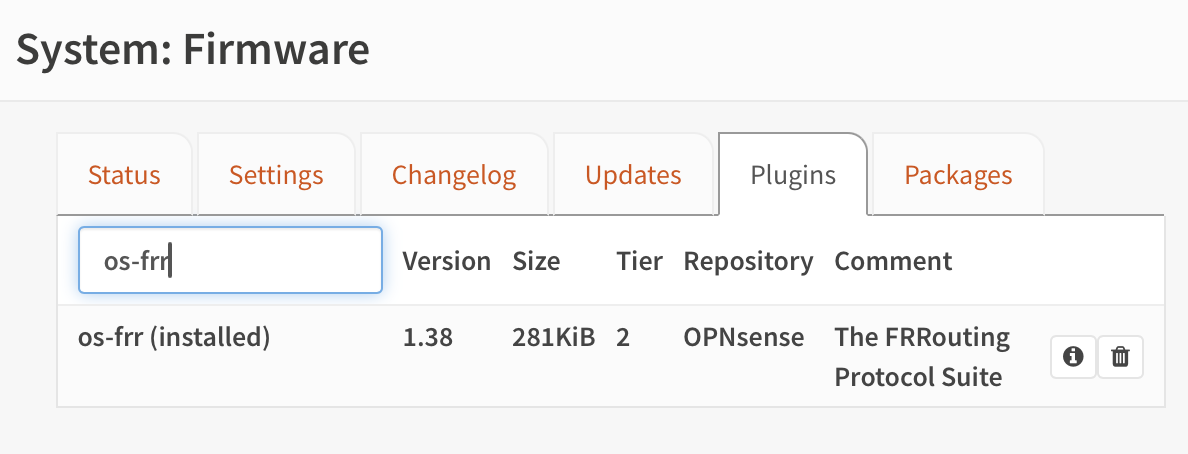
Free-Range Routing (FRR) is a routing software suite that provides:
- BGP-4: Border Gateway Protocol implementation
- OSPF: Open Shortest Path First for dynamic routing
- ISIS/RIP: Additional routing protocol support
- Route maps: Sophisticated traffic engineering capabilities
Step 2: Enable Global Routing
Then we enable routing:
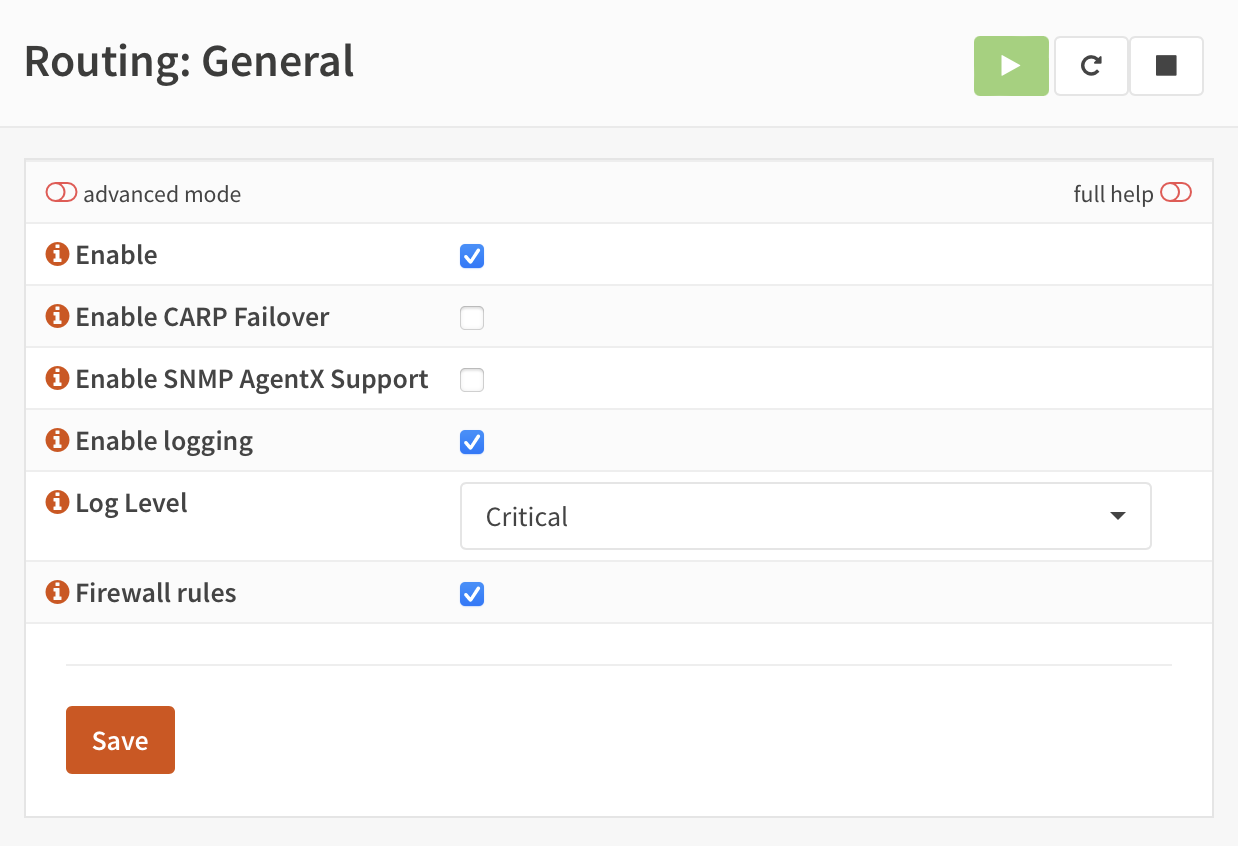
This configuration enables:
- Kernel route injection: FRR can modify the system routing table
- Route redistribution: Between different routing protocols
- Multi-protocol support: IPv4 and IPv6 route advertisement
Step 3: BGP Configuration
Then we enable BGP. We give the router an AS number of 64500.
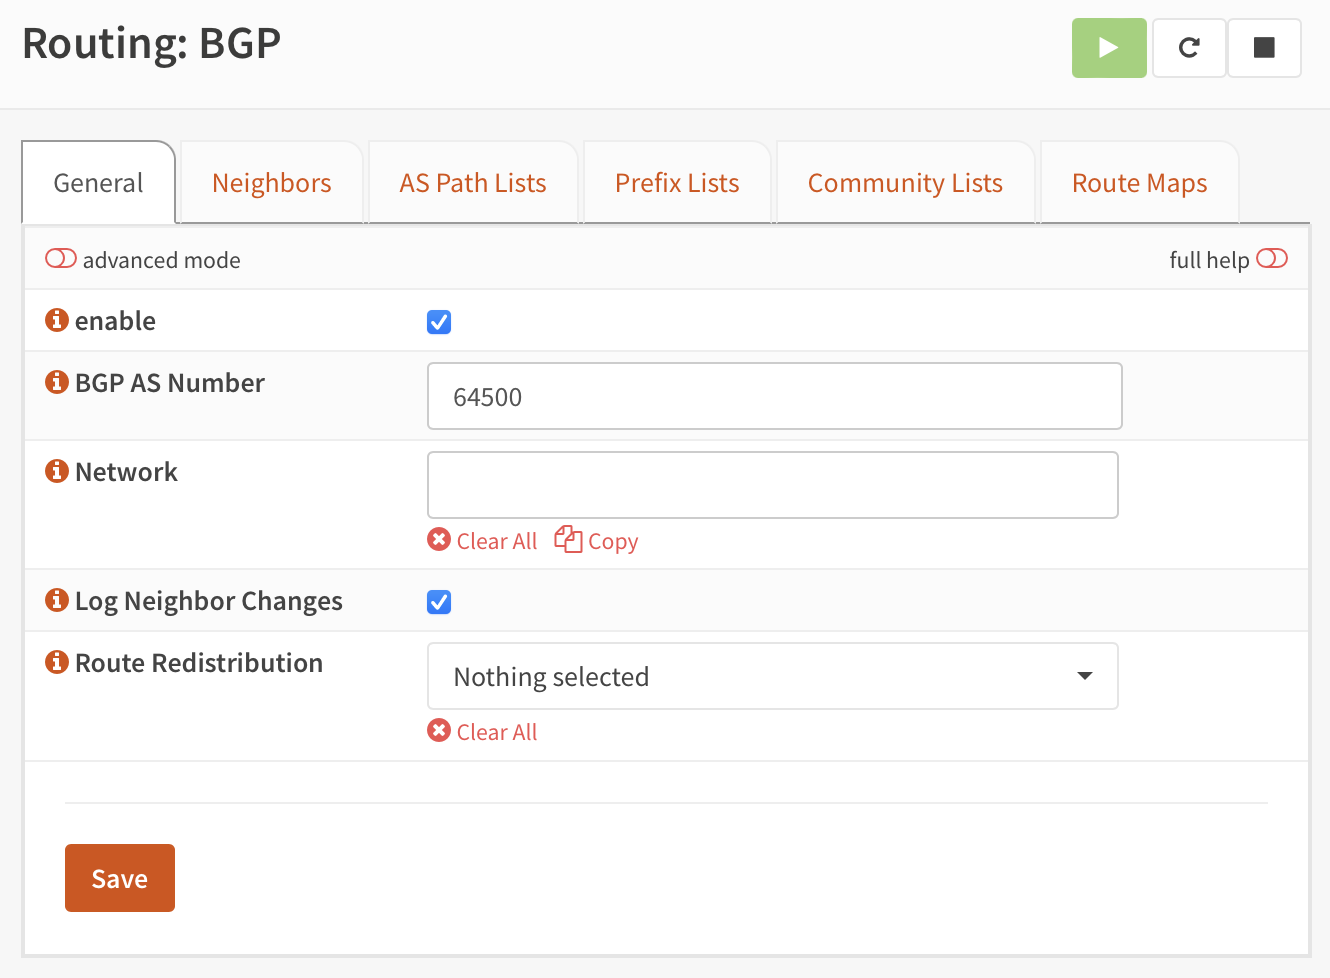
BGP Configuration Parameters:
- Router ID: Typically set to the router's loopback or primary interface IP (
10.4.0.1) - AS Number:
64500(private ASN for the gateway) - Network advertisements: Routes to be advertised to BGP peers
- Redistribution: Connected routes, static routes, and other protocols
Step 4: BGP Neighbor Configuration
Then we add each of the nodes that might run MetalLB "speakers" as neighbors. They all will share a single AS number, 64501.
Kubernetes Node BGP Peers:
# Control Plane Nodes (also run MetalLB speakers)
10.4.0.11 (bettley)  - ASN 64501
10.4.0.12 (cargyll)  - ASN 64501
10.4.0.13 (dalt)     - ASN 64501

# Worker Nodes (potential MetalLB speakers)
10.4.0.14 (erenford) - ASN 64501
10.4.0.15 (fenn)     - ASN 64501
10.4.0.16 (gardener) - ASN 64501
10.4.0.17 (harlton)  - ASN 64501
10.4.0.18 (inchfield) - ASN 64501
10.4.0.19 (jast)     - ASN 64501
10.4.0.20 (karstark) - ASN 64501
10.4.0.21 (lipps)    - ASN 64501
10.4.1.10 (velaryon) - ASN 64501
Neighbor Configuration Details:
- Peer Type: External BGP (eBGP) due to different AS numbers
- Authentication: Can use MD5 authentication for security
- Timers: Hold time (180s) and keepalive (60s) for session management
- Route filters: Accept only specific route prefixes from cluster
BGP Route Advertisement Strategy
Router Advertisements
The OPNsense router advertises:
- Default route (
0.0.0.0/0) to provide internet access - Infrastructure networks (
10.4.0.0/20) for internal cluster communication - External services that may be hosted outside the cluster
Cluster Advertisements
MetalLB speakers advertise:
- LoadBalancer service IPs from the
10.4.11.0/24pool - Individual /32 routes for each allocated load balancer IP
- Equal-cost multi-path (ECMP) when multiple speakers announce the same service
Route Selection and Load Balancing
BGP Path Selection
When multiple MetalLB speakers advertise the same service IP:
- Prefer shortest AS path (all speakers have same path length)
- Prefer lowest origin code (IGP over EGP over incomplete)
- Prefer lowest MED (Multi-Exit Discriminator)
- Prefer eBGP over iBGP (not applicable here)
- Prefer lowest IGP cost to BGP next-hop
- Prefer oldest route (route stability)
Router Load Balancing
OPNsense can be configured for:
- Per-packet load balancing: Maximum utilization but potential packet reordering
- Per-flow load balancing: Maintains flow affinity while distributing across paths
- Weighted load balancing: Different weights for different next-hops
Security Considerations
BGP Session Security
- MD5 Authentication: Prevents unauthorized BGP session establishment
- TTL Security: Ensures BGP packets come from directly connected neighbors
- Prefix filters: Prevent route hijacking by filtering unexpected announcements
Route Filtering
# Example prefix filter configuration
prefix-list METALLB-ROUTES permit 10.4.11.0/24 le 32
neighbor 10.4.0.11 prefix-list METALLB-ROUTES in
This ensures the router only accepts MetalLB routes within the designated pool.
Monitoring and Troubleshooting
BGP Session Monitoring
Key commands for BGP troubleshooting:
# View BGP summary
vtysh -c "show ip bgp summary"

# Check specific neighbor status
vtysh -c "show ip bgp neighbor 10.4.0.11"

# View advertised routes
vtysh -c "show ip bgp advertised-routes"

# Check routing table
ip route show table main
Common BGP Issues
- Session flapping: Often due to network connectivity or timer mismatches
- Route installation failures: Check routing table limits and memory
- Asymmetric routing: Verify return path routing and firewalls
Integration with MetalLB
The BGP configuration on the router side enables MetalLB to:
- Establish BGP sessions with the cluster gateway
- Advertise LoadBalancer service IPs dynamically as services are created
- Withdraw routes automatically when services are deleted
- Provide redundancy through multiple speaker nodes
This creates a fully dynamic load balancing solution where:
- Services get real IP addresses from the external network
- Traffic routes optimally through the cluster
- Failover happens automatically via BGP reconvergence
- No manual network configuration required for new services
In the next section, we'll configure MetalLB to establish these BGP sessions and begin advertising load balancer routes.
MetalLB
MetalLB requires that its namespace have some extra privileges:
  apiVersion: 'v1'
  kind: 'Namespace'
  metadata:
    name: 'metallb'
    labels:
      name: 'metallb'
      managed-by: 'argocd'
      pod-security.kubernetes.io/enforce: privileged
      pod-security.kubernetes.io/audit: privileged
      pod-security.kubernetes.io/warn: privileged
Its application is (perhaps surprisingly) rather simple to configure:
apiVersion: 'argoproj.io/v1alpha1'
kind: 'Application'
metadata:
  name: 'metallb'
  namespace: 'argocd'
  labels:
    name: 'metallb'
    managed-by: 'argocd'
spec:
  project: 'metallb'
  source:
    repoURL: 'https://metallb.github.io/metallb'
    chart: 'metallb'
    targetRevision: '0.14.3'
    helm:
      releaseName: 'metallb'
      valuesObject:
        rbac:
          create: true
        prometheus:
          scrapeAnnotations: true
          metricsPort: 7472
          rbacPrometheus: true
  destination:
    server: 'https://kubernetes.default.svc'
    namespace: 'metallb'
  syncPolicy:
    automated:
      prune: true
      selfHeal: true
    syncOptions:
      - Validate=true
      - CreateNamespace=false
      - PrunePropagationPolicy=foreground
      - PruneLast=true
      - RespectIgnoreDifferences=true
      - ApplyOutOfSyncOnly=true
It does require some extra resources, though. The first of these is an address pool from which to allocate IP addresses. It's important that this not overlap with a DHCP pool.
The full network is 10.4.0.0/20 and I've configured the DHCP server to only serve addresses in 10.4.0.100-254, so we have plenty of space to play with. Right now, I'll use 10.4.11.0-10.4.15.254, which gives ~1250 usable addresses. I don't think I'll use quite that many.
apiVersion: 'metallb.io/v1beta1'
kind: 'IPAddressPool'
metadata:
  name: 'primary'
  namespace: 'metallb'
spec:
  addresses:
  - 10.4.11.0 - 10.4.15.254
Then we need to configure MetalLB to act as a BGP peer:
apiVersion: 'metallb.io/v1beta2'
kind: 'BGPPeer'
metadata:
  name: 'marbrand'
  namespace: 'metallb'
spec:
  myASN: 64501
  peerASN: 64500
  peerAddress: 10.4.0.1
And advertise the IP address pool:
apiVersion: 'metallb.io/v1beta1'
kind: 'BGPAdvertisement'
metadata:
  name: 'primary'
  namespace: 'metallb'
spec:
  ipAddressPools:
    - 'primary'
That's that; we can deploy it, and soon we'll be up and running, although we can't yet test it.
Testing MetalLB
The simplest way to test MetalLB is just to deploy an application with a LoadBalancer service and see if it works.
I'm a fan of httpbin and its Go port, httpbingo, so up it goes:
apiVersion: 'argoproj.io/v1alpha1'
kind: 'Application'
metadata:
  name: 'httpbin'
  namespace: 'argocd'
  labels:
    name: 'httpbin'
    managed-by: 'argocd'
spec:
  project: 'httpbin'
  source:
    repoURL: 'https://matheusfm.dev/charts'
    chart: 'httpbin'
    targetRevision: '0.1.1'
    helm:
      releaseName: 'httpbin'
      valuesObject:
        service:
          type: 'LoadBalancer'
  destination:
    server: 'https://kubernetes.default.svc'
    namespace: 'httpbin'
  syncPolicy:
    automated:
      prune: true
      selfHeal: true
    syncOptions:
      - Validate=true
      - CreateNamespace=true
      - PrunePropagationPolicy=foreground
      - PruneLast=true
      - RespectIgnoreDifferences=true
      - ApplyOutOfSyncOnly=true
Very quickly, it's synced:
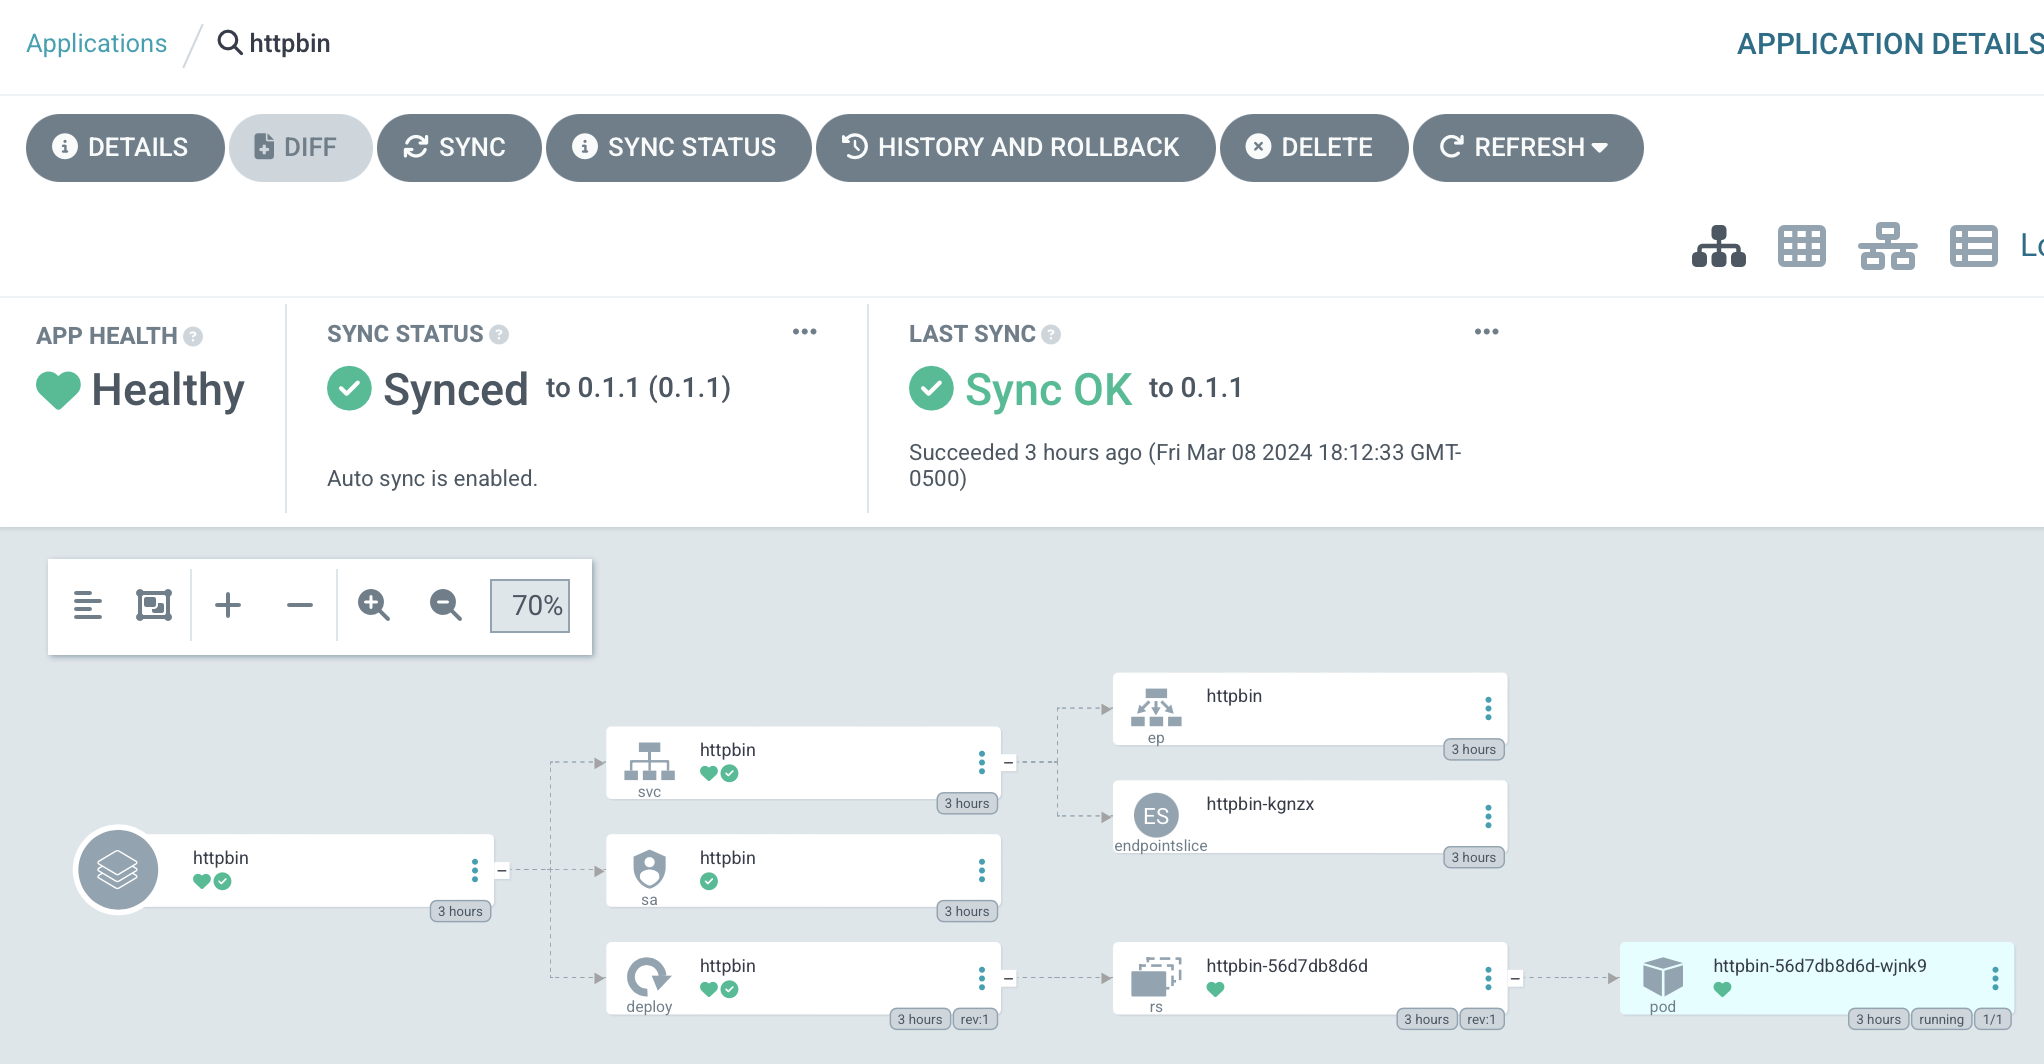
We can get the IP address allocated for the load balancer with kubectl -n httpbin get svc:
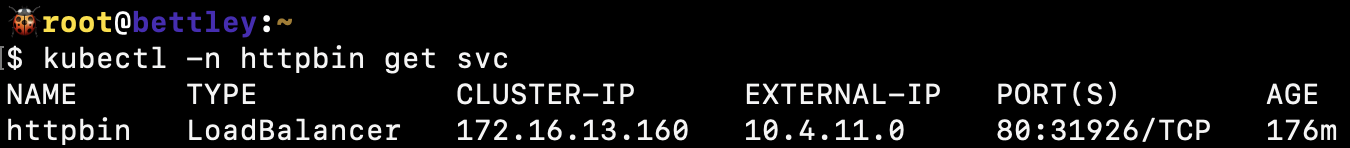
And sure enough, it's allocated from the IP address pool we specified. That seems like an excellent sign!
Can we access it from a web browser running on a computer on a different network?
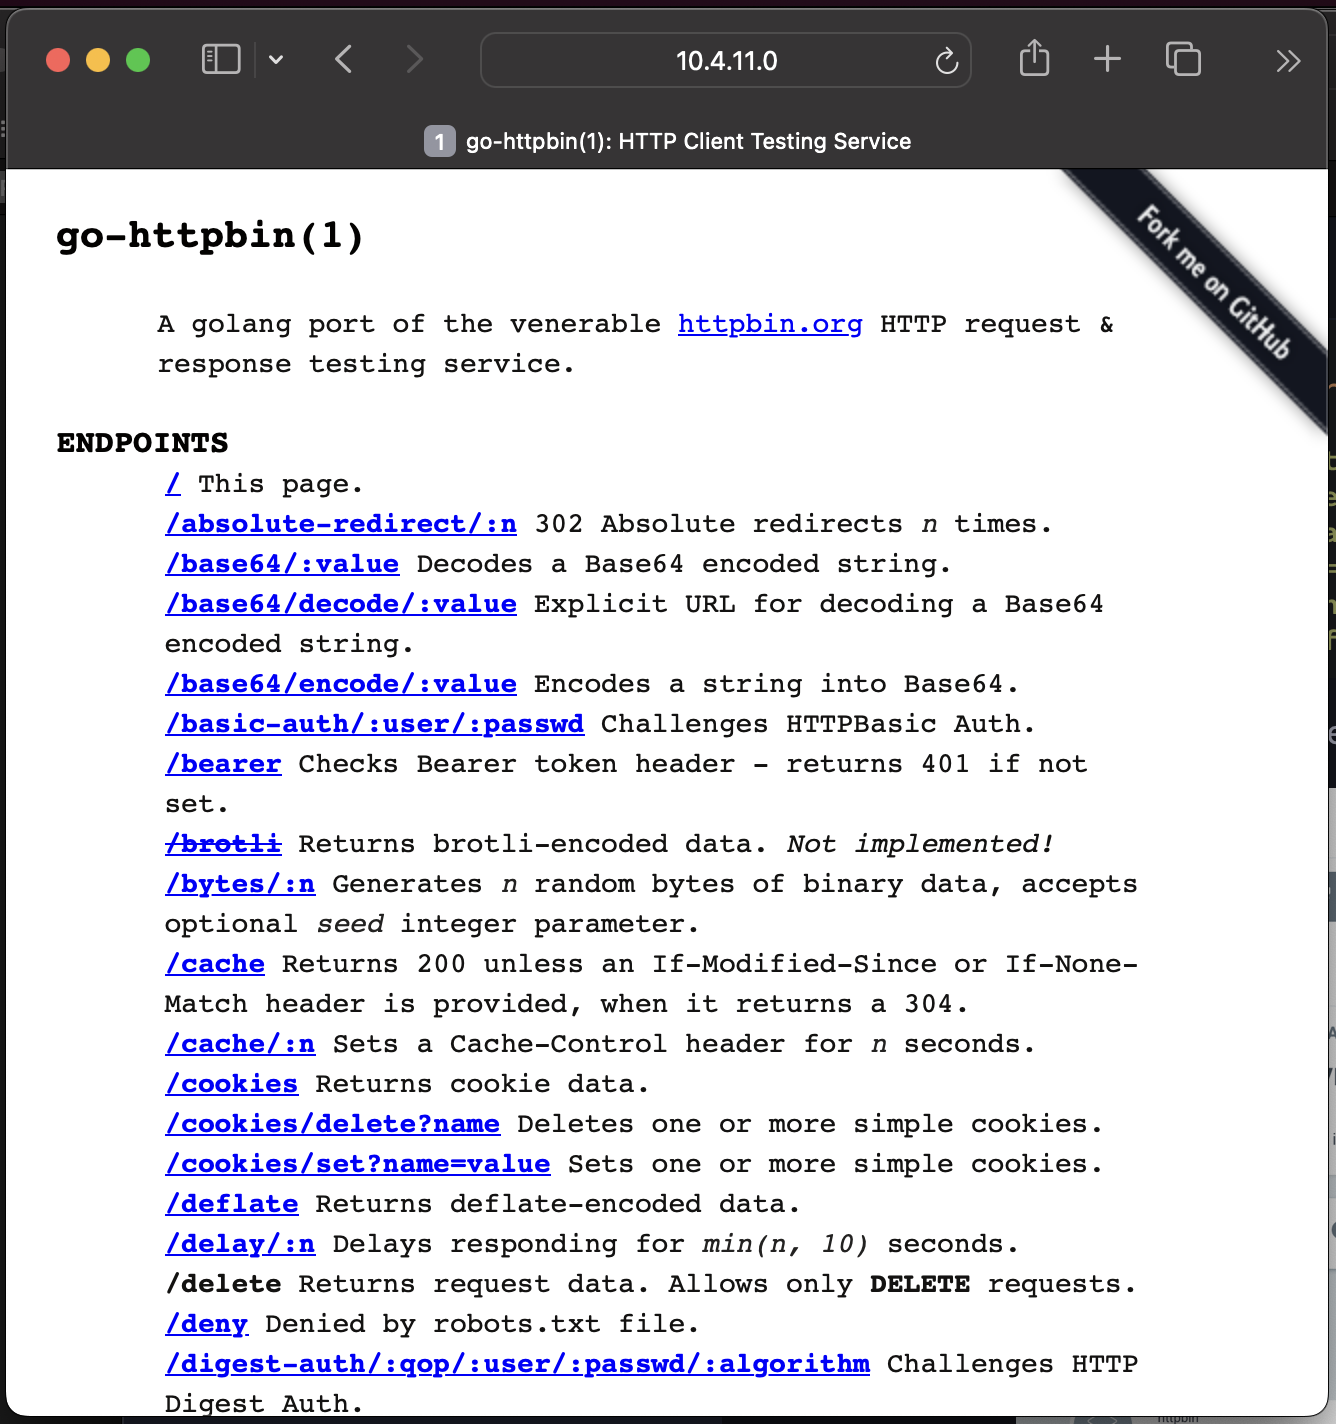
Yes, we can! Our load balancer system is working!
Comprehensive MetalLB Testing Suite
While the httpbin test demonstrates basic functionality, production MetalLB deployments require more thorough validation of various scenarios and failure modes.
Phase 1: Basic Functionality Tests
1.1 IP Address Allocation Verification
First, verify that MetalLB allocates IP addresses from the configured pool:
# Check the configured IP address pool
kubectl -n metallb get ipaddresspool primary -o yaml

# Deploy multiple LoadBalancer services and verify allocations
kubectl create deployment test-nginx --image=nginx
kubectl expose deployment test-nginx --type=LoadBalancer --port=80

# Verify sequential allocation from pool
kubectl get svc test-nginx -o jsonpath='{.status.loadBalancer.ingress[0].ip}'
Expected behavior:
- IPs allocated from
10.4.11.0 - 10.4.15.254range - Sequential allocation starting from pool beginning
- No IP conflicts between services
1.2 Service Lifecycle Testing
Test the complete service lifecycle to ensure proper cleanup:
# Create service and note allocated IP
kubectl create deployment lifecycle-test --image=httpd
kubectl expose deployment lifecycle-test --type=LoadBalancer --port=80
ALLOCATED_IP=$(kubectl get svc lifecycle-test -o jsonpath='{.status.loadBalancer.ingress[0].ip}')

# Verify service is accessible
curl -s http://$ALLOCATED_IP/ | grep "It works!"

# Delete service and verify IP is released
kubectl delete svc lifecycle-test
kubectl delete deployment lifecycle-test

# Verify IP is available for reallocation
kubectl create deployment reallocation-test --image=nginx
kubectl expose deployment reallocation-test --type=LoadBalancer --port=80
NEW_IP=$(kubectl get svc reallocation-test -o jsonpath='{.status.loadBalancer.ingress[0].ip}')

# Should reuse the previously released IP
echo "Original IP: $ALLOCATED_IP, New IP: $NEW_IP"
Phase 2: BGP Advertisement Testing
2.1 BGP Session Health Verification
Monitor BGP session establishment and health:
# Check MetalLB speaker status
kubectl -n metallb get pods -l component=speaker

# Verify BGP sessions from router perspective
goldentooth command allyrion 'vtysh -c "show ip bgp summary"'

# Check BGP neighbor status for specific node
goldentooth command allyrion 'vtysh -c "show ip bgp neighbor 10.4.0.11"'
Expected BGP session states:
- Established: BGP session is active and exchanging routes
- Route count: Number of routes received from each speaker
- Session uptime: Indicates session stability
2.2 Route Advertisement Verification
Verify that LoadBalancer IPs are properly advertised via BGP:
# Create test service
kubectl create deployment bgp-test --image=nginx
kubectl expose deployment bgp-test --type=LoadBalancer --port=80
TEST_IP=$(kubectl get svc bgp-test -o jsonpath='{.status.loadBalancer.ingress[0].ip}')

# Check route advertisement on router
goldentooth command allyrion "vtysh -c 'show ip bgp | grep $TEST_IP'"

# Verify route in kernel routing table
goldentooth command allyrion "ip route show | grep $TEST_IP"

# Test route withdrawal
kubectl delete svc bgp-test
sleep 30

# Verify route is withdrawn
goldentooth command allyrion "vtysh -c 'show ip bgp | grep $TEST_IP' || echo 'Route withdrawn'"
Phase 3: High Availability Testing
3.1 Speaker Node Failure Simulation
Test MetalLB's behavior when speaker nodes fail:
# Identify which node is announcing a service
kubectl create deployment ha-test --image=nginx
kubectl expose deployment ha-test --type=LoadBalancer --port=80
HA_IP=$(kubectl get svc ha-test -o jsonpath='{.status.loadBalancer.ingress[0].ip}')

# Find announcing node from BGP table
goldentooth command allyrion "vtysh -c 'show ip bgp $HA_IP'"

# Simulate node failure by stopping kubelet on announcing node
ANNOUNCING_NODE=$(kubectl get svc ha-test -o jsonpath='{.metadata.annotations.metallb\.universe\.tf/announcing-node}' 2>/dev/null || echo "bettley")
goldentooth command_root $ANNOUNCING_NODE 'systemctl stop kubelet'

# Wait for BGP reconvergence (typically 30-180 seconds)
sleep 60

# Verify service is still accessible (new node should announce)
curl -s http://$HA_IP/ | grep "Welcome to nginx"

# Check new announcing node
goldentooth command allyrion "vtysh -c 'show ip bgp $HA_IP'"

# Restore failed node
goldentooth command_root $ANNOUNCING_NODE 'systemctl start kubelet'
3.2 Split-Brain Prevention Testing
Verify that MetalLB prevents split-brain scenarios where multiple nodes announce the same service:
# Deploy service with specific node selector to control placement
cat <<EOF | kubectl apply -f -
apiVersion: v1
kind: Service
metadata:
  name: split-brain-test
  annotations:
    metallb.universe.tf/allow-shared-ip: "split-brain-test"
spec:
  type: LoadBalancer
  selector:
    app: split-brain-test
  ports:
  - port: 80
    targetPort: 80
---
apiVersion: apps/v1
kind: Deployment
metadata:
  name: split-brain-test
spec:
  replicas: 2
  selector:
    matchLabels:
      app: split-brain-test
  template:
    metadata:
      labels:
        app: split-brain-test
    spec:
      containers:
      - name: nginx
        image: nginx
        ports:
        - containerPort: 80
EOF

# Monitor BGP announcements for the service IP
SPLIT_IP=$(kubectl get svc split-brain-test -o jsonpath='{.status.loadBalancer.ingress[0].ip}')
goldentooth command allyrion "vtysh -c 'show ip bgp $SPLIT_IP detail'"

# Should see only one announcement path, not multiple conflicting paths
Phase 4: Performance and Scale Testing
4.1 IP Pool Exhaustion Testing
Test behavior when IP address pool is exhausted:
# Calculate available IPs in pool (10.4.11.0 - 10.4.15.254 = ~1250 IPs)
# Deploy services until pool exhaustion

for i in {1..10}; do
  kubectl create deployment scale-test-$i --image=nginx
  kubectl expose deployment scale-test-$i --type=LoadBalancer --port=80
  echo "Created service $i"
  sleep 5
done

# Check for services stuck in Pending state
kubectl get svc | grep Pending

# Verify MetalLB events for pool exhaustion
kubectl -n metallb get events --sort-by='.lastTimestamp'
4.2 BGP Convergence Time Measurement
Measure BGP convergence time under various scenarios:
# Create test service and measure initial advertisement time
start_time=$(date +%s)
kubectl create deployment convergence-test --image=nginx
kubectl expose deployment convergence-test --type=LoadBalancer --port=80

# Wait for IP allocation
while [ -z "$(kubectl get svc convergence-test -o jsonpath='{.status.loadBalancer.ingress[0].ip}' 2>/dev/null)" ]; do
  sleep 1
done

CONV_IP=$(kubectl get svc convergence-test -o jsonpath='{.status.loadBalancer.ingress[0].ip}')
echo "IP allocated: $CONV_IP"

# Wait for BGP advertisement
while ! goldentooth command allyrion "ip route show | grep $CONV_IP" >/dev/null 2>&1; do
  sleep 1
done

end_time=$(date +%s)
convergence_time=$((end_time - start_time))
echo "BGP convergence time: ${convergence_time} seconds"
Phase 5: Integration Testing
5.1 ExternalDNS Integration
Test automatic DNS record creation for LoadBalancer services:
# Deploy service with DNS annotation
cat <<EOF | kubectl apply -f -
apiVersion: v1
kind: Service
metadata:
  name: dns-integration-test
  annotations:
    external-dns.alpha.kubernetes.io/hostname: test.goldentooth.net
spec:
  type: LoadBalancer
  selector:
    app: dns-test
  ports:
  - port: 80
    targetPort: 80
---
apiVersion: apps/v1
kind: Deployment
metadata:
  name: dns-test
spec:
  replicas: 1
  selector:
    matchLabels:
      app: dns-test
  template:
    metadata:
      labels:
        app: dns-test
    spec:
      containers:
      - name: nginx
        image: nginx
        ports:
        - containerPort: 80
EOF

# Wait for DNS propagation
sleep 60

# Test DNS resolution
nslookup test.goldentooth.net

# Test HTTP access via DNS name
curl -s http://test.goldentooth.net/ | grep "Welcome to nginx"
5.2 TLS Certificate Integration
Test automatic TLS certificate provisioning for LoadBalancer services:
# Deploy service with cert-manager annotations
cat <<EOF | kubectl apply -f -
apiVersion: v1
kind: Service
metadata:
  name: tls-integration-test
  annotations:
    external-dns.alpha.kubernetes.io/hostname: tls-test.goldentooth.net
    cert-manager.io/cluster-issuer: letsencrypt-prod
spec:
  type: LoadBalancer
  selector:
    app: tls-test
  ports:
  - port: 443
    targetPort: 443
    name: https
  - port: 80
    targetPort: 80
    name: http
---
apiVersion: networking.k8s.io/v1
kind: Ingress
metadata:
  name: tls-test-ingress
  annotations:
    cert-manager.io/cluster-issuer: letsencrypt-prod
spec:
  tls:
  - hosts:
    - tls-test.goldentooth.net
    secretName: tls-test-cert
  rules:
  - host: tls-test.goldentooth.net
    http:
      paths:
      - path: /
        pathType: Prefix
        backend:
          service:
            name: tls-integration-test
            port:
              number: 80
EOF

# Wait for certificate provisioning
kubectl wait --for=condition=Ready certificate/tls-test-cert --timeout=300s

# Test HTTPS access
curl -s https://tls-test.goldentooth.net/ | grep "Welcome to nginx"
Phase 6: Troubleshooting and Monitoring
6.1 MetalLB Component Health
Monitor MetalLB component health and logs:
# Check MetalLB controller status
kubectl -n metallb get pods -l component=controller
kubectl -n metallb logs -l component=controller --tail=50

# Check MetalLB speaker status on each node
kubectl -n metallb get pods -l component=speaker -o wide
kubectl -n metallb logs -l component=speaker --tail=50

# Check MetalLB configuration
kubectl -n metallb get ipaddresspool,bgppeer,bgpadvertisement -o wide
6.2 BGP Session Troubleshooting
Debug BGP session issues:
# Check BGP session state
goldentooth command allyrion 'vtysh -c "show ip bgp summary"'

# Detailed neighbor analysis
for node_ip in 10.4.0.11 10.4.0.12 10.4.0.13; do
  echo "=== BGP Neighbor $node_ip ==="
  goldentooth command allyrion "vtysh -c 'show ip bgp neighbor $node_ip'"
done

# Check for BGP route-map and prefix-list configurations
goldentooth command allyrion 'vtysh -c "show ip bgp route-map"'
goldentooth command allyrion 'vtysh -c "show ip prefix-list"'

# Monitor BGP route changes in real-time
goldentooth command allyrion 'vtysh -c "debug bgp events"'
6.3 Network Connectivity Testing
Comprehensive network path testing:
# Test connectivity from external networks
for test_ip in $(kubectl get svc -A -o jsonpath='{.items[?(@.spec.type=="LoadBalancer")].status.loadBalancer.ingress[0].ip}'); do
  echo "Testing connectivity to $test_ip"

  # Test from router
  goldentooth command allyrion "ping -c 3 $test_ip"

  # Test HTTP connectivity
  goldentooth command allyrion "curl -s -o /dev/null -w '%{http_code}' http://$test_ip/ || echo 'Connection failed'"

  # Test from external network (if possible)
  # ping -c 3 $test_ip
done

# Test internal cluster connectivity
kubectl run network-test --image=busybox --rm -it --restart=Never -- /bin/sh
# From within the pod:
# wget -qO- http://test-service.default.svc.cluster.local/
This comprehensive testing suite ensures MetalLB is functioning correctly across all operational scenarios, from basic IP allocation to complex failure recovery and integration testing. Each test phase builds confidence in the load balancer implementation and helps identify potential issues before they impact production workloads.
Refactoring Argo CD
We're only a few projects in, and using Ansible to install our Argo CD applications seems a bit weak. It's not very GitOps-y to run a Bash command that runs an Ansible playbook that kubectls some manifests into our Kubernetes cluster.
In fact, the less we mess with Argo CD itself, the better. Eventually, we'll be able to create a repository on GitHub and see resources appear within our Kubernetes cluster without having to touch Argo CD at all!
We'll do this by using the power of ApplicationSet resources.
First, we'll create a secret to hold a GitHub token. This part is optional, but it'll allow us to use the API more.
Second, we'll create an AppProject to encompass these applications. It'll have pretty broad permissions at first, though I'll try and tighten them up a bit.
apiVersion: 'argoproj.io/v1alpha1'
kind: 'AppProject'
metadata:
  name: 'gitops-repo'
  namespace: 'argocd'
  finalizers:
    - 'resources-finalizer.argocd.argoproj.io'
spec:
  description: 'Goldentooth GitOps-Repo project'
  sourceRepos:
    - '*'
  destinations:
    - namespace: '!kube-system'
      server: '*'
    - namespace: '*'
      server: '*'
  clusterResourceWhitelist:
    - group: '*'
      kind: '*'
Then an ApplicationSet.
apiVersion: 'argoproj.io/v1alpha1'
kind: 'ApplicationSet'
metadata:
  name: 'gitops-repo'
  namespace: 'argocd'
spec:
  generators:
    - scmProvider:
        github:
          organization: 'goldentooth'
          tokenRef:
            secretName: 'github-token'
            key: 'token'
        filters:
          - labelMatch: 'gitops-repo'
  template:
    goTemplate: true
    goTemplateOptions: ["missingkey=error"]
    metadata:
      # Prefix name with `gitops-repo-`.
      # This allows us to define the `Application` manifest within the repo and
      # have significantly greater flexibility, at the cost of an additional
      # application in the Argo CD UI.
      name: 'gitops-repo-{{ .repository }}'
    spec:
      source:
        repoURL: '{{ .url }}'
        targetRevision: '{{ .branch }}'
        path: './'
      project: 'gitops-repo'
      destination:
        server: https://kubernetes.default.svc
        namespace: '{{ .repository }}'
The idea is that I'll create a repository and give it a topic of gitops-repo. This will be matched by the labelMatch filter, and then Argo CD will deploy whatever manifests it finds there.
MetalLB is the natural place to start.
We don't actually have to do that much to get this working:
- Create a new repository
metallb. - Add a
Chart.yamlfile with some boilerplate. - Add the manifests to a
templates/directory. - Add a
values.yamlfile with values to substitute into the manifests. - As mentioned above, edit the repo to give it the
gitops-repotopic.
Within a few minutes, Argo CD will notice the changes and deploy a gitops-repo-metallb application:
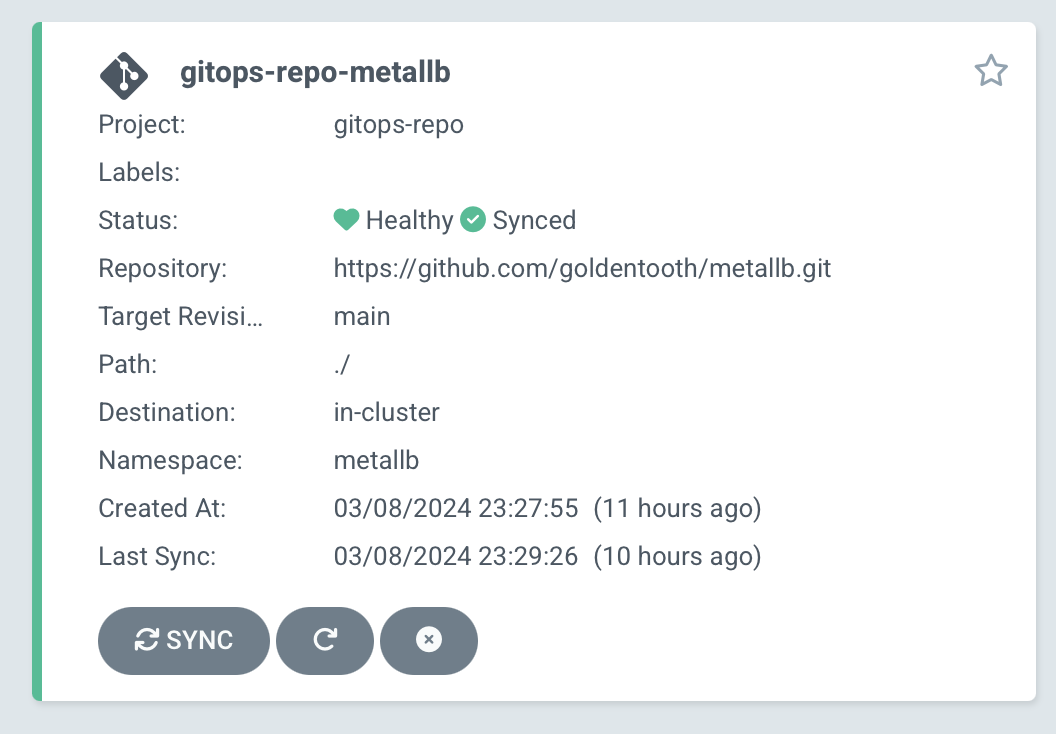
If we click into it, we'll see the resources deployed by the manifests within the repository:
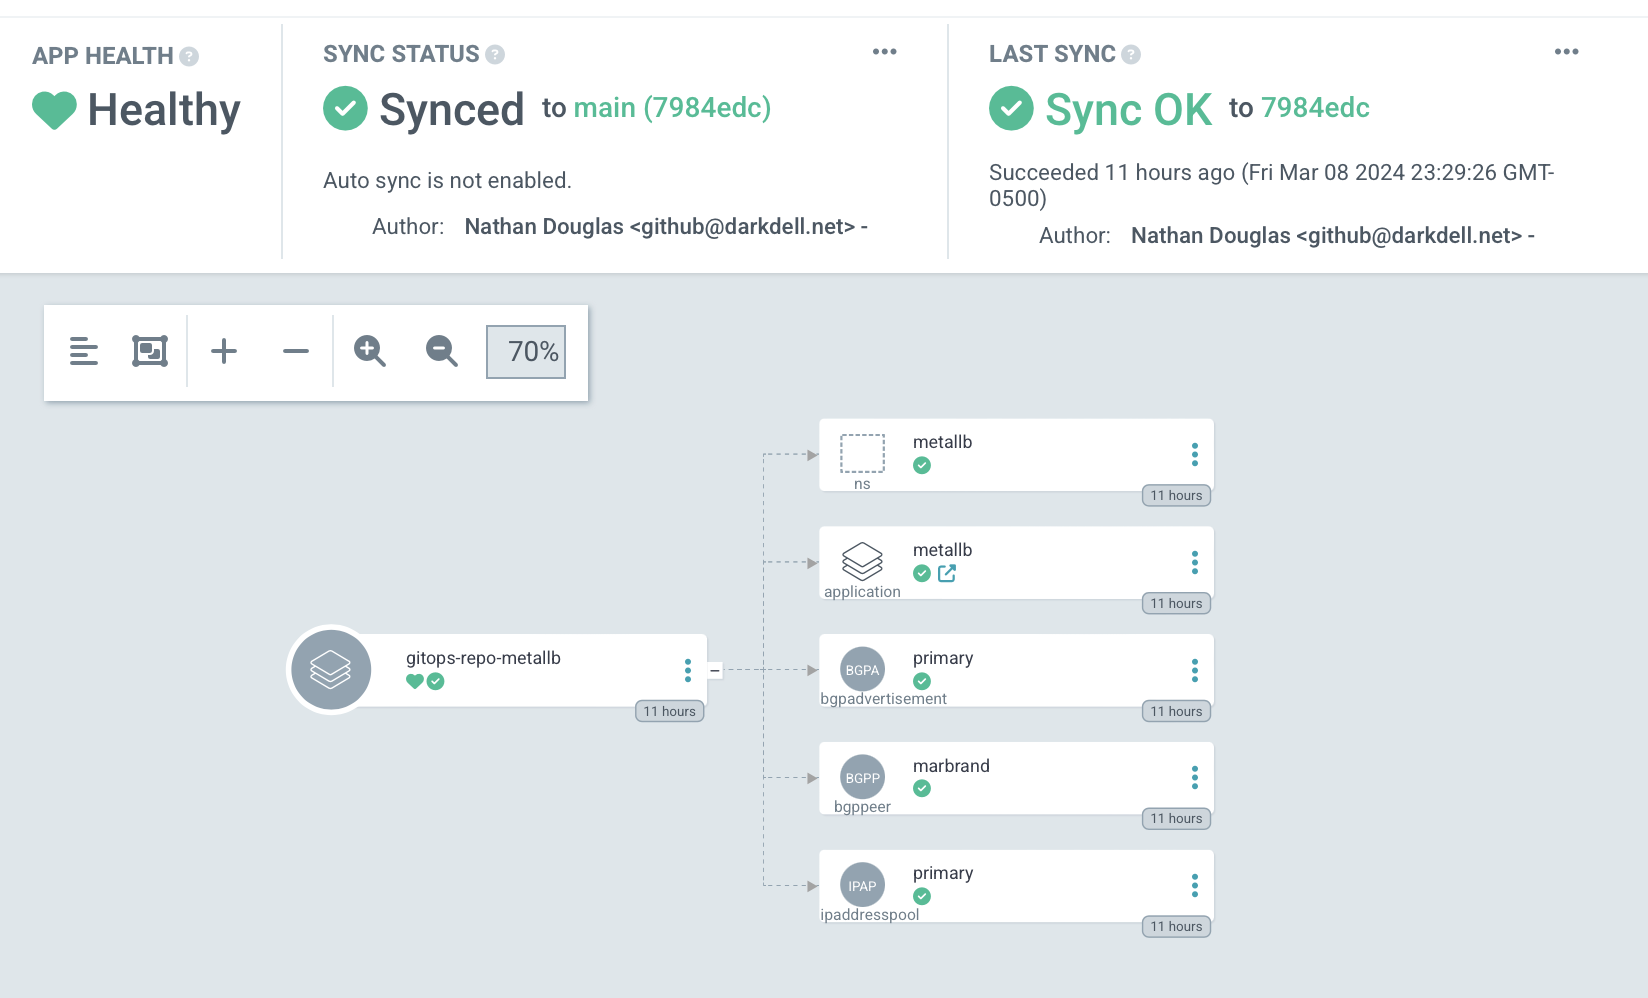
So we see the resources we created previously for the BGPPeer, IPAddressPool, and BGPAdvertisement. We also see an Application, metallb, which we can also see in the general Applications overview in Argo CD:
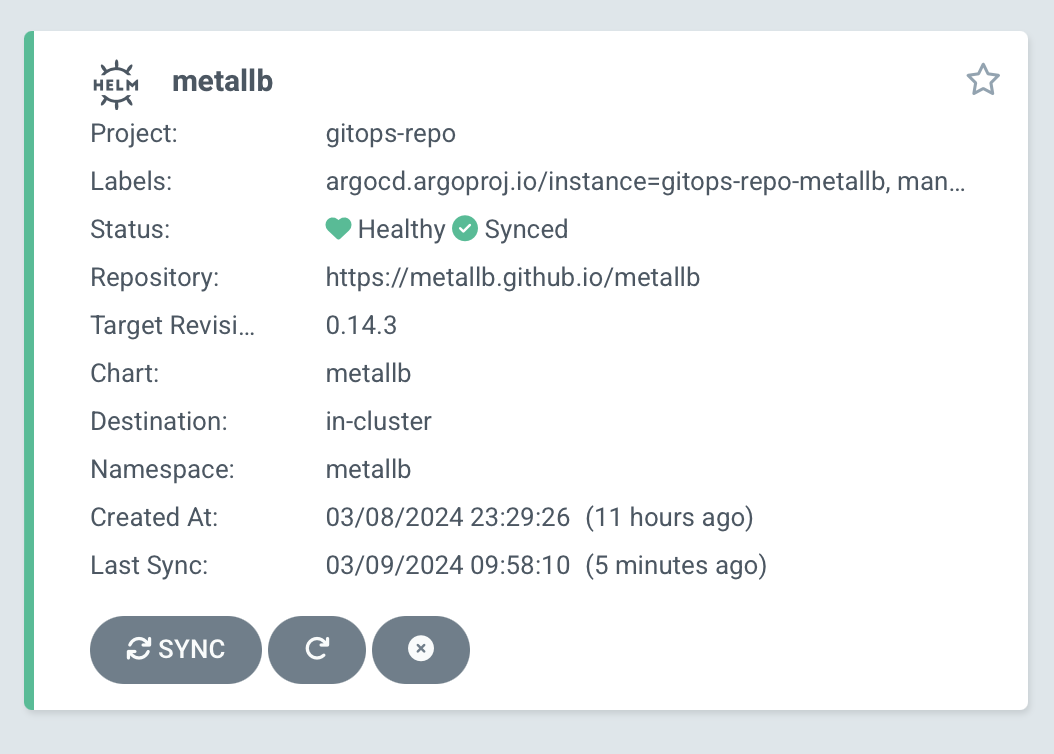
Clicking into it, we'll see all of the resources deployed by the metallb Helm chart we referenced.
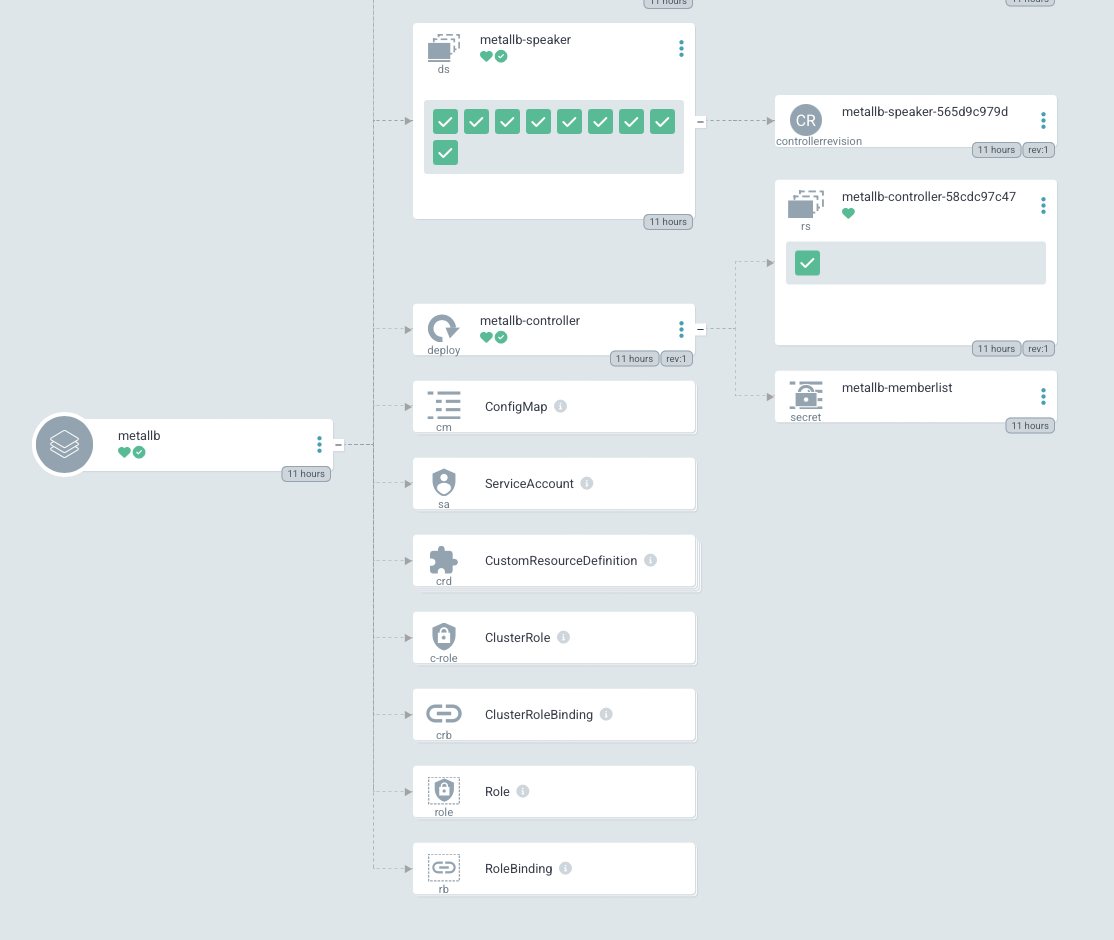
A quick test to verify that our httpbin application is still assigned a working load balancer, and we can declare victory!
While I'm here, I might as well shift httpbin and prometheus-node-exporter as well...
Giving Argo CD a Load Balancer
All this time, the Argo CD server has been operating with a ClusterIP service, and I've been manually port forwarding it via kubectl to be able to show all of these beautiful screenshots of the web UI.
That's annoying and we don't have to do it anymore. Fortunately, it's very easy to change this now; all we need to do is modify the Helm release values slightly; change server.service.type from 'ClusterIP' to 'LoadBalancer' and redeploy. A few minutes later, we can access Argo CD via http://10.4.11.1, no port forwarding required.
ExternalDNS
The workflow for accessing our LoadBalancer services ain't great.
If we deploy a new application, we need to run kubectl -n <namespace> get svc and read through a list to determine the IP address on which it's exposed. And that's not going to be stable; there's nothing at all guaranteeing that Argo CD will always be available at http://10.4.11.1.
Enter ExternalDNS. The idea is that we annotate our services with external-dns.alpha.kubernetes.io/hostname: "argocd.my-cluster.my-domain.com" and a DNS record will be created pointing to the actual IP address of the LoadBalancer service.
This is comparatively straightforward to configure if you host your DNS in one of the supported services. I host mine via AWS Route53, which is supported.
The complication is that we don't yet have a great way of managing secrets, so there's a manual step here that I find unpleasant, but we'll cross that bridge when we get to it.
Architecture Overview
ExternalDNS creates a bridge between Kubernetes services and external DNS providers, enabling automatic DNS record management:
DNS Infrastructure
- Primary Domain:
goldentooth.netmanaged in AWS Route53 - Zone ID:
Z0736727S7ZH91VKK44A(defined in Terraform) - Cluster Subdomain: Services automatically get
<service>.goldentooth.net - TTL Configuration: Default 60 seconds for rapid updates during development
Integration Points
- MetalLB: Provides LoadBalancer IPs from pool
10.4.11.0/24 - Route53: AWS DNS service for public domain management
- Argo CD: GitOps deployment and lifecycle management
- Terraform: Infrastructure-as-code for Route53 zone and ACM certificates
Helm Chart Configuration
Because of work we've done previously with Argo CD, we can just create a new repository to deploy ExternalDNS within our cluster.
The ExternalDNS deployment is managed through a custom Helm chart with comprehensive configuration:
Chart Structure (Chart.yaml)
apiVersion: v2
name: external-dns
description: ExternalDNS for automatic DNS record management
type: application
version: 0.0.1
appVersion: "v0.14.2"
Values Configuration (values.yaml)
metadata:
  namespace: external-dns
  name: external-dns
  projectName: gitops-repo

spec:
  domainFilter: goldentooth.net
  version: v0.14.2
This configuration provides:
- Namespace isolation: Dedicated
external-dnsnamespace - GitOps integration: Part of the
gitops-repoproject for Argo CD - Domain scoping: Only manages records for
goldentooth.net - Version pinning: Uses ExternalDNS v0.14.2 for stability
Deployment Architecture
Core Deployment Configuration
This has the following manifests:
Deployment: The deployment has several interesting features:
apiVersion: apps/v1
kind: Deployment
metadata:
  name: external-dns
  namespace: external-dns
spec:
  selector:
    matchLabels:
      app: external-dns
  template:
    metadata:
      labels:
        app: external-dns
    spec:
      containers:
      - name: external-dns
        image: registry.k8s.io/external-dns/external-dns:v0.14.2
        args:
        - --source=service
        - --domain-filter=goldentooth.net
        - --provider=aws
        - --aws-zone-type=public
        - --registry=txt
        - --txt-owner-id=external-dns-external-dns
        - --log-level=debug
        - --aws-region=us-east-1
        env:
        - name: AWS_SHARED_CREDENTIALS_FILE
          value: /.aws/credentials
        volumeMounts:
        - name: aws-credentials
          mountPath: /.aws
          readOnly: true
      volumes:
      - name: aws-credentials
        secret:
          secretName: external-dns
Key Configuration Parameters:
- Provider:
awsfor Route53 integration - Sources:
service(monitors Kubernetes LoadBalancer services) - Domain Filter:
goldentooth.net(restricts DNS management scope) - AWS Zone Type:
public(only manages public DNS records) - Registry:
txt(uses TXT records for ownership tracking) - Owner ID:
external-dns-external-dns(namespace-app format) - Region:
us-east-1(AWS region for Route53 operations)
AWS Credentials Management
Secret Configuration:
apiVersion: v1
kind: Secret
metadata:
  name: external-dns
  namespace: external-dns
type: Opaque
data:
  credentials: |
    [default]
    aws_access_key_id = {{ secret_vault.aws.access_key_id | b64encode }}
    aws_secret_access_key = {{ secret_vault.aws.secret_access_key | b64encode }}
This setup:
- Secure storage: AWS credentials stored in Ansible vault
- Minimal permissions: IAM user with only Route53 zone modification rights
- File-based auth: Uses AWS credentials file format for compatibility
- Namespace isolation: Secret accessible only within
external-dnsnamespace
RBAC Configuration
ServiceAccount: Just adds a service account for ExternalDNS.
apiVersion: v1
kind: ServiceAccount
metadata:
  name: external-dns
  namespace: external-dns
ClusterRole: Describes an ability to observe changes in services.
apiVersion: rbac.authorization.k8s.io/v1
kind: ClusterRole
metadata:
  name: external-dns
rules:
- apiGroups: [""]
  resources: ["services", "endpoints", "pods", "nodes"]
  verbs: ["get", "watch", "list"]
- apiGroups: ["extensions", "networking.k8s.io"]
  resources: ["ingresses"]
  verbs: ["get", "watch", "list"]
ClusterRoleBinding: Binds the above cluster role and ExternalDNS.
apiVersion: rbac.authorization.k8s.io/v1
kind: ClusterRoleBinding
metadata:
  name: external-dns-viewer
roleRef:
  apiGroup: rbac.authorization.k8s.io
  kind: ClusterRole
  name: external-dns
subjects:
- kind: ServiceAccount
  name: external-dns
  namespace: external-dns
Permission Scope:
- Read-only access: ExternalDNS cannot modify Kubernetes resources
- Cluster-wide monitoring: Can watch services across all namespaces
- Resource types: Services, endpoints, pods, nodes, and ingresses
- Security principle: Least privilege for DNS management operations
Service Annotation Patterns
Basic DNS Record Creation
Services use annotations to trigger DNS record creation:
apiVersion: v1
kind: Service
metadata:
  name: httpbin
  namespace: httpbin
  annotations:
    external-dns.alpha.kubernetes.io/hostname: httpbin.goldentooth.net
    external-dns.alpha.kubernetes.io/ttl: "60"
spec:
  type: LoadBalancer
  ports:
  - port: 80
    targetPort: 8080
  selector:
    app: httpbin
Annotation Functions:
- Hostname:
external-dns.alpha.kubernetes.io/hostnamespecifies the FQDN - TTL:
external-dns.alpha.kubernetes.io/ttlsets DNS record time-to-live - Automatic A record: Points to MetalLB-allocated LoadBalancer IP
- Automatic TXT record: Ownership tracking with txt-owner-id
Advanced Annotation Options
annotations:
  # Multiple hostnames for the same service
  external-dns.alpha.kubernetes.io/hostname: "app.goldentooth.net,api.goldentooth.net"

  # Custom TTL for caching strategy
  external-dns.alpha.kubernetes.io/ttl: "300"

  # AWS-specific: Route53 weighted routing
  external-dns.alpha.kubernetes.io/aws-weight: "100"

  # AWS-specific: Health check configuration
  external-dns.alpha.kubernetes.io/aws-health-check-id: "12345678-1234-1234-1234-123456789012"
DNS Record Lifecycle Management
Record Creation Process
- Service Creation: LoadBalancer service deployed with ExternalDNS annotations
- IP Allocation: MetalLB assigns IP from configured pool (
10.4.11.0/24) - Service Discovery: ExternalDNS watches Kubernetes API for service changes
- DNS Creation: Creates A record pointing to LoadBalancer IP
- Ownership Tracking: Creates TXT record for ownership verification
Record Cleanup Process
- Service Deletion: LoadBalancer service removed from cluster
- Change Detection: ExternalDNS detects service removal event
- Ownership Verification: Checks TXT record ownership before deletion
- DNS Cleanup: Removes both A and TXT records from Route53
- IP Release: MetalLB returns IP to available pool
TXT Record Ownership System
ExternalDNS uses TXT records for safe multi-cluster DNS management:
# Example TXT record for ownership tracking
dig TXT httpbin.goldentooth.net

# Response includes:
# httpbin.goldentooth.net. 60 IN TXT "heritage=external-dns,external-dns/owner=external-dns-external-dns"
This prevents:
- Record conflicts: Multiple ExternalDNS instances managing same domain
- Accidental deletion: Only owner can modify/delete records
- Split-brain scenarios: Clear ownership prevents conflicting updates
Integration with GitOps
Argo CD Application Configuration
ExternalDNS is deployed via GitOps using the ApplicationSet pattern:
apiVersion: argoproj.io/v1alpha1
kind: ApplicationSet
metadata:
  name: gitops-repo
  namespace: argocd
spec:
  generators:
  - scmProvider:
      github:
        organization: goldentooth
        allBranches: false
        labelSelector:
          matchLabels:
            gitops-repo: "true"
  template:
    metadata:
      name: '{{repository}}'
    spec:
      project: gitops-repo
      source:
        repoURL: '{{url}}'
        targetRevision: '{{branch}}'
        path: .
      destination:
        server: https://kubernetes.default.svc
        namespace: '{{repository}}'
      syncPolicy:
        automated:
          prune: true
          selfHeal: true
        syncOptions:
        - CreateNamespace=true
This provides:
- Automatic deployment: Changes to external-dns repository trigger redeployment
- Namespace creation: Automatically creates
external-dnsnamespace - Self-healing: Argo CD corrects configuration drift
- Pruning: Removes resources deleted from Git repository
Repository Structure
external-dns/
├── Chart.yaml          # Helm chart metadata
├── values.yaml         # Configuration values
└── templates/
    ├── Deployment.yaml  # ExternalDNS deployment
    ├── ServiceAccount.yaml
    ├── ClusterRole.yaml
    ├── ClusterRoleBinding.yaml
    └── Secret.yaml      # AWS credentials (Ansible-templated)
Monitoring and Troubleshooting
Health Verification
# Check ExternalDNS pod status
kubectl -n external-dns get pods

# Monitor ExternalDNS logs
kubectl -n external-dns logs -l app=external-dns --tail=50

# Verify AWS credentials
kubectl -n external-dns exec deployment/external-dns -- cat /.aws/credentials

# Check service discovery
kubectl -n external-dns logs deployment/external-dns | grep "Creating record"
DNS Record Validation
# Verify A record creation
dig A httpbin.goldentooth.net

# Check TXT record ownership
dig TXT httpbin.goldentooth.net

# Validate Route53 changes
aws route53 list-resource-record-sets --hosted-zone-id Z0736727S7ZH91VKK44A | jq '.ResourceRecordSets[] | select(.Name | contains("httpbin"))'
Common Issues and Solutions
Issue: DNS records not created
- Check: Service has
type: LoadBalancerand LoadBalancer IP is assigned - Verify: ExternalDNS has RBAC permissions to read services
- Debug: Check ExternalDNS logs for AWS API errors
Issue: DNS records not cleaned up
- Check: TXT record ownership matches ExternalDNS txt-owner-id
- Verify: AWS credentials have Route53 delete permissions
- Debug: Monitor ExternalDNS logs during service deletion
Issue: Multiple DNS entries for same service
- Check: Only one ExternalDNS instance should manage each domain
- Verify: txt-owner-id is unique across clusters
- Fix: Use different owner IDs for different environments
Integration Examples
Argo CD Access
A few minutes after pushing changes to the repository, we can reach Argo CD via https://argocd.goldentooth.net/.
Service Configuration:
apiVersion: v1
kind: Service
metadata:
  name: argocd-server
  namespace: argocd
  annotations:
    external-dns.alpha.kubernetes.io/hostname: argocd.goldentooth.net
    external-dns.alpha.kubernetes.io/ttl: "60"
spec:
  type: LoadBalancer
  ports:
  - port: 443
    targetPort: 8080
    protocol: TCP
    name: https
  selector:
    app.kubernetes.io/component: server
    app.kubernetes.io/name: argocd-server
This automatically creates:
- A record:
argocd.goldentooth.net → 10.4.11.1(MetalLB-assigned IP) - TXT record: Ownership tracking for safe management
- 60-second TTL: Rapid DNS propagation for development workflows
The combination of MetalLB for LoadBalancer IP allocation and ExternalDNS for automatic DNS management creates a seamless experience where services become accessible via friendly DNS names without manual intervention, enabling true infrastructure-as-code patterns for both networking and DNS.
Killing the Incubator
At this point, given the ease of spinning up new applications with the gitops-repo ApplicationSet, there's really not much benefit to the Incubator app-of-apps repo.
I'd also added a way of easily spinning up generic projects, but I don't think that's necessary either. The ApplicationSet approach is really pretty powerful 🙂
Welcome Back
So, uh, it's been a while. Things got busy and I didn't really touch the cluster for a while, and now I'm interested in it again and of course have completely forgotten everything about it.
I also ditched my OPNsense firewall because I felt it was probably costing too much power and replaced with with a simpler Unifi device, which is great but I just realized that I now have to reconfigure MetalLB to use Layer 2 instead of BGP. I probably should've used Layer 2 from the beginning, but I thought BGP would make me look a little cooler. So no load balancer integration is working right now on the cluster, which means I can't easily check in on ArgoCD. But that's fine, that's not really my highest priority.
Also, I have some new interests; I've gotten into HPC and MLOps, and some of the people I'm interested in working with use Nomad, which I've used for a couple of throwaway play projects but never on an ongoing basis. So I'm going to set up Slurm and Nomad and probably some other things. Should be fun and teach me a good amount. Of course, that's moving away from Kubernetes, but I figure I'll keep the name of this blog the same because frankly I just don't have any interest in renaming it.
First, though, I need to make sure the cluster itself is up to snuff.
Now, even I remember that I have a little Bash tool to ease administering the cluster. And because I know me, it has online help:
$ goldentooth
Usage: goldentooth <subcommand> [arguments...]

Subcommands:
            autocomplete Enable bash autocompletion.
                 install Install Ansible dependencies.
                    lint Lint all roles.
                    ping Ping all hosts.
                  uptime Get uptime for all hosts.
                 command Run an arbitrary command on all hosts.
              edit_vault Edit the vault.
        ansible_playbook Run a specified Ansible playbook.
                   usage Display usage information.
           bootstrap_k8s Bootstrap Kubernetes cluster with kubeadm.
                 cleanup Perform various cleanup tasks.
       configure_cluster Configure the hosts in the cluster.
          install_argocd Install Argo CD on Kubernetes cluster.
     install_argocd_apps Install Argo CD applications.
            install_helm Install Helm on Kubernetes cluster.
    install_k8s_packages Install Kubernetes packages.
               reset_k8s Reset Kubernetes cluster with kubeadm.
     setup_load_balancer Setup the load balancer.
                shutdown Cleanly shut down the hosts in the cluster.
  uninstall_k8s_packages Uninstall Kubernetes packages.
so I can ping all of the nodes:
$ goldentooth ping
allyrion | SUCCESS => {
    "changed": false,
    "ping": "pong"
}
gardener | SUCCESS => {
    "changed": false,
    "ping": "pong"
}
inchfield | SUCCESS => {
    "changed": false,
    "ping": "pong"
}
cargyll | SUCCESS => {
    "changed": false,
    "ping": "pong"
}
erenford | SUCCESS => {
    "changed": false,
    "ping": "pong"
}
dalt | SUCCESS => {
    "changed": false,
    "ping": "pong"
}
bettley | SUCCESS => {
    "changed": false,
    "ping": "pong"
}
jast | SUCCESS => {
    "changed": false,
    "ping": "pong"
}
harlton | SUCCESS => {
    "changed": false,
    "ping": "pong"
}
fenn | SUCCESS => {
    "changed": false,
    "ping": "pong"
}
and... yes, that's all of them. Okay, that's a good sign.
And then I can get their uptime:
$ goldentooth uptime
gardener | CHANGED | rc=0 >>
 19:26:23 up 17 days,  4:48,  0 user,  load average: 0.13, 0.17, 0.14
allyrion | CHANGED | rc=0 >>
 19:26:23 up 17 days,  4:49,  0 user,  load average: 0.10, 0.06, 0.01
inchfield | CHANGED | rc=0 >>
 19:26:23 up 17 days,  4:47,  0 user,  load average: 0.25, 0.59, 0.60
erenford | CHANGED | rc=0 >>
 19:26:23 up 17 days,  4:48,  0 user,  load average: 0.08, 0.15, 0.12
jast | CHANGED | rc=0 >>
 19:26:23 up 17 days,  4:47,  0 user,  load average: 0.11, 0.19, 0.27
dalt | CHANGED | rc=0 >>
 19:26:23 up 17 days,  4:49,  0 user,  load average: 0.84, 0.64, 0.59
fenn | CHANGED | rc=0 >>
 19:26:23 up 17 days,  4:48,  0 user,  load average: 0.27, 0.34, 0.23
harlton | CHANGED | rc=0 >>
 19:26:23 up 17 days,  4:48,  0 user,  load average: 0.27, 0.14, 0.20
bettley | CHANGED | rc=0 >>
 19:26:23 up 17 days,  4:49,  0 user,  load average: 0.41, 0.49, 0.81
cargyll | CHANGED | rc=0 >>
 19:26:23 up 17 days,  4:49,  0 user,  load average: 0.26, 0.42, 0.64
17 days, which is about when I set up the new router and had to reorganize a lot of my network. Seems legit. So it looks like the power supplies are still fine. When I first set up the cluster, I think there was a flaky USB cable on one of the Pis, so it would occasionally drop off. I'd prefer to control my chaos engineering, not have it arise spontaneously from my poor QC, thank you very much.
My first node just runs HAProxy (currently) and is the simplest, so I'm going to check and see what needs to be updated. Nobody cares about apt stuff so I'll skip the details.
TL;DR: It wasn't that much, really, though it does appear that I had some files in /etc/modprobe.d that should've been in /etc/modules-load.d. I blame... someone else.
So I'll update all of the nodes, hope they rejoin the cluster when they reboot, and in the next entry I'll try to update Kubernetes...
NFS Exports
Just kidding, I'm going to set up a USB thumb drive and NFS exports on Allyrion (my load balancer node).
The thumbdrive is just a Sandisk 64GB. Should be enough to do some fun stuff. fdisk it (hey, I remember the commands!), mkfs.ext4 it, get the UUID, add it to /etc/fstab (not "f-stab", "fs-tab"), and we have a bright shiny new volume.
NFS Server Implementation
NFS isn't hard to set up, but I'm going to use Jeff's ansible-role-nfs for consistency and maintainability.
The implementation consists of two main components:
Server Configuration
The NFS server setup is managed through the setup_nfs_exports.yaml playbook, which performs these operations:
- Install NFS utilities on all nodes:
- name: 'Install NFS utilities.'
  hosts: 'all'
  remote_user: 'root'
  tasks:
    - name: 'Ensure NFS utilities are installed.'
      ansible.builtin.apt:
        name:
          - nfs-common
        state: present
- Configure NFS server on allyrion:
- name: 'Setup NFS exports.'
  hosts: 'nfs'
  remote_user: 'root'
  roles:
    - { role: 'geerlingguy.nfs' }
Export Configuration
The NFS export is configured through host variables in inventory/host_vars/allyrion.yaml:
nfs_exports:
- "/mnt/usb1 *(rw,sync,no_root_squash,no_subtree_check)"
This export configuration provides:
- Path:
/mnt/usb1- The USB thumb drive mount point - Access:
*- Allow access from any host within the cluster network - Permissions:
rw- Read-write access for all clients - Sync Policy:
sync- Synchronous writes (safer but slower than async) - Root Mapping:
no_root_squash- Allow root user from clients to maintain root privileges - Performance:
no_subtree_check- Disable subtree checking for better performance
Network Integration
The NFS server integrates with the cluster's network architecture:
Server Information:
- Host: allyrion (10.4.0.10)
- Role: Dual-purpose load balancer and NFS server
- Network: Infrastructure CIDR
10.4.0.0/20
Global NFS Configuration (in group_vars/all/vars.yaml):
nfs:
  server: "{{ groups['nfs_server'] | first}}"
  mounts:
    primary:
      share: "{{ hostvars[groups['nfs_server'] | first].ipv4_address }}:/mnt/usb1"
      mount: '/mnt/nfs'
      safe_name: 'mnt-nfs'
      type: 'nfs'
      options: {}
This configuration:
- Dynamically determines the NFS server from the
nfs_serverinventory group - Uses the server's IP address for robust connectivity
- Standardizes the client mount point as
/mnt/nfs - Provides a safe filesystem name for systemd units
Security Considerations
Internal Network Trust Model: The NFS configuration uses a simplified security model appropriate for an internal cluster:
- Open Access: The
*wildcard allows any host to mount the share - No Kerberos: Uses IP-based authentication rather than user-based
- Root Access:
no_root_squashenables administrative operations from clients - Network Boundary: Security relies on the trusted internal network (
10.4.0.0/20)
Storage Infrastructure
Physical Storage:
- Device: SanDisk 64GB USB thumb drive
- Filesystem: ext4 for reliability and broad compatibility
- Mount Point:
/mnt/usb1 - Persistence: Configured in
/etc/fstabusing UUID for reliability
Performance Characteristics:
- Capacity: 64GB available storage
- Access Pattern: Shared read-write across 13 cluster nodes
- Use Cases: Configuration files, shared data, cluster coordination
Verification and Testing
The NFS export can be verified using standard tools:
$ showmount -e allyrion
Exports list on allyrion:
/mnt/usb1                           *
This output confirms:
- The export is properly configured and accessible
- The path
/mnt/usb1is being served - Access is open to all hosts (
*)
Command Line Integration
The NFS setup integrates with the goldentooth CLI for consistent cluster management:
# Configure NFS server
goldentooth setup_nfs_exports

# Configure client mounts (covered in Chapter 031)
goldentooth setup_nfs_mounts

# Verify exports
goldentooth command allyrion 'showmount -e allyrion'
Future Evolution
Note: This represents the initial NFS implementation. The cluster later evolves to include more sophisticated storage with ZFS pools and replication (documented in Chapter 050), while maintaining compatibility with this foundational NFS export.
We'll return to this later and find out if it actually works when we configure the client mounts in the next section.
Kubernetes Updates
Because I'm not a particularly smart man, I've allowed my cluster to fall behind. The current version, as of today, is 1.32.3, and my cluster is on 1.29.something.
So that means I need to upgrade 1.29 -> 1.30, 1.30 -> 1.31, and 1.31 -> 1.32.
1.29 -> 1.30
First, I update the repo URL in /etc/apt/sources.list.d/kubernetes.sources and run:
$ sudo apt update
Hit:1 http://deb.debian.org/debian bookworm InRelease
Hit:2 http://deb.debian.org/debian-security bookworm-security InRelease
Hit:3 http://deb.debian.org/debian bookworm-updates InRelease
Hit:4 https://download.docker.com/linux/debian bookworm InRelease
Hit:6 http://archive.raspberrypi.com/debian bookworm InRelease
Hit:7 https://baltocdn.com/helm/stable/debian all InRelease
Get:5 https://prod-cdn.packages.k8s.io/repositories/isv:/kubernetes:/core:/stable:/v1.30/deb  InRelease [1,189 B]
Err:5 https://prod-cdn.packages.k8s.io/repositories/isv:/kubernetes:/core:/stable:/v1.30/deb  InRelease
  The following signatures were invalid: EXPKEYSIG 234654DA9A296436 isv:kubernetes OBS Project <isv:kubernetes@build.opensuse.org>
Reading package lists... Done
W: https://download.docker.com/linux/debian/dists/bookworm/InRelease: Key is stored in legacy trusted.gpg keyring (/etc/apt/trusted.gpg), see the DEPRECATION section in apt-key(8) for details.
W: GPG error: https://prod-cdn.packages.k8s.io/repositories/isv:/kubernetes:/core:/stable:/v1.30/deb  InRelease: The following signatures were invalid: EXPKEYSIG 234654DA9A296436 isv:kubernetes OBS Project <isv:kubernetes@build.opensuse.org>
E: The repository 'https://pkgs.k8s.io/core:/stable:/v1.30/deb  InRelease' is not signed.
N: Updating from such a repository can't be done securely, and is therefore disabled by default.
N: See apt-secure(8) manpage for repository creation and user configuration details.
Well, shit. Looks like I need to do some surgery elsewhere.
Fortunately, I had some code for setting up the Kubernetes package repositories in install_k8s_packages. Of course, I don't want to install new versions of the packages – the upgrade process is a little more delicate than that – so I factored it out into a new role called setup_k8s_apt. Running that role against my cluster with goldentooth setup_k8s_apt made the necessary changes.
$ sudo apt-cache madison kubeadm
   kubeadm | 1.30.11-1.1 | https://pkgs.k8s.io/core:/stable:/v1.30/deb  Packages
   kubeadm | 1.30.10-1.1 | https://pkgs.k8s.io/core:/stable:/v1.30/deb  Packages
   kubeadm | 1.30.9-1.1 | https://pkgs.k8s.io/core:/stable:/v1.30/deb  Packages
   kubeadm | 1.30.8-1.1 | https://pkgs.k8s.io/core:/stable:/v1.30/deb  Packages
   kubeadm | 1.30.7-1.1 | https://pkgs.k8s.io/core:/stable:/v1.30/deb  Packages
   kubeadm | 1.30.6-1.1 | https://pkgs.k8s.io/core:/stable:/v1.30/deb  Packages
   kubeadm | 1.30.5-1.1 | https://pkgs.k8s.io/core:/stable:/v1.30/deb  Packages
   kubeadm | 1.30.4-1.1 | https://pkgs.k8s.io/core:/stable:/v1.30/deb  Packages
   kubeadm | 1.30.3-1.1 | https://pkgs.k8s.io/core:/stable:/v1.30/deb  Packages
   kubeadm | 1.30.2-1.1 | https://pkgs.k8s.io/core:/stable:/v1.30/deb  Packages
   kubeadm | 1.30.1-1.1 | https://pkgs.k8s.io/core:/stable:/v1.30/deb  Packages
   kubeadm | 1.30.0-1.1 | https://pkgs.k8s.io/core:/stable:/v1.30/deb  Packages
There we go. That wasn't that bad.
Now, the next steps are things I'm going to do repeatedly, and I don't want to type a bunch of commands, so I'm going to do it in Ansible. I need to do that advisedly, though.
I created a new role, goldentooth.upgrade_k8s. I'm working through the upgrade documentation, Ansible-izing it as I go.
So I added some tasks to update the Apt cache, unhold kubeadm, upgrade it, and then hold it again (via a handler). I tagged these with first_control_plane and invoke the role dynamically (because that is the only context in which you can limit execution of a role to the specified tags).
$ kubeadm version
kubeadm version: &version.Info{Major:"1", Minor:"30", GitVersion:"v1.30.11", GitCommit:"6a074997c960757de911780f250ecd9931917366", GitTreeState:"clean", BuildDate:"2025-03-11T19:56:25Z", GoVersion:"go1.23.6", Compiler:"gc", Platform:"linux/arm64"}
It worked!
The plan operation similarly looks fine.
$ sudo kubeadm upgrade plan
[preflight] Running pre-flight checks.
[upgrade/config] Reading configuration from the cluster...
[upgrade/config] FYI: You can look at this config file with 'kubectl -n kube-system get cm kubeadm-config -o yaml'
[upgrade] Running cluster health checks
[upgrade] Fetching available versions to upgrade to
[upgrade/versions] Cluster version: 1.29.6
[upgrade/versions] kubeadm version: v1.30.11
I0403 11:18:34.338987  564280 version.go:256] remote version is much newer: v1.32.3; falling back to: stable-1.30
[upgrade/versions] Target version: v1.30.11
[upgrade/versions] Latest version in the v1.29 series: v1.29.15

Components that must be upgraded manually after you have upgraded the control plane with 'kubeadm upgrade apply':
COMPONENT   NODE        CURRENT   TARGET
kubelet     bettley     v1.29.2   v1.29.15
kubelet     cargyll     v1.29.2   v1.29.15
kubelet     dalt        v1.29.2   v1.29.15
kubelet     erenford    v1.29.2   v1.29.15
kubelet     fenn        v1.29.2   v1.29.15
kubelet     gardener    v1.29.2   v1.29.15
kubelet     harlton     v1.29.2   v1.29.15
kubelet     inchfield   v1.29.2   v1.29.15
kubelet     jast        v1.29.2   v1.29.15

Upgrade to the latest version in the v1.29 series:

COMPONENT                 NODE      CURRENT    TARGET
kube-apiserver            bettley   v1.29.6    v1.29.15
kube-apiserver            cargyll   v1.29.6    v1.29.15
kube-apiserver            dalt      v1.29.6    v1.29.15
kube-controller-manager   bettley   v1.29.6    v1.29.15
kube-controller-manager   cargyll   v1.29.6    v1.29.15
kube-controller-manager   dalt      v1.29.6    v1.29.15
kube-scheduler            bettley   v1.29.6    v1.29.15
kube-scheduler            cargyll   v1.29.6    v1.29.15
kube-scheduler            dalt      v1.29.6    v1.29.15
kube-proxy                          1.29.6     v1.29.15
CoreDNS                             v1.11.1    v1.11.3
etcd                      bettley   3.5.10-0   3.5.15-0
etcd                      cargyll   3.5.10-0   3.5.15-0
etcd                      dalt      3.5.10-0   3.5.15-0

You can now apply the upgrade by executing the following command:

	kubeadm upgrade apply v1.29.15

_____________________________________________________________________

Components that must be upgraded manually after you have upgraded the control plane with 'kubeadm upgrade apply':
COMPONENT   NODE        CURRENT   TARGET
kubelet     bettley     v1.29.2   v1.30.11
kubelet     cargyll     v1.29.2   v1.30.11
kubelet     dalt        v1.29.2   v1.30.11
kubelet     erenford    v1.29.2   v1.30.11
kubelet     fenn        v1.29.2   v1.30.11
kubelet     gardener    v1.29.2   v1.30.11
kubelet     harlton     v1.29.2   v1.30.11
kubelet     inchfield   v1.29.2   v1.30.11
kubelet     jast        v1.29.2   v1.30.11

Upgrade to the latest stable version:

COMPONENT                 NODE      CURRENT    TARGET
kube-apiserver            bettley   v1.29.6    v1.30.11
kube-apiserver            cargyll   v1.29.6    v1.30.11
kube-apiserver            dalt      v1.29.6    v1.30.11
kube-controller-manager   bettley   v1.29.6    v1.30.11
kube-controller-manager   cargyll   v1.29.6    v1.30.11
kube-controller-manager   dalt      v1.29.6    v1.30.11
kube-scheduler            bettley   v1.29.6    v1.30.11
kube-scheduler            cargyll   v1.29.6    v1.30.11
kube-scheduler            dalt      v1.29.6    v1.30.11
kube-proxy                          1.29.6     v1.30.11
CoreDNS                             v1.11.1    v1.11.3
etcd                      bettley   3.5.10-0   3.5.15-0
etcd                      cargyll   3.5.10-0   3.5.15-0
etcd                      dalt      3.5.10-0   3.5.15-0

You can now apply the upgrade by executing the following command:

	kubeadm upgrade apply v1.30.11

_____________________________________________________________________


The table below shows the current state of component configs as understood by this version of kubeadm.
Configs that have a "yes" mark in the "MANUAL UPGRADE REQUIRED" column require manual config upgrade or
resetting to kubeadm defaults before a successful upgrade can be performed. The version to manually
upgrade to is denoted in the "PREFERRED VERSION" column.

API GROUP                 CURRENT VERSION   PREFERRED VERSION   MANUAL UPGRADE REQUIRED
kubeproxy.config.k8s.io   v1alpha1          v1alpha1            no
kubelet.config.k8s.io     v1beta1           v1beta1             no
_____________________________________________________________________
Of course, I won't automate the actual upgrade process; that seems unwise.
I'm skipping certificate renewal because I'd like to fight with one thing at a time.
$ sudo kubeadm upgrade apply v1.30.11 --certificate-renewal=false
[preflight] Running pre-flight checks.
[upgrade/config] Reading configuration from the cluster...
[upgrade/config] FYI: You can look at this config file with 'kubectl -n kube-system get cm kubeadm-config -o yaml'
[upgrade] Running cluster health checks
[upgrade/version] You have chosen to change the cluster version to "v1.30.11"
[upgrade/versions] Cluster version: v1.29.6
[upgrade/versions] kubeadm version: v1.30.11
[upgrade] Are you sure you want to proceed? [y/N]: y
[upgrade/prepull] Pulling images required for setting up a Kubernetes cluster
[upgrade/prepull] This might take a minute or two, depending on the speed of your internet connection
[upgrade/prepull] You can also perform this action in beforehand using 'kubeadm config images pull'
W0403 11:23:42.086815  566901 checks.go:844] detected that the sandbox image "registry.k8s.io/pause:3.8" of the container runtime is inconsistent with that used by kubeadm.It is recommended to use "registry.k8s.io/pause:3.9" as the CRI sandbox image.
[upgrade/apply] Upgrading your Static Pod-hosted control plane to version "v1.30.11" (timeout: 5m0s)...
[upgrade/etcd] Upgrading to TLS for etcd
[upgrade/staticpods] Preparing for "etcd" upgrade
[upgrade/staticpods] Moved new manifest to "/etc/kubernetes/manifests/etcd.yaml" and backed up old manifest to "/etc/kubernetes/tmp/kubeadm-backup-manifests-2025-04-03-11-25-50/etcd.yaml"
[upgrade/staticpods] Waiting for the kubelet to restart the component
[upgrade/staticpods] This can take up to 5m0s
[apiclient] Found 3 Pods for label selector component=etcd
[upgrade/staticpods] Component "etcd" upgraded successfully!
[upgrade/etcd] Waiting for etcd to become available
[upgrade/staticpods] Writing new Static Pod manifests to "/etc/kubernetes/tmp/kubeadm-upgraded-manifests1796562509"
[upgrade/staticpods] Preparing for "kube-apiserver" upgrade
[upgrade/staticpods] Moved new manifest to "/etc/kubernetes/manifests/kube-apiserver.yaml" and backed up old manifest to "/etc/kubernetes/tmp/kubeadm-backup-manifests-2025-04-03-11-25-50/kube-apiserver.yaml"
[upgrade/staticpods] Waiting for the kubelet to restart the component
[upgrade/staticpods] This can take up to 5m0s
[apiclient] Found 3 Pods for label selector component=kube-apiserver
[upgrade/staticpods] Component "kube-apiserver" upgraded successfully!
[upgrade/staticpods] Preparing for "kube-controller-manager" upgrade
[upgrade/staticpods] Moved new manifest to "/etc/kubernetes/manifests/kube-controller-manager.yaml" and backed up old manifest to "/etc/kubernetes/tmp/kubeadm-backup-manifests-2025-04-03-11-25-50/kube-controller-manager.yaml"
[upgrade/staticpods] Waiting for the kubelet to restart the component
[upgrade/staticpods] This can take up to 5m0s
[apiclient] Found 3 Pods for label selector component=kube-controller-manager
[upgrade/staticpods] Component "kube-controller-manager" upgraded successfully!
[upgrade/staticpods] Preparing for "kube-scheduler" upgrade
[upgrade/staticpods] Moved new manifest to "/etc/kubernetes/manifests/kube-scheduler.yaml" and backed up old manifest to "/etc/kubernetes/tmp/kubeadm-backup-manifests-2025-04-03-11-25-50/kube-scheduler.yaml"
[upgrade/staticpods] Waiting for the kubelet to restart the component
[upgrade/staticpods] This can take up to 5m0s
[apiclient] Found 3 Pods for label selector component=kube-scheduler
[upgrade/staticpods] Component "kube-scheduler" upgraded successfully!
[upload-config] Storing the configuration used in ConfigMap "kubeadm-config" in the "kube-system" Namespace
[kubelet] Creating a ConfigMap "kubelet-config" in namespace kube-system with the configuration for the kubelets in the cluster
[upgrade] Backing up kubelet config file to /etc/kubernetes/tmp/kubeadm-kubelet-config2173844632/config.yaml
[kubelet-start] Writing kubelet configuration to file "/var/lib/kubelet/config.yaml"
[bootstrap-token] Configured RBAC rules to allow Node Bootstrap tokens to get nodes
[bootstrap-token] Configured RBAC rules to allow Node Bootstrap tokens to post CSRs in order for nodes to get long term certificate credentials
[bootstrap-token] Configured RBAC rules to allow the csrapprover controller automatically approve CSRs from a Node Bootstrap Token
[bootstrap-token] Configured RBAC rules to allow certificate rotation for all node client certificates in the cluster
[upgrade/addons] skip upgrade addons because control plane instances [cargyll dalt] have not been upgraded

[upgrade/successful] SUCCESS! Your cluster was upgraded to "v1.30.11". Enjoy!

[upgrade/kubelet] Now that your control plane is upgraded, please proceed with upgrading your kubelets if you haven't already done so.
The next steps for the other two control plane nodes are fairly straightforward. This mostly just consisted of duplicating the playbook block to add a new step for when the playbook is executed with the 'other_control_plane' tag and adding that tag to the steps already added in the setup_k8s role.
$ goldentooth command cargyll,dalt 'sudo kubeadm upgrade node'
And a few minutes later, both of the remaining control plane nodes have updated.
The next step is to upgrade the kubelet in each node.
Serially, for obvious reasons, we need to drain each node (from a control plane node), upgrade the kubelet (unhold, upgrade, hold), then uncordon the node (again, from a control plane node).
That's not too bad, and it's included in the latest changes to the upgrade_k8s role.
The final step is upgrading kubectl on each of the control plane nodes, which is a comparative cakewalk.
$ sudo kubectl version
Client Version: v1.30.11
Kustomize Version: v5.0.4-0.20230601165947-6ce0bf390ce3
Server Version: v1.30.11
Nice!
1.30 -> 1.31
Now that the Ansible playbook and role are fleshed out, the process moving forward is comparatively simple.
- Change the
k8s_version_cleanvariable to1.31. goldentooth setup_k8s_aptgoldentooth upgrade_k8s --tags=kubeadm_firstgoldentooth command bettley 'kubeadm version'goldentooth command bettley 'sudo kubeadm upgrade plan'goldentooth command bettley 'sudo kubeadm upgrade apply v1.31.7 --certificate-renewal=false -y'goldentooth upgrade_k8s --tags=kubeadm_restgoldentooth command cargyll,dalt 'sudo kubeadm upgrade node'goldentooth upgrade_k8s --tags=kubeletgoldentooth upgrade_k8s --tags=kubectl
1.31 -> 1.32
Hell, this is kinda fun now.
- Change the
k8s_version_cleanvariable to1.32. goldentooth setup_k8s_aptgoldentooth upgrade_k8s --tags=kubeadm_firstgoldentooth command bettley 'kubeadm version'goldentooth command bettley 'sudo kubeadm upgrade plan'goldentooth command bettley 'sudo kubeadm upgrade apply v1.32.3 --certificate-renewal=false -y'goldentooth upgrade_k8s --tags=kubeadm_restgoldentooth command cargyll,dalt 'sudo kubeadm upgrade node'goldentooth upgrade_k8s --tags=kubeletgoldentooth upgrade_k8s --tags=kubectl
And eventually, everything is fine:
$ sudo kubectl get nodes
NAME        STATUS   ROLES           AGE    VERSION
bettley     Ready    control-plane   286d   v1.32.3
cargyll     Ready    control-plane   286d   v1.32.3
dalt        Ready    control-plane   286d   v1.32.3
erenford    Ready    <none>          286d   v1.32.3
fenn        Ready    <none>          286d   v1.32.3
gardener    Ready    <none>          286d   v1.32.3
harlton     Ready    <none>          286d   v1.32.3
inchfield   Ready    <none>          286d   v1.32.3
jast        Ready    <none>          286d   v1.32.3
Fixing MetalLB
As mentioned here, I purchased a new router to replace a power-hungry Dell server running OPNsense, and that cost me BGP support. This kills my MetalLB configuration, so I need to switch it to use Layer 2.
This transition represents a fundamental change in how MetalLB operates and requires understanding the trade-offs between BGP and Layer 2 modes.
BGP vs Layer 2 Architecture Comparison
BGP Mode (Previous Configuration)
- Dynamic routing: BGP speakers advertise LoadBalancer IPs to upstream routers
- True load balancing: Multiple nodes can announce the same service IP with ECMP
- Scalability: Router handles load distribution and failover automatically
- Network integration: Works with enterprise routing infrastructure
- Requirements: Router must support BGP (FRR, Quagga, hardware routers)
Layer 2 Mode (New Configuration)
- ARP announcements: Nodes respond to ARP requests for LoadBalancer IPs
- Active/passive failover: Only one node answers ARP for each service IP
- Simpler setup: No routing protocol configuration required
- Limited scalability: All traffic for a service goes through single node
- Requirements: Nodes must be on same Layer 2 network segment
Hardware Infrastructure Change
The transition was necessitated by hardware changes:
Previous Setup:
- Dell server: Power-hungry (likely PowerEdge) running OPNsense
- BGP support: FRR (Free Range Routing) plugin provided full BGP implementation
- Power consumption: High power draw from server-class hardware
- Complexity: Full routing stack with BGP, OSPF, and other protocols
New Setup:
- Consumer router: Lower power consumption
- No BGP support: Consumer-grade firmware lacks routing protocol support
- Simplified networking: Standard static routing and NAT
- Cost efficiency: Reduced power costs and hardware complexity
Migration Process
The migration involved several coordinated steps to minimize service disruption:
Step 1: Remove BGP Configuration
That shouldn't be too bad.
I think it's just a matter of deleting the BGP advertisement:
$ sudo kubectl -n metallb delete BGPAdvertisement primary
bgpadvertisement.metallb.io "primary" deleted
This command removes the BGP advertisement configuration, which:
- Stops route announcements: MetalLB speakers stop advertising LoadBalancer IPs via BGP
- Maintains IP allocation: Existing LoadBalancer services keep their assigned IPs
- Preserves connectivity: Services remain accessible until Layer 2 mode is configured
Step 2: Configure Layer 2 Advertisement
and creating an L2 advertisement:
$ cat tmp.yaml
apiVersion: metallb.io/v1beta1
kind: L2Advertisement
metadata:
  name: primary
  namespace: metallb

$ sudo kubectl apply -f tmp.yaml
l2advertisement.metallb.io/primary created
L2Advertisement Configuration Details:
apiVersion: metallb.io/v1beta1
kind: L2Advertisement
metadata:
  name: primary
  namespace: metallb
spec:
  ipAddressPools:
  - primary
  nodeSelectors:
  - matchLabels:
      kubernetes.io/hostname: "*"
  interfaces:
  - eth0
Key behaviors in Layer 2 mode:
- ARP responder: Nodes respond to ARP requests for LoadBalancer IPs
- Leader election: One node per service IP elected as ARP responder
- Gratuitous ARP: Leader sends gratuitous ARP to announce IP ownership
- Failover: New leader elected if current leader becomes unavailable
Step 3: Router Static Route Configuration
After adding the static route to my router, I can see the friendly go-httpbin response when I navigate to https://10.4.11.1/
Static Route Configuration:
# Router configuration (varies by model)
# Destination: 10.4.11.0/24 (MetalLB IP pool)
# Gateway: 10.4.0.X (any cluster node IP)
# Interface: LAN interface connected to cluster network
Why static routes are necessary:
- IP pool isolation: MetalLB pool (
10.4.11.0/24) is separate from cluster network (10.4.0.0/20) - Router awareness: Router needs to know how to reach LoadBalancer IPs
- Return path: Ensures bidirectional connectivity for external clients
Network Topology Changes
Layer 2 Network Requirements
Physical topology:
[Internet] → [Router] → [Switch] → [Cluster Nodes]
                ↓
         Static Route:
         10.4.11.0/24 → cluster
ARP behavior:
- Client request: External client sends packet to LoadBalancer IP
- Router forwarding: Router forwards based on static route to cluster network
- ARP resolution: Router/switch broadcasts ARP request for LoadBalancer IP
- Node response: MetalLB leader node responds with its MAC address
- Traffic delivery: Subsequent packets sent directly to leader node
Failover Mechanism
Leader election process:
# Check current leader for a service
kubectl -n metallb logs -l app.kubernetes.io/component=speaker | grep "announcing"

# Example output:
# {"level":"info","ts":"2024-01-15T10:30:00Z","msg":"announcing","ip":"10.4.11.1","node":"bettley"}
Failover sequence:
- Leader failure: Current announcing node becomes unavailable
- Detection: MetalLB speakers detect leader absence (typically 10-30 seconds)
- Election: Remaining speakers elect new leader using deterministic algorithm
- Gratuitous ARP: New leader sends gratuitous ARP to update network caches
- Service restoration: Traffic resumes through new leader node
DNS Infrastructure Migration
I also lost some control over DNS, e.g. the router's DNS server will override all lookups for hellholt.net rather than forwarding requests to my DNS servers.
So I created a new domain, goldentooth.net, to handle this cluster. A couple of tweaks to ExternalDNS and some service definitions and I can verify that ExternalDNS is setting the DNS records correctly, although I don't seem to be able to resolve names just yet.
Domain Migration Impact
Previous Domain: hellholt.net
- Router control: New router overrides DNS resolution
- Local DNS interference: Router's DNS server intercepts queries
- Limited delegation: Consumer router lacks sophisticated DNS forwarding
New Domain: goldentooth.net
- External control: Managed entirely in AWS Route53
- Clean delegation: No local DNS interference
- ExternalDNS compatibility: Full automation support
ExternalDNS Configuration Updates
Domain filter change:
# Previous configuration
args:
- --domain-filter=hellholt.net

# New configuration
args:
- --domain-filter=goldentooth.net
Service annotation updates:
# httpbin service example
metadata:
  annotations:
    external-dns.alpha.kubernetes.io/hostname: httpbin.goldentooth.net
    # Previously: httpbin.hellholt.net
DNS record verification:
# Check Route53 records
aws route53 list-resource-record-sets --hosted-zone-id Z0736727S7ZH91VKK44A

# Verify DNS propagation
dig A httpbin.goldentooth.net
dig TXT httpbin.goldentooth.net  # Ownership records
Performance and Operational Considerations
Layer 2 Mode Limitations
Single point of failure:
- Only one node handles traffic for each LoadBalancer IP
- Node failure causes service interruption until failover completes
- No load distribution across multiple nodes
Network broadcast traffic:
- ARP announcements increase broadcast traffic
- Gratuitous ARP during failover events
- Potential impact on large Layer 2 domains
Scalability constraints:
- All service traffic passes through single node
- Node bandwidth becomes bottleneck for high-traffic services
- Limited horizontal scaling compared to BGP mode
Monitoring and Troubleshooting
MetalLB speaker logs:
# Monitor speaker activities
kubectl -n metallb logs -l component=speaker --tail=50

# Check for leader election events
kubectl -n metallb logs -l component=speaker | grep -E "(leader|announcing|failover)"

# Verify ARP announcements
kubectl -n metallb logs -l component=speaker | grep "gratuitous ARP"
Network connectivity testing:
# Test ARP resolution for LoadBalancer IPs
arping -c 3 10.4.11.1

# Check MAC address consistency
arp -a | grep "10.4.11"

# Verify static routes on router
ip route show | grep "10.4.11.0/24"
Future TLS Strategy
I think I still need to get TLS working too, but I've soured on the idea of maintaining a cert per domain name and per service. I think I'll just have a wildcard over goldentooth.net and share that out. Too much aggravation otherwise. That's a problem for another time, though.
Wildcard certificate benefits:
- Simplified management: Single certificate for all subdomains
- Reduced complexity: No per-service certificate automation
- Cost efficiency: One certificate instead of multiple Let's Encrypt certs
- Faster deployment: No certificate provisioning delays for new services
Implementation considerations:
# Wildcard certificate configuration
apiVersion: cert-manager.io/v1
kind: Certificate
metadata:
  name: goldentooth-wildcard
  namespace: default
spec:
  secretName: goldentooth-wildcard-tls
  issuerRef:
    name: letsencrypt-prod
    kind: ClusterIssuer
  dnsNames:
  - "*.goldentooth.net"
  - "goldentooth.net"
Configuration Persistence
The Layer 2 configuration is maintained in the gitops repository structure:
MetalLB Helm chart updates:
# values.yaml changes
spec:
  # BGP configuration removed
  # bgpPeers: []
  # bgpAdvertisements: []

  # Layer 2 configuration added
  l2Advertisements:
  - name: primary
    ipAddressPools:
    - primary
This transition demonstrates the flexibility of MetalLB to adapt to different network environments while maintaining service availability. While Layer 2 mode has limitations compared to BGP, it provides a viable solution for simpler network infrastructures and reduces operational complexity in exchange for some scalability constraints.
Post-Implementation Updates and Additional Fixes
After the initial MetalLB L2 migration, several additional issues were discovered and resolved to achieve full operational status.
Network Interface Selection Issues
During verification, a critical issue emerged with "super shaky" primary interface selection on cluster nodes. Some nodes (particularly newer ones like lipps and karstark) had both wired (eth0) and wireless (wlan0) interfaces active, causing:
- Calico confusion: CNI plugin using wireless interfaces for pod networking
- MetalLB routing failures: ARP announcements on wrong interfaces
- Inconsistent connectivity: Services unreachable from certain nodes
Solution implemented:
- Enhanced networking role: Created robust interface detection logic preferring
eth0 - Wireless interface management: Automatic detection and disabling of
wlan0on dual-homed nodes - SystemD persistence: Network configurations and wireless disable service survive reboots
- Network debugging tools: Installed comprehensive toolset (
arping,tcpdump,mtr, etc.)
Networking role improvements:
# /ansible/roles/goldentooth.setup_networking/tasks/main.yaml
- name: 'Set primary interface to eth0 if available'
  ansible.builtin.set_fact:
    metallb_interface: 'eth0'
  when:
    - 'network.metallb.interface == ""'
    - 'eth0_exists.rc == 0'

- name: 'Disable wireless interface if both eth0 and wireless exist'
  ansible.builtin.shell:
    cmd: "ip link set {{ wireless_interface_name.stdout }} down"
  when:
    - 'wireless_interface_count.stdout | int > 0'
    - 'eth0_exists.rc == 0'
DNS Architecture Migration
The L2 migration coincided with a broader DNS restructuring from hellholt.net to goldentooth.net with hierarchical service domains:
New domain structure:
- Nodes:
<node>.nodes.goldentooth.net - Kubernetes services:
<service>.services.k8s.goldentooth.net - Nomad services:
<service>.services.nomad.goldentooth.net - General services:
<service>.services.goldentooth.net
ExternalDNS integration:
# Service annotations for automatic DNS management
metadata:
  annotations:
    external-dns.alpha.kubernetes.io/hostname: "argocd.services.k8s.goldentooth.net"
    external-dns.alpha.kubernetes.io/ttl: "60"
Current Operational Status (July 2025)
The MetalLB L2 configuration is now fully operational with the following verified services:
Active LoadBalancer services:
- ArgoCD:
argocd.services.k8s.goldentooth.net→10.4.11.0 - HTTPBin:
httpbin.services.k8s.goldentooth.net→10.4.11.1
Verification commands (updated):
# Check MetalLB speaker status
kubectl -n metallb logs -l app.kubernetes.io/component=speaker --tail=20

# Verify L2 announcements
kubectl -n metallb logs -l app.kubernetes.io/component=speaker | grep "announcing"

# Test connectivity to LoadBalancer IPs
curl -I http://10.4.11.1/  # HTTPBin
curl -I http://10.4.11.0/  # ArgoCD

# Verify DNS resolution
dig argocd.services.k8s.goldentooth.net
dig httpbin.services.k8s.goldentooth.net

# Check interface status on all nodes
goldentooth command all_nodes "ip link show | grep -E '(eth0|wlan)'"
MetalLB configuration summary:
- Mode: Layer 2 (BGP disabled)
- IP Pool:
10.4.11.0 - 10.4.15.254 - Interface:
eth0(consistently across all nodes) - FRR: Disabled in Helm values for pure L2 operation
NFS Mounts
Now that Kubernetes is kinda squared away, I'm going to set up NFS mounts on the cluster nodes.
For the sake of simplicity, I'll just set up the mounts on every node, including the load balancer (which is currently exporting the share).
Implementation Architecture
Systemd-Based Mounting
Rather than using traditional /etc/fstab entries, I implemented NFS mounting using systemd mount and automount units. This approach provides several advantages:
- Dynamic mounting: Automount units mount filesystems on-demand
- Service management: Standard systemd service lifecycle management
- Dependency handling: Proper ordering with network services
- Logging: Integration with systemd journal for troubleshooting
Global Configuration
The NFS mount configuration is defined in group_vars/all/vars.yaml:
nfs:
  server: "{{ groups['nfs_server'] | first}}"
  mounts:
    primary:
      share: "{{ hostvars[groups['nfs_server'] | first].ipv4_address }}:/mnt/usb1"
      mount: '/mnt/nfs'
      safe_name: 'mnt-nfs'
      type: 'nfs'
      options: {}
This configuration:
- Dynamically determines NFS server: Uses first host in
nfs_servergroup (allyrion) - IP-based addressing: Uses
10.4.0.10:/mnt/usb1for reliable connectivity - Standardized mount point: All nodes mount at
/mnt/nfs - Safe naming: Provides
mnt-nfsfor systemd unit names
Systemd Template Implementation
Mount Unit Template
The mount service template (templates/mount.j2) creates individual systemd mount units:
[Unit]
Description=Mount {{ item.key }}

[Mount]
What={{ item.value.share }}
Where={{ item.value.mount }}
Type={{ item.value.type }}
Options={{ item.value.options | join(',') }}

[Install]
WantedBy=default.target
This generates a unit file at /etc/systemd/system/mnt-nfs.mount with:
- What:
10.4.0.10:/mnt/usb1(NFS export path) - Where:
/mnt/nfs(local mount point) - Type:
nfs(filesystem type) - Options: Default NFS mount options
Automount Unit Template
The automount template (templates/automount.j2) provides on-demand mounting:
[Unit]
Description=Automount {{ item.key }}
After=remote-fs-pre.target network-online.target network.target
Before=umount.target remote-fs.target

[Automount]
Where={{ item.value.mount }}

[Install]
WantedBy=default.target
Key features:
- Network dependencies: Waits for network availability before attempting mounts
- Lazy mounting: Only mounts when the path is accessed
- Proper ordering: Correctly sequences with system startup and shutdown
Deployment Process
Ansible Role Implementation
The goldentooth.setup_nfs_mounts role handles the complete deployment:
- name: 'Generate mount unit for {{ item.key }}.'
  ansible.builtin.template:
    src: 'mount.j2'
    dest: "/etc/systemd/system/{{ item.value.safe_name }}.mount"
    mode: '0644'
  loop: "{{ nfs.mounts | dict2items }}"
  notify: 'reload systemd'

- name: 'Generate automount unit for {{ item.key }}.'
  ansible.builtin.template:
    src: 'automount.j2'
    dest: "/etc/systemd/system/{{ item.value.safe_name }}.automount"
    mode: '0644'
  loop: "{{ nfs.mounts | dict2items }}"
  notify: 'reload systemd'
Service Management
The role ensures proper service lifecycle:
- name: 'Enable and start automount services.'
  ansible.builtin.systemd:
    name: "{{ item.value.safe_name }}.automount"
    enabled: true
    state: started
    daemon_reload: true
  loop: "{{ nfs.mounts | dict2items }}"
Network Integration
Client Targeting
The NFS mounts are deployed across the entire cluster:
Target Hosts: All cluster nodes (hosts: 'all')
- 12 Raspberry Pi nodes: allyrion, bettley, cargyll, dalt, erenford, fenn, gardener, harlton, inchfield, jast, karstark, lipps
- 1 x86 GPU node: velaryon
Including NFS Server: Even allyrion (the NFS server) mounts its own export, providing:
- Consistent access patterns: Same path (
/mnt/nfs) on all nodes - Testing capability: Server can verify export functionality
- Simplified administration: Uniform management across cluster
Network Configuration
Infrastructure Network: All communication occurs within the trusted 10.4.0.0/20 CIDR
NFS Protocol: Standard NFSv3/v4 with default options
Firewall: No additional firewall rules needed within cluster network
Directory Structure and Permissions
Mount Point Creation
- name: 'Ensure mount directories exist.'
  ansible.builtin.file:
    path: "{{ item.value.mount }}"
    state: directory
    mode: '0755'
  loop: "{{ nfs.mounts | dict2items }}"
Shared Directory Usage
The NFS mount serves multiple cluster functions:
Slurm Integration:
slurm_nfs_base_path: "{{ nfs.mounts.primary.mount }}/slurm"
Common Patterns:
/mnt/nfs/slurm/- HPC job shared storage/mnt/nfs/shared/- General cluster shared data/mnt/nfs/config/- Configuration file distribution
Command Line Integration
goldentooth CLI Commands
# Configure NFS mounts on all nodes
goldentooth setup_nfs_mounts

# Verify mount status
goldentooth command all 'systemctl status mnt-nfs.automount'
goldentooth command all 'df -h /mnt/nfs'

# Test shared storage
goldentooth command allyrion 'echo "test" > /mnt/nfs/test.txt'
goldentooth command bettley 'cat /mnt/nfs/test.txt'
Troubleshooting and Verification
Service Status Verification
# Check automount service status
systemctl status mnt-nfs.automount

# Check mount service status (after access)
systemctl status mnt-nfs.mount

# View mount information
mount | grep nfs
df -h /mnt/nfs
Common Issues and Solutions
Network Dependencies: The automount units properly wait for network availability through After=network-online.target
Permission Issues: The NFS export uses no_root_squash, allowing proper root access from clients
Mount Persistence: Automount units ensure mounts survive reboots and network interruptions
Security Considerations
Trust Model
Internal Network Security: Security relies on the trusted cluster network boundary
No User Authentication: Uses IP-based access control rather than user credentials
Root Access: no_root_squash on server allows administrative operations
Future Enhancements
The current implementation could be enhanced with:
- Kerberos authentication for user-based security
- Network policies for additional access control
- Encryption in transit for sensitive data protection
Integration with Storage Evolution
Note: This NFS mounting system provides the foundation for shared storage. As documented in Chapter 050, the cluster later evolves to include ZFS-based storage with replication, while maintaining compatibility with these NFS mount patterns.
This in itself wasn't too complicated, but I created two template files (one for a .mount service, another for a .automount service), fought with the variables for a bit, and it seems to work. The result is robust, cluster-wide shared storage accessible at /mnt/nfs on every node.
Slurm
Okay, finally, geez.
So this is about Slurm, an open-source, highly scalable, and fault-tolerant cluster management and job-scheduling system.
Before we get started: I want to express tremendous gratitude to Hossein Ghorbanfekr, for this Medium article and this second Medium article, which helped me set up Slurm and the modules and illustrated how to work with the system and verify its functionality. I'm a Slurm newbie and his articles were invaluable.
First, we're going to set up MUNGE, which is an authentication service designed for scalability within HPC environments. This is just a matter of installing the munge package, synchronizing the MUNGE key across the cluster (which isn't as ergonomic as I'd like, but oh well), and restarting the service.
Slurm itself isn't too complex to install, but we want to switch off slurmctld for the compute nodes and on for the controller nodes.
The next part is the configuration, which, uh, I'm not going to run through here. There are a ton of options and I'm figuring it out directive by directive by reading the documentation. Suffice to say that it's detailed, I had to hack some things in, and everything appears to work but I can't verify that just yet.
The control nodes write state to the NFS volume, the idea being that if one of them fails there'll be a short nonresponsive period and then another will take over. It recommends not using NFS, and I think it wants something like Ceph or GlusterFS or something, but I'm not going to bother; this is just an educational cluster, and these distributed filesystems really introduce a lot of complexity that I don't want to deal with right now.
Ultimately, I end up with this:
$ sinfo
PARTITION AVAIL  TIMELIMIT  NODES  STATE NODELIST
general*     up   infinite      9   idle bettley,cargyll,dalt,erenford,fenn,gardener,harlton,inchfield,jast
debug        up   infinite      9   idle bettley,cargyll,dalt,erenford,fenn,gardener,harlton,inchfield,jast
$ scontrol show nodes
NodeName=bettley Arch=aarch64 CoresPerSocket=4
   CPUAlloc=0 CPUEfctv=1 CPUTot=1 CPULoad=0.84
   AvailableFeatures=(null)
   ActiveFeatures=(null)
   Gres=(null)
   NodeAddr=10.4.0.11 NodeHostName=bettley Version=22.05.8
   OS=Linux 6.12.20+rpt-rpi-v8 #1 SMP PREEMPT Debian 1:6.12.20-1+rpt1~bpo12+1 (2025-03-19)
   RealMemory=4096 AllocMem=0 FreeMem=1086 Sockets=1 Boards=1
   State=IDLE ThreadsPerCore=1 TmpDisk=0 Weight=1 Owner=N/A MCS_label=N/A
   Partitions=general,debug
   BootTime=2025-04-02T20:28:31 SlurmdStartTime=2025-04-04T12:43:13
   LastBusyTime=2025-04-04T12:43:21
   CfgTRES=cpu=1,mem=4G,billing=1
   AllocTRES=
   CapWatts=n/a
   CurrentWatts=0 AveWatts=0
   ExtSensorsJoules=n/s ExtSensorsWatts=0 ExtSensorsTemp=n/s

... etc ...
The next step is to set up Lua and Lmod for managing environments. Lua of course is a scripting language, and the Lmod system allows users of a Slurm cluster to flexibly modify their environment, use different versions of libraries and tools, etc by loading and unloading modules.
Setting this up isn't terribly fun or interesting. Lmod is on sourceforge, Lua is in Apt, we install some things, build Lmod from source, create some symlinks to ensure that Lmod is available in users' shell environments, and when we shell in and type a command, we can list our modules.
$ module av

------------------------------------------------------------------ /mnt/nfs/slurm/apps/modulefiles -------------------------------------------------------------------
   StdEnv

Use "module spider" to find all possible modules and extensions.
Use "module keyword key1 key2 ..." to search for all possible modules matching any of the "keys".
After the StdEnv, we can set up OpenMPI. OpenMPI is an implementation of Message Passing Interface (MPI), used to coordinate communication between processes running across different nodes in a cluster. It's built for speed and flexibility in environments where you need to split computation across many CPUs or machines, and allows us to quickly and easily execute processes on multiple Slurm nodes.
OpenMPI is comparatively straightforward to set up, mostly just installing a few system packages for libraries and headers and creating a module file.
The next step is setting up Golang, which is unfortunately a bit more aggravating than it should be, involving "manual" work (in Ansible terms, so executing commands and operating via trial-and-error rather than using predefined modules) because the latest version of Go in the Apt repos appears to be 1.19 but the latest version is 1.24 and I apparently need 1.23 at least to build Singularity (see next section).
Singularity is a method for running containers without the full Docker daemon and its complications. It's written in Go, which is why we had to install 1.23.0 and couldn't rest on our laurels with 1.19.0 in the Apt repository (or, indeed, 1.21.0 as I originally thought).
Building Singularity requires additional packages, and it takes quite a while. But when done:
$ module av

------------------------------------------------------------------ /mnt/nfs/slurm/apps/modulefiles -------------------------------------------------------------------
   Golang/1.21.0    Golang/1.23.0 (D)    OpenMPI    Singularity/4.3.0    StdEnv

  Where:
   D:  Default Module

Use "module spider" to find all possible modules and extensions.
Use "module keyword key1 key2 ..." to search for all possible modules matching any of the "keys".
Then we can use it:
$ module load Singularity
$ singularity pull docker://arm64v8/hello-world
INFO:    Converting OCI blobs to SIF format
INFO:    Starting build...
INFO:    Fetching OCI image...
INFO:    Extracting OCI image...
INFO:    Inserting Singularity configuration...
INFO:    Creating SIF file...
$ srun singularity run hello-world_latest.sif
WARNING: passwd file doesn't exist in container, not updating
WARNING: group file doesn't exist in container, not updating

Hello from Docker!
This message shows that your installation appears to be working correctly.

To generate this message, Docker took the following steps:
 1. The Docker client contacted the Docker daemon.
 2. The Docker daemon pulled the "hello-world" image from the Docker Hub.
    (arm64v8)
 3. The Docker daemon created a new container from that image which runs the
    executable that produces the output you are currently reading.
 4. The Docker daemon streamed that output to the Docker client, which sent it
    to your terminal.

To try something more ambitious, you can run an Ubuntu container with:
 $ docker run -it ubuntu bash

Share images, automate workflows, and more with a free Docker ID:
 https://hub.docker.com/

For more examples and ideas, visit:
 https://docs.docker.com/get-started/
We can also build a Singularity definition file with
$ cat > ~/torch.def << EOF
Bootstrap: docker
From: ubuntu:20.04

%post
    apt-get -y update
    apt-get -y install python3-pip
    pip3 install numpy torch

%environment
    export LC_ALL=C
EOF
$ singularity build --fakeroot torch.sif torch.def
INFO:    Starting build...
INFO:    Fetching OCI image...
24.8MiB / 24.8MiB [===============================================================================================================================] 100 % 2.8 MiB/s 0s
INFO:    Extracting OCI image...
INFO:    Inserting Singularity configuration...
....
INFO:    Adding environment to container
INFO:    Creating SIF file...
INFO:    Build complete: torch.sif
and finally run it interactively:
$ salloc --tasks=1 --cpus-per-task=2 --mem=1gb
$ srun singularity run torch.sif \
    python3 -c "import torch; print(torch.tensor(range(5)))"
tensor([0, 1, 2, 3, 4])
$ exit
We can also submit it as a batch:
$ cat > ~/submit_torch.sh << EOF
#!/usr/bin/sh -l

#SBATCH --job-name=torch
#SBATCH --mem=1gb
#SBATCH --ntasks=1
#SBATCH --cpus-per-task=2
#SBATCH --time=00:05:00

module load Singularity

srun singularity run torch.sif \
    python3 -c "import torch; print(torch.tensor(range(5)))"
EOF
$ sbatch submit_torch.sh
Submitted batch job 398
$ squeue
             JOBID PARTITION     NAME     USER ST       TIME  NODES NODELIST(REASON)
               398   general    torch   nathan  R       0:03      1 bettley
$ cat slurm-398.out
tensor([0, 1, 2, 3, 4])
The next part will be setting up Conda, which is similarly a bit more aggravating than it probably should.
Once that's done, though:
$ conda env list

# conda environments:
#
base                   /mnt/nfs/slurm/miniforge
default-env            /mnt/nfs/slurm/miniforge/envs/default-env
python3.10             /mnt/nfs/slurm/miniforge/user_envs/python3.10
python3.11             /mnt/nfs/slurm/miniforge/user_envs/python3.11
python3.12             /mnt/nfs/slurm/miniforge/user_envs/python3.12
python3.13             /mnt/nfs/slurm/miniforge/user_envs/python3.13
And we can easily activate an environment...
$ source activate python3.13
(python3.13) $
And we can schedule jobs to run across multiple nodes:
$ cat > ./submit_conda.sh << EOF
#!/usr/bin/env bash

#SBATCH --job-name=conda
#SBATCH --mem=1gb
#SBATCH --ntasks=6
#SBATCH --cpus-per-task=2
#SBATCH --time=00:05:00

# Load Conda and activate Python 3.13 environment.
module load Conda
source activate python3.13

srun python --version

sleep 5
EOF
$ sbatch submit_conda.sh
Submitted batch job 403
$ squeue
             JOBID PARTITION     NAME     USER ST       TIME  NODES NODELIST(REASON)
               403   general    conda   nathan  R       0:01      3 bettley,cargyll,dalt
$ cat slurm-403.out
Python 3.13.2
Python 3.13.2
Python 3.13.2
Python 3.13.2
Python 3.13.2
Python 3.13.2
Super cool.
Terraform
I would like my Goldentooth services to be reachable from anywhere, but 1) I'd like trouble-free TLS encryption to the domain, and 2) I'd like to hide my home IP address. I can set up LetsEncrypt, but I've had issues in the past with local storage of certificates on what is essentially an ephemeral setup that might get blown up at any point. I'd like to prevent spurious strain on their systems, outages due to me spamming, etc etc etc. I'd prefer it if I could use AWS ACM. If I can use ACM and CloudFront and just not cache anything, or cache intelligently on a per-domain basis, that would be nice. I don't know if I can get that working - I know AWS intends ACM for AWS services – but I'll try.
So the first step of this is to set up Terraform; to create an S3 bucket to hold the state and a lock to support state locking.
We can bootstrap this by just creating the S3 bucket, then creating a Terraform configuration that only contains that S3 bucket and imports the existing bucket (mostly so I don't forget what the bucket is for or what it is using). I apply that - yup, works.
The next thing I add is configuration for an OIDC provider for GitHub. Fortunately, there's a provider for this, so it's easy to set up. I apply that and it creates an IAM role. I assign it Administrator access temporarily.
I create a GitHub Actions workflow to set up Terraform, plan, and apply the configuration. That works when I push to main. Pretty sweet.
Dynamic DNS
As previously stated: I would like my Goldentooth services to be reachable from anywhere, but 1) I'd like trouble-free TLS encryption to the domain, and 2) I'd like to hide my home IP address. I can set up LetsEncrypt, but I've had issues in the past with local storage of certificates on what is essentially an ephemeral setup that might get blown up at any point. I'd like to prevent spurious strain on their systems, outages due to me spamming, etc etc etc. I'd prefer it if I could use AWS ACM. If I can use ACM and CloudFront and just not cache anything, or cache intelligently on a per-domain basis, that would be nice. I don't know if I can get that working - I know AWS intends ACM for AWS services – but I'll try.
The next step of this is to get my router to update Route53 with my home IP address whenever it changes. That's going to require a Lambda function, API Gateway, an SSM Parameter for the credentials, an IAM role, etc. That's all going to be deployed and managed via Terraform.

Load Balancer Revisited
As previously stated: I would like my Goldentooth services to be reachable from anywhere, but 1) I'd like trouble-free TLS encryption to the domain, and 2) I'd like to hide my home IP address. I can set up LetsEncrypt, but I've had issues in the past with local storage of certificates on what is essentially an ephemeral setup that might get blown up at any point. I'd like to prevent spurious strain on their systems, outages due to me spamming, etc etc etc. I'd prefer it if I could use AWS ACM. If I can use ACM and CloudFront and just not cache anything, or cache intelligently on a per-domain basis, that would be nice. I don't know if I can get that working - I know AWS intends ACM for AWS services – but I'll try.
Now, one thing I want to be able to do for this is to have a single origin for the CloudFront distribution, e.g. *.my-home.goldentooth.net, which will resolve to my home IP address. But I want to be able to route based on domain name. I already have <service>.goldentooth.net working with ExternalDNS and MetalLB. So I want my reverse proxy to map an incoming request for <service>.my-home.goldentooth.net to a backend <service>.goldentooth.net with as little extra work as possible. Performance is less of an issue here than the fact that it works, that it's easy to maintain and repair if it breaks three year from now, and that I can complete this and move on to something else.
These factors combined mean that I should not use HAProxy for this. HAProxy is incredibly powerful and very performant, but it is not incredibly flexible for this sort of ad-hoc YOLO kind of work. Nginx, however, is.
So, alongside HAProxy, which I'm using for Kubernetes high-availability, I'll open a port on my router and forward it to Nginx, which will reverse-proxy that based on the domain name to the appropriate local load balancer service.
The resulting configuration is pretty simple:
server {
  listen 8080;
  resolver 8.8.8.8 valid=10s;
  server_name ~^(?<subdomain>[^.]+)\.{{ cluster.cloudfront_origin_domain }}$;
  location / {
    set $target_host "$subdomain.{{ cluster.domain }}";
    proxy_pass http://$target_host;
    proxy_set_header Host $target_host;
    proxy_set_header X-Real-IP $remote_addr;
    proxy_set_header X-Forwarded-For $proxy_add_x_forwarded_for;
    proxy_ssl_verify off;
  }
}
And it just works; requesting http://httpbin.my-home.goldentooth.net:7463/ returns the appropriate service.
CloudFront and ACM
The next step will be to set up a CloudFront distribution that uses this address format as an origin, with no caching, and an ACM certificate. Assuming I can do that. If I can't, I might need to figure something else out. I could also use CloudFlare, and indeed if anyone ever reads this they're probably screaming at me, "just use CloudFlare, you idiot," but I'm trying to restrict the number of services and complications that I need to keep operational simultaneously.
Plus, I use Safari (and Brave) rather than Chrome, and one of the only systems with which I seem to encounter persistent issues using Safari is... CloudFlare. It might not for my use case, but I figure I would need to set it up just to test it.
So, yes, I'm totally aware this is a nasty hack, but... I'm gonna try it.
Spelling this out a little, here's the explicit idea:
- Make a request to
service.home-proxy.goldentooth.net - That does DNS lookup, which points to a CloudFront distribution
- TLS certificate loads for CloudFront
- CloudFront makes request to my home internet, preserving the Host header
- That request gets port-forwarded to Nginx
- Nginx matches host header
service.home-proxy.goldentooth.netand sets$subdomaintoservice - Nginx sets upstream server name to
service.goldentooth.net - Nginx does DNS lookup for upstream server and finds
10.4.11.43 - Nginx proxies request back to
10.4.11.43
And this appears to work:
$ curl https://httpbin.home-proxy.goldentooth.net/ip
{
  "origin": "66.61.26.32"
}
The latency is nonzero but not noticeable to me. It's still an ugly hack, and there are some security implications I'll need to deal with. I ended up adding basic auth on the Nginx listener which, while not fantastic, is probably as much as I really need.
Prometheus
Way back in Chapter 19, I set up an Prometheus Node Exporter "app" for Argo CD, but I never actually set up Prometheus itself.
That's really fairly odd for me, since I'm normally super twitchy about metrics, logging, and observability. I guess I put it off because I was dealing with some kind of existential questions; where would Prometheus live, how would it communicate, etc, but then ended up kinda running out of steam before I answered the questions.
So, better late than never, I'm going to work on setting up Prometheus in a nice, decentralized kind of way.
Implementation Architecture
Installation Method
I'm using the official prometheus.prometheus.prometheus Ansible role from the Prometheus community. The depth to Prometheus is, after all, configuring and using it, not merely in installing it.
The installation is managed through:
- Playbook:
setup_prometheus.yaml - Custom role:
goldentooth.setup_prometheus(wraps the community role) - CLI command:
goldentooth setup_prometheus
Deployment Location
Prometheus runs on allyrion (10.4.0.10), which consolidates multiple infrastructure services:
- HAProxy load balancer
- NFS server
- Prometheus monitoring server
This placement provides several advantages:
- Central location for cluster-wide monitoring
- Proximity to load balancer for HAProxy metrics
- Reduced resource usage on Kubernetes worker nodes
Service Configuration
Core Settings
The Prometheus service is configured with production-ready settings:
# Storage and retention
prometheus_storage_retention_time: "15d"
prometheus_storage_retention_size: "5GB"
prometheus_storage_tsdb_path: "/var/lib/prometheus"

# Network and performance
prometheus_web_listen_address: "0.0.0.0:9090"
prometheus_config_global_scrape_interval: "60s"
prometheus_config_global_evaluation_interval: "15s"
prometheus_config_global_scrape_timeout: "15s"
Security Hardening
The service implements comprehensive security measures:
- Dedicated user: Runs as
prometheususer/group - Systemd hardening: NoNewPrivileges, PrivateDevices, ProtectSystem=strict
- Capability restrictions: Limited to CAP_SET_UID only
- Resource limits: GOMAXPROCS=4 to prevent CPU exhaustion
External Labels
Cluster identification through external labels:
external_labels:
  environment: goldentooth
  cluster: goldentooth
  domain: goldentooth.net
Service Discovery Implementation
File-Based Service Discovery
Rather than relying on complex auto-discovery, I implement file-based service discovery for reliability and explicit control:
Target Generation (/etc/prometheus/file_sd/node.yaml):
{% for host in groups['all'] %}
- targets:
    - "{{ hostvars[host]['ipv4_address'] }}:9100"
  labels:
    instance: "{{ host }}"
    job: 'node'
{% endfor %}
This approach:
- Auto-generates targets from Ansible inventory
- Covers all 13 cluster nodes (12 Raspberry Pis + 1 x86 GPU node)
- Provides consistent labeling with
instanceandjoblabels - Updates automatically when nodes are added/removed
Scrape Configurations
Core Infrastructure Monitoring
Prometheus Self-Monitoring:
- job_name: 'prometheus'
  static_configs:
    - targets: ['allyrion:9090']
HAProxy Load Balancer:
- job_name: 'haproxy'
  static_configs:
    - targets: ['allyrion:8405']
HAProxy includes a built-in Prometheus exporter accessible at /metrics on port 8405, providing load balancer performance and health metrics.
Nginx Reverse Proxy:
- job_name: 'nginx'
  static_configs:
    - targets: ['allyrion:9113']
Node Monitoring
File Service Discovery for all cluster nodes:
- job_name: "unknown"
  file_sd_configs:
    - files:
      - "/etc/prometheus/file_sd/*.yaml"
      - "/etc/prometheus/file_sd/*.json"
This targets all Node Exporter instances across the cluster, providing comprehensive infrastructure metrics.
Advanced Integrations
Loki Log Aggregation:
- job_name: 'loki'
  static_configs:
    - targets: ['inchfield:3100']
  scheme: 'https'
  tls_config:
    ca_file: /etc/ssl/certs/goldentooth.pem
This integration uses the Step-CA certificate authority for secure communication with the Loki log aggregation service.
Exporter Ecosystem
Node Exporter Deployment
Kubernetes Nodes (via Argo CD):
- Helm Chart: prometheus-node-exporter v4.46.1
- Namespace: prometheus-node-exporter
- Extra Collectors:
--collector.systemd,--collector.processes - Management: Automated GitOps deployment with auto-sync
Infrastructure Node (allyrion):
- Installation: Via
prometheus.prometheus.node_exporterrole - Enabled Collectors: systemd for service monitoring
- Integration: Direct scraping by local Prometheus instance
Application Exporters
I also configured several application-specific exporters:
HAProxy Built-in Exporter: Provides load balancer metrics including backend health, response times, and traffic distribution
Nginx Exporter: Monitors reverse proxy performance and request patterns
Network Access and Security
Nginx Reverse Proxy
To provide secure external access to Prometheus, I configured an Nginx reverse proxy:
server {
    listen 8081;
    location / {
        proxy_pass http://127.0.0.1:9090;
        proxy_set_header Host $host;
        proxy_set_header X-Real-IP $remote_addr;
        proxy_set_header X-Application prometheus;
    }
}
This provides:
- Network isolation (Prometheus only accessible locally)
- Header injection for request identification
- Potential for future authentication layer
Certificate Integration
The cluster uses Step-CA for comprehensive certificate management. Prometheus leverages this infrastructure for:
- Secure scraping of TLS-enabled services (Loki)
- Potential future TLS termination
- Integration with the broader security model
Alerting Configuration
Basic Alert Rules
The installation includes foundational alerting rules in /etc/prometheus/rules/ansible_managed.yml:
Watchdog Alert: Always-firing alert to verify the alerting pipeline is functional
Instance Down Alert: Critical alert when up == 0 for 5 minutes, indicating node or service failure
Future Expansion
The alert rule framework is prepared for expansion with application-specific alerts, SLA monitoring, and capacity planning alerts.
Integration with Monitoring Stack
Grafana Integration
Prometheus serves as the primary data source for Grafana dashboards:
datasources:
  - name: prometheus
    type: prometheus
    url: http://allyrion:9090
    access: proxy
This enables rich visualization of cluster metrics through pre-configured and custom dashboards.
Storage and Performance
TSDB Configuration:
- Retention: 15 days (time) and 5GB (size) for appropriate data lifecycle
- Storage: Local disk at
/var/lib/prometheus - Compaction: Automatic TSDB compaction for optimal query performance
The scrape configuration was fairly straightforward, and the result is a comprehensive monitoring foundation covering all infrastructure components and preparing for future application-specific monitoring expansion.
Consul
I wanted to install a service discovery system to manage, well, all of the other services that exist only to manage other services on this cluster.
I have the idea of installing Authelia, then Envoy, then Consul in a chain as a replacement for Nginx. Obviously it's far more complicated than Nginx, but by now that's the point; to increase the complexity of this homelab until it collapses under its own weight. Alas poor Goldentooth. I knew him, Gentle Reader, a cluster of infinite GPIO!
First order of business is to set up the Consul servers – leader and followers – which will occupy Bettley, Cargyll, and Dalt.
For most of this, I just followed the deployment guide. Then I followed the guide for creating client agent tokens.
Unfortunately, I encountered some issues when it came to setting up ACLs. For some reason, my server nodes worked precisely as expected, but my nodes would not join the cluster.
Apr 12 13:44:56 fenn consul[328873]: ==> Starting Consul agent...
Apr 12 13:44:56 fenn consul[328873]:                Version: '1.20.5'
Apr 12 13:44:56 fenn consul[328873]:             Build Date: '2025-03-11 10:16:18 +0000 UTC'
Apr 12 13:44:56 fenn consul[328873]:                Node ID: 'a5c6a1f2-8811-9de7-917f-acc1cd9fc8b7'
Apr 12 13:44:56 fenn consul[328873]:              Node name: 'fenn'
Apr 12 13:44:56 fenn consul[328873]:             Datacenter: 'dc1' (Segment: '')
Apr 12 13:44:56 fenn consul[328873]:                 Server: false (Bootstrap: false)
Apr 12 13:44:56 fenn consul[328873]:            Client Addr: [127.0.0.1] (HTTP: 8500, HTTPS: -1, gRPC: -1, gRPC-TLS: -1, DNS: 8600)
Apr 12 13:44:56 fenn consul[328873]:           Cluster Addr: 10.4.0.15 (LAN: 8301, WAN: 8302)
Apr 12 13:44:56 fenn consul[328873]:      Gossip Encryption: true
Apr 12 13:44:56 fenn consul[328873]:       Auto-Encrypt-TLS: true
Apr 12 13:44:56 fenn consul[328873]:            ACL Enabled: true
Apr 12 13:44:56 fenn consul[328873]:     ACL Default Policy: deny
Apr 12 13:44:56 fenn consul[328873]:              HTTPS TLS: Verify Incoming: true, Verify Outgoing: true, Min Version: TLSv1_2
Apr 12 13:44:56 fenn consul[328873]:               gRPC TLS: Verify Incoming: true, Min Version: TLSv1_2
Apr 12 13:44:56 fenn consul[328873]:       Internal RPC TLS: Verify Incoming: true, Verify Outgoing: true (Verify Hostname: true), Min Version: TLSv1_2
Apr 12 13:44:56 fenn consul[328873]: ==> Log data will now stream in as it occurs:
Apr 12 13:44:56 fenn consul[328873]: 2025-04-12T13:44:55.999-0400 [WARN]  agent: skipping file /etc/consul.d/consul.env, extension must be .hcl or .json, or config f
ormat must be set
Apr 12 13:44:56 fenn consul[328873]: 2025-04-12T13:44:56.021-0400 [WARN]  agent.auto_config: skipping file /etc/consul.d/consul.env, extension must be .hcl or .json,
 or config format must be set
Apr 12 13:45:06 fenn consul[328873]: 2025-04-12T13:45:06.216-0400 [ERROR] agent.auto_config: AutoEncrypt.Sign RPC failed: addr=10.4.0.11:8300 error="rpcinsecure: err
or making call: rpcinsecure: error making call: Permission denied: anonymous token lacks permission 'node:write' on \"fenn\". The anonymous token is used implicitly
when a request does not specify a token."
Apr 12 13:45:06 fenn consul[328873]: 2025-04-12T13:45:06.225-0400 [ERROR] agent.auto_config: AutoEncrypt.Sign RPC failed: addr=10.4.0.12:8300 error="rpcinsecure: err
or making call: Permission denied: anonymous token lacks permission 'node:write' on \"fenn\". The anonymous token is used implicitly when a request does not specify
a token."
Apr 12 13:45:06 fenn consul[328873]: 2025-04-12T13:45:06.240-0400 [ERROR] agent.auto_config: AutoEncrypt.Sign RPC failed: addr=10.4.0.13:8300 error="rpcinsecure: error making call: rpcinsecure: error making call: Permission denied: anonymous token lacks permission 'node:write' on \"fenn\". The anonymous token is used implicitly when a request does not specify a token."
Apr 12 13:45:06 fenn consul[328873]: 2025-04-12T13:45:06.240-0400 [ERROR] agent.auto_config: AutoEncrypt.Sign RPC failed: addr=10.4.0.13:8300 error="rpcinsecure: error making call: rpcinsecure: error making call: Permission denied: anonymous token lacks permission 'node:write' on \"fenn\". The anonymous token is used implicitly when a request does not specify a token."
Apr 12 13:45:06 fenn consul[328873]: 2025-04-12T13:45:06.240-0400 [ERROR] agent.auto_config: No servers successfully responded to the auto-encrypt request
Apr 12 13:45:06 fenn consul[328873]: 2025-04-12T13:45:06.255-0400 [ERROR] agent.auto_config: AutoEncrypt.Sign RPC failed: addr=10.4.0.11:8300 error="rpcinsecure: error making call: rpcinsecure: error making call: Permission denied: anonymous token lacks permission 'node:write' on \"fenn\". The anonymous token is used implicitly when a request does not specify a token."
Apr 12 13:45:06 fenn consul[328873]: 2025-04-12T13:45:06.263-0400 [ERROR] agent.auto_config: AutoEncrypt.Sign RPC failed: addr=10.4.0.12:8300 error="rpcinsecure: error making call: Permission denied: anonymous token lacks permission 'node:write' on \"fenn\". The anonymous token is used implicitly when a request does not specify a token."
Apr 12 13:45:06 fenn consul[328873]: 2025-04-12T13:45:06.277-0400 [ERROR] agent.auto_config: AutoEncrypt.Sign RPC failed: addr=10.4.0.13:8300 error="rpcinsecure: error making call: rpcinsecure: error making call: Permission denied: anonymous token lacks permission 'node:write' on \"fenn\". The anonymous token is used implicitly when a request does not specify a token."
Apr 12 13:45:06 fenn consul[328873]: 2025-04-12T13:45:06.277-0400 [ERROR] agent.auto_config: No servers successfully responded to the auto-encrypt request
Apr 12 13:45:07 fenn consul[328873]: 2025-04-12T13:45:07.508-0400 [ERROR] agent.auto_config: AutoEncrypt.Sign RPC failed: addr=10.4.0.11:8300 error="rpcinsecure: error making call: rpcinsecure: error making call: Permission denied: anonymous token lacks permission 'node:write' on \"fenn\". The anonymous token is used implicitly when a request does not specify a token."
Apr 12 13:45:07 fenn consul[328873]: 2025-04-12T13:45:07.515-0400 [ERROR] agent.auto_config: AutoEncrypt.Sign RPC failed: addr=10.4.0.12:8300 error="rpcinsecure: error making call: Permission denied: anonymous token lacks permission 'node:write' on \"fenn\". The anonymous token is used implicitly when a request does not specify a token."
Apr 12 13:45:07 fenn consul[328873]: 2025-04-12T13:45:07.538-0400 [ERROR] agent.auto_config: AutoEncrypt.Sign RPC failed: addr=10.4.0.13:8300 error="rpcinsecure: error making call: rpcinsecure: error making call: Permission denied: anonymous token lacks permission 'node:write' on \"fenn\". The anonymous token is used implicitly when a request does not specify a token."
Apr 12 13:45:07 fenn consul[328873]: 2025-04-12T13:45:07.538-0400 [ERROR] agent.auto_config: No servers successfully responded to the auto-encrypt request
It seemed that the token would not be persisted on the client node after running consul acl set-agent-token agent <acl-token-secret-id>, even though I have enable_token_persistence set to true. As a result, I needed to go back and set it in the consul.hcl configuration file.
The fiddliness of the ACL bootstrapping also led me to split that out into a separate Ansible role.
Vault
As long as I'm setting up Consul, I figure I might as well set up Vault too.
This wasn't that bad, compared to the experience I had with ACLs in Consul. I set up a KMS key for unsealing, generated a certificate authority and regenerated TLS assets for my three server nodes, and the Consul storage backend works seamlessly.
Vault Cluster Architecture
Deployment Configuration
The Vault cluster runs on three Raspberry Pi nodes: bettley, cargyll, and dalt. This provides high availability with automatic leader election and fault tolerance.
Key Design Decisions:
- Storage Backend: Consul (not Raft) - leverages existing Consul cluster for data persistence
- Auto-Unsealing: AWS KMS integration eliminates manual unsealing after restarts
- TLS Everywhere: Full mutual TLS with Step-CA integration
- Service Integration: Deep integration with Consul service discovery
AWS KMS Auto-Unsealing
Rather than managing unseal keys manually, I implemented AWS KMS auto-unsealing through Terraform:
KMS Key Configuration (terraform/modules/vault_seal/kms.tf):
resource "aws_kms_key" "vault_seal" {
  description             = "KMS key for managing the Goldentooth vault seal"
  key_usage               = "ENCRYPT_DECRYPT"
  enable_key_rotation     = true
  deletion_window_in_days = 30
}

resource "aws_kms_alias" "vault_seal" {
  name          = "alias/goldentooth/vault-seal"
  target_key_id = aws_kms_key.vault_seal.key_id
}
This provides:
- Automatic unsealing on service restart
- Key rotation managed by AWS
- Audit trail through CloudTrail
- No manual intervention required for cluster recovery
Vault Server Configuration
Core Settings
The main Vault configuration demonstrates production-ready patterns:
ui                                  = true
cluster_addr                        = "https://{{ ipv4_address }}:8201"
api_addr                            = "https://{{ ipv4_address }}:8200"
disable_mlock                       = true
cluster_name                        = "goldentooth"
enable_response_header_raft_node_id = true
log_level                           = "debug"
Key Features:
- Web UI enabled for administrative access
- Per-node cluster addressing using individual IP addresses
- Memory lock disabled (appropriate for container/Pi environments)
- Debug logging for troubleshooting and development
Storage Backend: Consul Integration
storage "consul" {
  address           = "{{ ipv4_address }}:8500"
  check_timeout     = "5s"
  consistency_mode  = "strong"
  path              = "vault/"
  token             = "{{ vault_consul_token.token.SecretID }}"
}
The Consul storage backend provides:
- Strong consistency for data integrity
- Leveraged infrastructure - reuses existing Consul cluster
- ACL integration with dedicated Consul tokens
- Service discovery through Consul's native mechanisms
TLS Configuration
listener "tcp" {
  address                             = "{{ ipv4_address }}:8200"
  tls_cert_file                       = "/opt/vault/tls/tls.crt"
  tls_key_file                        = "/opt/vault/tls/tls.key"
  tls_require_and_verify_client_cert  = true
  telemetry {
    unauthenticated_metrics_access = true
  }
}
Security Features:
- Mutual TLS required for all client connections
- Step-CA certificates with multiple Subject Alternative Names
- Automatic certificate renewal via systemd timers
- Telemetry access for monitoring without authentication
Certificate Management Integration
Step-CA Integration
Vault certificates are issued by the cluster's Step-CA with comprehensive SAN coverage:
Certificate Attributes:
vault.service.consul- Service discovery namelocalhost- Local access- Node hostname (e.g.,
bettley.nodes.goldentooth.net) - Node IP address (e.g.,
10.4.0.11)
Renewal Automation:
[Service]
Environment=CERT_LOCATION=/opt/vault/tls/tls.crt \
            KEY_LOCATION=/opt/vault/tls/tls.key

# Restart Vault service after certificate renewal
ExecStartPost=/usr/bin/env sh -c "! systemctl --quiet is-active vault.service || systemctl try-reload-or-restart vault.service"
Certificate Lifecycle
- Validity: 24 hours (short-lived certificates)
- Renewal: Automatic via
cert-renewer@vault.timer - Service Integration: Automatic Vault restart after renewal
- CLI Management:
goldentooth rotate_vault_certs
Consul Backend Configuration
Dedicated ACL Policy
Vault nodes use dedicated Consul ACL tokens with specific permissions:
key_prefix "vault/" {
  policy = "write"
}

service "vault" {
  policy = "write"
}

agent_prefix "" {
  policy = "read"
}

session_prefix "" {
  policy = "write"
}
This provides:
- Minimal permissions for Vault's operational needs
- Isolated key space under
vault/prefix - Service registration capabilities
- Session management for locking mechanisms
Security and Service Configuration
Systemd Hardening
[Service]
User=vault
Group=vault
SecureBits=keep-caps
AmbientCapabilities=CAP_IPC_LOCK
CapabilityBoundingSet=CAP_SYSLOG CAP_IPC_LOCK
NoNewPrivileges=yes
Security Measures:
- Dedicated user/group isolation
- Capability restrictions - only IPC_LOCK and SYSLOG
- Memory locking capability for sensitive data
- No privilege escalation permitted
Environment Security
AWS credentials for KMS access are managed through environment files:
AWS_ACCESS_KEY_ID={{ vault.aws.access_key_id }}
AWS_SECRET_ACCESS_KEY={{ vault.aws.secret_access_key }}
AWS_REGION={{ vault.aws.region }}
- File permissions: 0600 (owner read/write only)
- Encrypted at rest in Ansible vault
- Least privilege IAM policies for KMS access only
Monitoring and Observability
Prometheus Integration
telemetry {
  prometheus_retention_time = "24h"
  usage_gauge_period = "10m"
  maximum_gauge_cardinality = 500
  enable_hostname_label = true
  lease_metrics_epsilon = "1h"
  num_lease_metrics_buckets = 168
  add_lease_metrics_namespace_labels = false
  filter_default = true
  disable_hostname = true
}
Metrics Features:
- 24-hour retention for operational metrics
- 10-minute usage gauges for capacity planning
- Hostname labeling for per-node identification
- Lease metrics with weekly granularity (168 buckets)
- Unauthenticated metrics access for Prometheus scraping
Command Line Integration
goldentooth CLI Commands
# Deploy and configure Vault cluster
goldentooth setup_vault

# Rotate TLS certificates
goldentooth rotate_vault_certs

# Edit encrypted secrets
goldentooth edit_vault
Environment Configuration
For Vault CLI operations:
export VAULT_ADDR=https://{{ ipv4_address }}:8200
export VAULT_CLIENT_CERT=/opt/vault/tls/tls.crt
export VAULT_CLIENT_KEY=/opt/vault/tls/tls.key
External Secrets Integration
Kubernetes Integration
The cluster includes External Secrets Operator (v0.9.13) for Kubernetes secrets management:
- Namespace:
external-secrets - Management: Argo CD GitOps deployment
- Integration: Direct Vault API access for secret retrieval
- Use Cases: Database credentials, API keys, TLS certificates
Directory Structure
/opt/vault/                 # Base directory
├── tls/                   # TLS certificates
│   ├── tls.crt           # Server certificate (Step-CA issued)
│   └── tls.key           # Private key
├── data/                 # Data directory (unused with Consul backend)
└── raft/                 # Raft storage (unused with Consul backend)

/etc/vault.d/              # Configuration directory
├── vault.hcl             # Main configuration
└── vault.env             # Environment variables (AWS credentials)
High Availability and Operations
Cluster Behavior
- Leader Election: Automatic through Consul backend
- Split-Brain Protection: Consul quorum requirements
- Rolling Updates: One node at a time with certificate renewal
- Disaster Recovery: AWS KMS auto-unsealing enables rapid recovery
Operational Patterns
Health Checks: Consul health checks monitor Vault API availability
Service Discovery: vault.service.consul provides load balancing
Monitoring: Prometheus metrics for capacity and performance monitoring
Logging: systemd journal integration with structured logging
That said, I haven't actually put anything into it yet, so the real test will come when I start using it for secrets management across the cluster infrastructure. The External Secrets integration provides the foundation for Kubernetes secrets management, while the Consul integration enables broader service authentication.
Envoy
I would like to replace Nginx with an edge routing solution of Envoy + Consul. Consul is setup, so let's get cracking on Envoy.
Unfortunately, it doesn't work out of the box:
$ envoy --version
external/com_github_google_tcmalloc/tcmalloc/system-alloc.cc:625] MmapAligned() failed - unable to allocate with tag (hint, size, alignment) - is something limiting address placement? 0x17f840000000 1073741824 1073741824 @ 0x5560994c54 0x5560990f40 0x5560990830 0x5560971b6c 0x556098de00 0x556098dbd0 0x5560966e60 0x55608964ec 0x556089314c 0x556095e340 0x7fa24a77fc
external/com_github_google_tcmalloc/tcmalloc/arena.cc:58] FATAL ERROR: Out of memory trying to allocate internal tcmalloc data (bytes, object-size); is something preventing mmap from succeeding (sandbox, VSS limitations)? 131072 632 @ 0x5560994fb8 0x5560971bfc 0x556098de00 0x556098dbd0 0x5560966e60 0x55608964ec 0x556089314c 0x556095e340 0x7fa24a77fc
Aborted
That's because of this issue.
I don't really have the horsepower on these Pis to compile Envoy, and I don't want to recompile the kernel, so for the time being I think I'll need to run a special build of Envoy in Docker. Unfortunately, I can't find a version that both 1) runs on Raspberry Pis, and 2) is compatible with a current version of Consul, so I think I'm kinda screwed for the moment.
Cross-Compilation Investigation
To solve the tcmalloc issue, I attempted to cross-compile Envoy v1.32.0 for ARM64 with --define tcmalloc=disabled on Velaryon (the x86 node). This would theoretically produce a Raspberry Pi-compatible binary without the memory alignment problems.
Setup Completed
- ✅ Created cross-compilation toolkit with ARM64 toolchain (
aarch64-linux-gnu-gcc) - ✅ Built containerized build environment with Bazel 6.5.0 (required by Envoy)
- ✅ Verified ARM64 cross-compilation works for simple C programs
- ✅ Confirmed Envoy source has ARM64 configurations (
//bazel:linux_aarch64) - ✅ Found Envoy's CI system officially supports ARM64 builds
Fundamental Blocker
All cross-compilation attempts failed with the same error:
cc_toolchain_suite '@local_config_cc//:toolchain' does not contain a toolchain for cpu 'aarch64'
The root cause is a version compatibility gap:
- Envoy v1.32.0 requires Bazel 6.5.0 for compatibility
- Bazel 6.5.0 predates built-in ARM64 toolchain support
- Envoy's CI likely uses custom Docker images with pre-configured ARM64 toolchains
Attempts Made
- Custom cross-compilation setup - Blocked by missing Bazel ARM64 toolchain
- Platform-based approach - Wrong platform type (
config_settingvsplatform) - CPU-based configuration - Same toolchain issue
- Official Envoy CI approach - Same fundamental Bazel limitation
Verdict
Cross-compiling Envoy for ARM64 would require either:
- Creating custom Bazel ARM64 toolchain definitions (complex, undocumented)
- Finding Envoy's exact CI Docker environment (may not be public)
- Upgrading to newer Bazel (likely breaks Envoy v1.32.0 compatibility)
The juice isn't worth the squeeze. For edge routing on Raspberry Pi, simpler alternatives exist:
- nginx (lightweight, excellent ARM64 support)
- HAProxy (proven load balancer, ARM64 packages available)
- Traefik (modern proxy, native ARM64 builds)
- Caddy (simple reverse proxy, ARM64 support)
Step-CA
Apparently, another thing I did recently was to set up Nomad, but I didn't take any notes about it.
That's not really that big of a deal, though, because what I need to do is to get Nomad and Consul and Vault working together, and currently they aren't.
This is complicated by the fact that if I do want AutoEncrypt working between Nomad and Consul, the two have to have a certificate chain proceeding from either 1) the same root certificate, or 2) different root certificates that have cross-signed. Currently, Vault has its own root certificate that I generate from scratch with the Ansible x509 tools, and then Nomad and Consul generate their own certificates using the built-in tools.
This seems messy, so it's probably time to dive into some kind of meaningful, long-term TLS infrastructure.
The choice seemed fairly clear: step-ca. Although I hadn't used it before, I'd flirted with it a time or two and it seemed to be fairly straightforward.
I poked around a bit in other people's implementations and pilfered them ruthlessly (I've bought Max Hösel a couple coffees and I'm crediting him, never fear). I don't really need the full range of his features (and they are wonderful, it's really a lovely collection), so I cribbed the basic flow.
Once that's done, we have a few new Ansible playbooks:
apt_smallstep: Configure the Smallstep Apt repository.install_step_ca: Installstep-caandstep-clion the CA node (which I've set to be Jast, the tenth node).install_step_cli: Performed on all nodes.init_cluster_ca: Initialize the certificate authority on the CA node.bootstrap_cluster_ca: Install the root certificate in the trust store on every node.zap_cluster_ca: To clean up, just nuke every file in thestep-cadata directory.
The playbooks mentioned above get us most of the way there, but we need to revisit some of the places we've generated certificates (Vault, Consul, and Nomad) and integrate them into this system.
Refactoring HashiApp certificate management.
As it turned out, doing that involved refactor a good amount of my Ansible IaC. One thing I've learned about code quality:
Can you make the change easily? If so, make the change. If not, fix the most obvious obstacle, then reevaluate.
In this case, the change in question was to use the step CLI tool to generate certificates signed by the step-ca root certificate authority for services like Nomad, Vault, and Consul.
I knew immediately this would not be an easy change to make, just because of how I had written my Ansible roles. I had adopted conventional patterns for these roles, even though I knew they were not for general use and I didn't really have much intention of distributing them. Conventional patterns included naming variables expecting them to be reused across modules, etc. So I would declare variables in a general fashion within the defaults/main.yaml and then override them within my inventory's group_vars and host_vars.
I now consider this to be a mistake. In reality, the modules weren't really designed cleanly; there were a lot of assumptions based on my own use cases that I baked into the modules, and that affected which modules I declared, etc. So yeah, I had an Ansible role to set up Slurm, but it was by no means general enough to actually help most people set up Slurm. It just gathered together a lot of tasks that I found appropriate that had to do with setting up Slurm.
Nevertheless, I persisted for a while. Mostly, I think, out of a belief that I should at least pay lip service to community style guidelines.
This task, getting Nomad and Consul and Vault working with TLS courtesy of step-ca, was my breaking point. There was just too much crap that needed to be renamed, just to maintain the internal consistency of an increasingly clumsy architecture intended to please people who didn't notice and almost surely wouldn't care if they had.
So, TL;DR: there was a great reduction in redundancy and I shifted to specifying variables in dictionaries rather than distinctly-named snake-cased variables that reminded me a little too much of Java naming conventions.
Configuring HashiApps to use Step-CA
Once refactoring was done, configuring the apps to use Step-CA was mostly straightforward. A single step command was needed to generate the certificates, then another Ansible block to adjust the permissions and ownership of the generated files. For our labors, we're eventually greeted with Consul, Vault, and Nomad running exactly as they had before, but secured by a coherent certificate chain that can span all Goldentooth services.
Ray
Finally, we're getting back to something that's associated directly with machine learning: Ray.
It would be normal to opt for KubeRay here, since I am actually running Kubernetes on Goldentooth, but I'm not normal 🤷♂️ Instead, I'll be going with the on-prem approach, which... has some implications.
First of these is that I need to install Conda on every node. This is fine and probably something I should've already done anyway, just as a normal matter of course. Except I kind of did as part of setting up Slurm. Which, yeah, probably means a refactor is in order.
So let's install and configure Conda, then setup a Ray cluster!

TL;DR: The attempt on my life has left me scarred and deformed.
So, that ended up being a major pain in the ass. The conda-forge channel didn't have builds of Ray for aarch64, so I needed to configure the defaults channel. Once the correct packages were installed, I encountered mysterious issues where the Ray dashboard wouldn't start up, causing the entire service to crash. It turned out, after prolonged debugging, that the Ray dashboard was apparently segfaulting because of issues with a grpcio wheel – not sure if it was built improperly, or what.
After figuring that out, I managed to get the cluster up, but still encountered issues. Well, the cluster was running Ray 2.46.0, and my MBP was running 2.7.0, so... that checks out. Unfortunately, I was attempting to follow MadeWithML based on a recommendation, and there were no Pi builds available for 2.7.0.
So I updated the MadeWithML project to use 2.46.0, brute-force-ishly, and that worked - for a time, but then incompatibilities started popping up. So I guess MadeWithML and my cluster weren't meant to be together.
Nevertheless, I do have a somewhat functioning Ray cluster, so I'm going to call this a victory (the only one I can) and move on.
Grafana
This, the next "article" (on Loki), and the successive one (on Vector), are occurring mostly in parallel so that I can validate these services as I go.
I (minimally) set up Vector first, then Loki, then Grafana, just to verify I could pass info around in some coherent fashion and see it in Grafana. However, that's not really sufficient.
The fact is that I'm not really experienced with Grafana. I've used it to debug things, I've installed and managed it, I've created and updated dashboards, etc. But I don't have a deep understanding of it or its featureset.
At work, we use Datadog. I love Datadog. Datadog has incredible features and a wonderful user interface. Datadog makes more money than I do, and costs more than I can afford. Also, they won't hire me, but I'm not bitter. The fact is that they don't really have a hobbyist tier, or at least not one that makes a ten-node cluster affordable.
At work, I prioritize observability. I rely heavily on logs, metrics, and traces to do my job. In my work on Goldentooth, I've been neglecting that. I've been using journalctl to review logs and debug services, and that's a pretty poor experience. It's recently become very, very clear that I need to have a better system here, and that means learning how to use Grafana and how to configure it best for my needs.
So, yeah, Grafana.
Grafana
My initial installation was bog-standard, basic Grafana. Not a thing changed. It worked! Okay, let's make it better.
The first thing I did was to throw that SQLite DB on a tmpfs. I'm not really concerned enough about the volume or load to consider moving to something like PostgreSQL, but 1) it also doesn't matter if I keep logs/metrics past a reboot, and 2) it's probably good to avoid any writes to the SD card that I can.
Next thing was to create a new repository, grafana-dashboards, to manage dashboards. I want a bunch of these dudes and it's better to manage them in a separate repository than in Ansible itself. I checked it out via Git, added a script to sync the repo every so often, added that to cron.
Of course, then I needed a dashboard to test it out, so I grabbed a nice one to incorporate data from Prometheus Node Exporter here. (Thanks, Ricardo F!)
Then I had to connect Grafana to Prometheus Node Exporter, then I realized I was missing a couple of command-line arguments in my Prometheus Node Exporter Helm chart that were nice to have, so I added those to the Argo CD Application, re-synced the app, etc, and finally things started showing up.
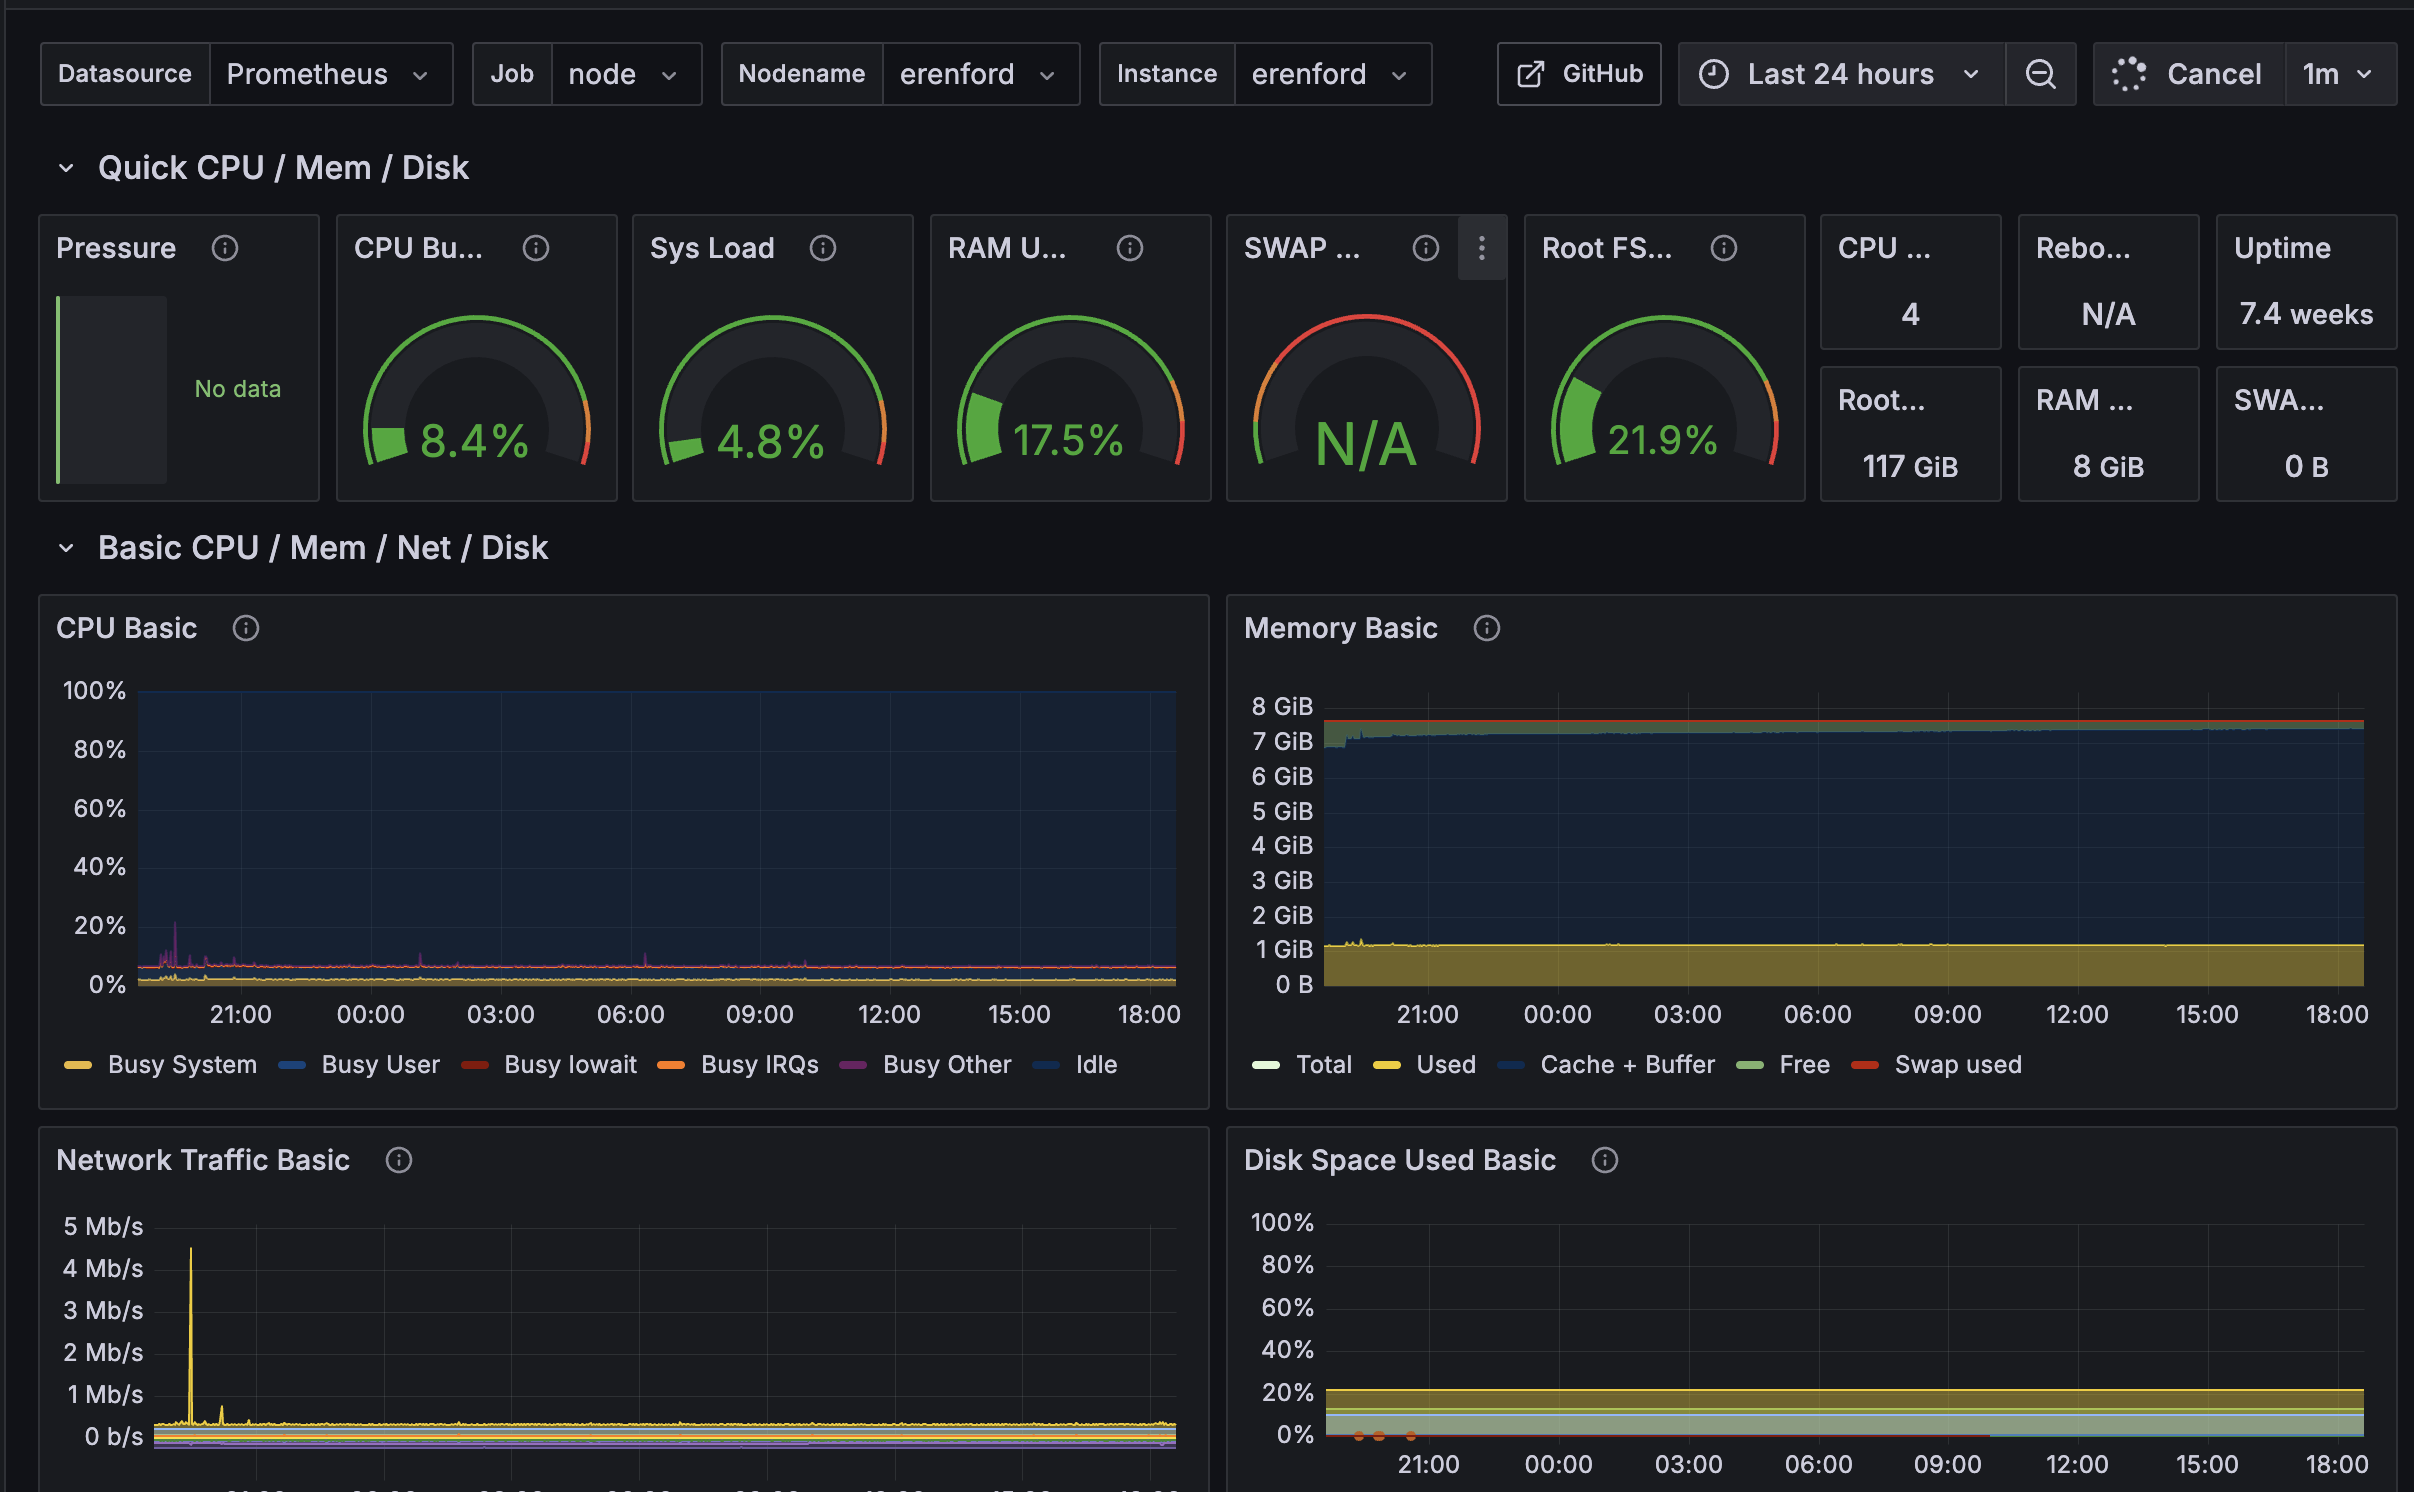
Pretty cool, I think.
Grafana Implementation Details
tmpfs Database Configuration
The first optimization I implemented was mounting the Grafana data directory on tmpfs to avoid SD card writes:
- name: 'Manage the mount for the Grafana data directory.'
  ansible.posix.mount:
    path: '/var/lib/grafana'
    src: 'tmpfs'
    fstype: 'tmpfs'
    opts: 'size=100M,mode=0755'
    state: 'present'
This configuration:
- Avoids SD card wear: Eliminates database writes to flash storage
- Improves performance: RAM-based storage for faster access
- Ephemeral data: Acceptable for a lab environment where persistence across reboots isn't critical
- Size limit: 100MB allocation prevents memory exhaustion
TLS Configuration
I finished up by adding comprehensive TLS support to Grafana using Step-CA integration:
Server Configuration (in grafana.ini):
[server]
protocol = https
http_addr = {{ ipv4_address }}
http_port = 3000
cert_file = {{ grafana.cert_path }}
cert_key = {{ grafana.key_path }}

[grpc_server]
use_tls = true
cert_file = {{ grafana.cert_path }}
key_file = {{ grafana.key_path }}
Certificate Management:
- Source: Step-CA issued certificates with 24-hour validity
- Renewal: Automatic via
cert-renewer@grafana.timer - Service Integration: Automatic Grafana restart after certificate renewal
- Paths:
/opt/grafana/tls/tls.crtand/opt/grafana/tls/tls.key
Dashboard Repository Management
Next thing was to create a new repository, grafana-dashboards, to manage dashboards externally:
Repository Integration:
- name: 'Check out the Grafana dashboards repository.'
  ansible.builtin.git:
    repo: "https://github.com/{{ cluster.github.organization }}/{{ grafana.provisioners.dashboards.repository_name }}.git"
    dest: '/var/lib/grafana/dashboards'
  become_user: 'grafana'
Dashboard Provisioning (provisioners.dashboards.yaml):
apiVersion: 1
providers:
  - name: "grafana-dashboards"
    orgId: 1
    type: file
    folder: ''
    disableDeletion: false
    updateIntervalSeconds: 15
    allowUiUpdates: true
    options:
      path: /var/lib/grafana/dashboards
      foldersFromFilesStructure: true
Automatic Dashboard Updates
I added a script to sync the repository periodically via cron:
Update Script (/usr/local/bin/grafana-update-dashboards.sh):
#!/usr/bin/env bash
dashboard_path="/var/lib/grafana/dashboards"
cd "${dashboard_path}"
git fetch --all
git reset --hard origin/master
git pull
Cron Integration: Updates every 15 minutes to keep dashboards current with the repository
Data Source Provisioning
The Prometheus integration is configured through automatic data source provisioning:
datasources:
  - name: 'Prometheus'
    type: 'prometheus'
    access: 'proxy'
    url: http://{{ groups['prometheus'] | first }}:9090
    jsonData:
      httpMethod: POST
      manageAlerts: true
      prometheusType: Prometheus
      cacheLevel: 'High'
      disableRecordingRules: false
      incrementalQueryOverlapWindow: 10m
This configuration:
- Automatic discovery: Uses Ansible inventory to find Prometheus server
- High performance: POST method and high cache level for better performance
- Alert management: Enables Grafana to manage Prometheus alerts
- Query optimization: 10-minute overlap window for incremental queries
Advanced Monitoring Integration
Loki Integration for State History:
[unified_alerting.state_history]
backend = "multiple"
primary = "loki"
loki_remote_url = "https://{{ groups['loki'] | first }}:3100"
This enables:
- Alert state history: Stored in Loki for long-term retention
- Multi-backend support: Primary storage in Loki with annotations fallback
- HTTPS integration: Secure communication with Loki using Step-CA certificates
Security and Authentication
Password Management:
- name: 'Reset Grafana admin password.'
  ansible.builtin.command:
    cmd: grafana-cli admin reset-admin-password "{{ grafana.admin_password }}"
Security Headers: The configuration includes comprehensive security settings:
- TLS enforcement: HTTPS-only communication
- Cookie security: Secure cookie settings for HTTPS
- Content security: XSS protection and content type options enabled
Service Integration
Certificate Renewal Automation:
[Service]
Environment=CERT_LOCATION=/opt/grafana/tls/tls.crt \
            KEY_LOCATION=/opt/grafana/tls/tls.key

# Restart Grafana service after certificate renewal
ExecStartPost=/usr/bin/env sh -c "! systemctl --quiet is-active grafana.service || systemctl try-reload-or-restart grafana.service"
Systemd Integration:
- Service runs as dedicated
grafanauser - Automatic startup and dependency management
- Integration with cluster-wide certificate renewal system
Dashboard Ecosystem
Of course, then I needed a dashboard to test it out, so I grabbed a nice one to incorporate data from Prometheus Node Exporter here. (Thanks, Ricardo F!)
The dashboard management system provides:
- Version control: All dashboards tracked in Git
- Automatic updates: Regular synchronization from repository
- Folder organization: File system structure maps to Grafana folders
- Community integration: Easy incorporation of community dashboards
Monitoring Stack Integration
Then I had to connect Grafana to Prometheus Node Exporter, then I realized I was missing a couple of command-line arguments in my Prometheus Node Exporter Helm chart that were nice to have, so I added those to the Argo CD Application, re-synced the app, etc, and finally things started showing up.
Node Exporter Enhancement:
- Additional collectors:
--collector.systemd,--collector.processes - GitOps deployment: Changes managed through Argo CD
- Automatic synchronization: Dashboard updates reflect new metrics immediately
This comprehensive Grafana setup provides a production-ready observability platform that integrates seamlessly with the broader goldentooth monitoring ecosystem, combining security, automation, and extensibility.
Loki
This, the previous "article" (on Grafana), and the next one (on Vector), are occurring mostly in parallel so that I can validate these services as I go.
Loki is... there's a whole lot going on there.
Log Retention Configuration
I enabled a retention policy so that my logs wouldn't grow without bound until the end of time. This coincided with me noticing that my /var/log/journal directories had gotten up to about 4GB, which led me to perform a similar change in the journald configuration.
Retention Policy Configuration:
limits_config:
  retention_period: 168h  # 7 days

compactor:
  working_directory: /tmp/retention
  compaction_interval: 10m
  retention_enabled: true
  retention_delete_delay: 2h
  retention_delete_worker_count: 5
  delete_request_store: filesystem
I reduced the retention_delete_worker_count from 150 to 5 🙂 This optimization:
- Reduces resource usage: Less CPU overhead on Raspberry Pi nodes
- Maintains efficiency: 5 workers sufficient for 7-day retention window
- Prevents overload: Avoids overwhelming the Pi's limited resources
Consul Integration for Ring Management
I also configured Loki to use Consul as its ring kvstore, which involved sketching out an ACL policy and generating a token, but nothing too weird. (Assuming that it works.)
Ring Configuration:
common:
  ring:
    kvstore:
      store: consul
      consul:
        acl_token: {{ loki_consul_token }}
        host: {{ ipv4_address }}:8500
Consul ACL Policy (loki.policy.hcl):
key_prefix "collectors/" {
  policy = "write"
}

key_prefix "loki/" {
  policy = "write"
}
This integration provides:
- Service discovery: Automatic discovery of Loki components
- Consistent hashing: Proper ring distribution for ingester scaling
- High availability: Shared state management across cluster nodes
- Security: ACL-based access control to Consul KV store
Comprehensive TLS Configuration
The next several hours involved cleanup after I rashly configured Loki to use TLS. I didn't know that I'd then need to configure Loki to communicate with itself via TLS, and that I would have to do so in several different places and that those places would have different syntax for declaring the same core ideas (CA cert, TLS cert, TLS key).
Server TLS Configuration
GRPC and HTTP Server:
server:
  grpc_listen_address: {{ ipv4_address }}
  grpc_listen_port: 9096
  grpc_tls_config: &http_tls_config
    cert_file: "{{ loki.cert_path }}"
    key_file: "{{ loki.key_path }}"
    client_ca_file: "{{ step_ca.root_cert_path }}"
    client_auth_type: "VerifyClientCertIfGiven"
  http_listen_address: {{ ipv4_address }}
  http_listen_port: 3100
  http_tls_config: *http_tls_config
TLS Features:
- Mutual TLS: Client certificate verification when provided
- Step-CA Integration: Uses cluster certificate authority
- YAML Anchors: Reuses TLS config across components to reduce duplication
Component-Level TLS Configuration
Frontend Configuration:
frontend:
  grpc_client_config: &grpc_client_config
    tls_enabled: true
    tls_cert_path: "{{ loki.cert_path }}"
    tls_key_path: "{{ loki.key_path }}"
    tls_ca_path: "{{ step_ca.root_cert_path }}"
  tail_tls_config:
    tls_cert_path: "{{ loki.cert_path }}"
    tls_key_path: "{{ loki.key_path }}"
    tls_ca_path: "{{ step_ca.root_cert_path }}"
Pattern Ingester TLS:
pattern_ingester:
  metric_aggregation:
    loki_address: {{ ipv4_address }}:3100
    use_tls: true
    http_client_config:
      tls_config:
        ca_file: "{{ step_ca.root_cert_path }}"
        cert_file: "{{ loki.cert_path }}"
        key_file: "{{ loki.key_path }}"
Internal Component Communication
The configuration ensures TLS across all internal communications:
- Ingester Client:
grpc_client_config: *grpc_client_config - Frontend Worker:
grpc_client_config: *grpc_client_config - Query Scheduler:
grpc_client_config: *grpc_client_config - Ruler: Uses separate alertmanager client TLS config
And holy crap, the Loki site is absolutely awful for finding and understanding where some configuration is needed.
Advanced Configuration Features
Pattern Recognition and Analytics
Pattern Ingester:
pattern_ingester:
  enabled: true
  metric_aggregation:
    loki_address: {{ ipv4_address }}:3100
    use_tls: true
This enables:
- Log pattern detection: Automatic recognition of log patterns
- Metric generation: Convert log patterns to Prometheus metrics
- Performance insights: Understanding log volume and patterns
Schema and Storage Configuration
TSDB Schema (v13):
schema_config:
  configs:
    - from: 2020-10-24
      store: tsdb
      object_store: filesystem
      schema: v13
      index:
        prefix: index_
        period: 24h
Storage Paths:
common:
  path_prefix: /tmp/loki
  storage:
    filesystem:
      chunks_directory: /tmp/loki/chunks
      rules_directory: /tmp/loki/rules
Query Performance Optimization
Caching Configuration:
query_range:
  results_cache:
    cache:
      embedded_cache:
        enabled: true
        max_size_mb: 20
Performance Features:
- Embedded cache: 20MB query result cache for faster repeated queries
- Protobuf encoding: Efficient data serialization for frontend communication
- Concurrent streams: 1000 max concurrent GRPC streams
Certificate Management Integration
Automatic Certificate Renewal:
[Service]
Environment=CERT_LOCATION={{ loki.cert_path }} \
KEY_LOCATION={{ loki.key_path }}
# Restart Loki service after certificate renewal
ExecStartPost=/usr/bin/env sh -c "! systemctl --quiet is-active loki.service || systemctl try-reload-or-restart loki.service"
Certificate Lifecycle:
- 24-hour validity: Short-lived certificates for enhanced security
- Automatic renewal:
cert-renewer@loki.timerhandles renewal - Service restart: Seamless certificate updates with service reload
- Step-CA integration: Consistent with cluster-wide PKI infrastructure
Monitoring and Alerting Integration
Ruler Configuration:
ruler:
alertmanager_url: http://{{ ipv4_address }}:9093
alertmanager_client:
tls_cert_path: "{{ loki.cert_path }}"
tls_key_path: "{{ loki.key_path }}"
tls_ca_path: "{{ step_ca.root_cert_path }}"
Observability Features:
- Structured logging: JSON format for better parsing
- Debug logging: Detailed logging for troubleshooting
- Request logging: Log requests at info level for monitoring
- Grafana integration: Primary storage for alert state history
Deployment Architecture
Single-Node Deployment: Currently deployed on inchfield node
Replication Factor: 1 (appropriate for single-node setup)
Resource Optimization: Configured for Raspberry Pi resource constraints
Integration Points:
- Vector: Log shipping from all cluster nodes
- Grafana: Log visualization and alerting
- Prometheus: Metrics scraping from Loki endpoints
This comprehensive Loki configuration provides a production-ready log aggregation platform with enterprise-grade security, retention management, and integration capabilities, despite the complexity of getting all the TLS configurations properly aligned across the numerous internal components.
Vector
This and the two previous "articles" (on Grafana and on Vector) are occurring mostly in parallel so that I can validate these services as I go.
The main thing I wanted to do immediately with Vector was hook up more sources. A couple were turnkey (journald, kubernetes_logs, internal_logs) but most were just log files. These latter are not currently parsed according to any specific format, so I'll need to revisit this and extract as much information as possible from each.
It would also be good for me to inject some more fields into this that are set on a per-node level. I already have hostname, but I should probably inject IP address, etc, and anything else I can think of.
Other than that, it doesn't really seem like there's a lot to discuss here. Vector's cool, though. And in the future, I should remember that adding a whole bunch of log files into Vector from ten nodes, all at once, is not a great idea, as it will flood the Loki sink...
New Server!
Today I saw Beyond NanoGPT: Go From LLM Beginner to AI Researcher! on HackerNews, and while I'm less interested than most in LLMs specifically, I'm still interested.
The notes included the following:
The codebase will generally work with either a CPU or GPU, but most implementations basically require a GPU as they will be untenably slow otherwise. I recommend either a consumer laptop with GPU, paying for Colab/Runpod, or simply asking a compute provider or local university for a compute grant if those are out of budget (this works surprisingly well, people are very generous).
If this was expected to be slow on a standard CPU, it'd probably be unbearable (or not run at all) on a Pi, so this gave me pause 🤔
Fortunately, I had a solution. I have an extra PC that's a few years old but still relatively beefy (a Ryzen 9 3900X (12 cores) with 32GB RAM and an RTX 2070 Super). I built it as a VR PC and my kid and I haven't played VR in quite a while, so... it's just kinda sitting there. But it occurred to me that it was probably sufficiently powerful to run most of Beyond NanoGPT, and if it struggled with anything I might be able to upgrade to an RTX 4XXX or 5XXX.
Of course, this single machine by itself dominates the rest of Goldentooth, so I'll need to take some steps to minimize its usefulness.
Setup
I installed Ubuntu 24.04, which I felt was probably a decent parity for the Raspberry Pi OS on Goldentooth. Perhaps I should've installed Ubuntu on the Pis as well, but hindsight is 20/20 and I don't have enough complaints about RPOS to switch now. At some point, SD cards are going to start dropping like flies and I'll probably make the switch at that time.
The installation itself was over in a flash, quickly enough that I thought something might've failed. Admittedly, it's been a while since I've installed Ubuntu Server Minimal on a modern-ish PC.
After that, I just needed to lug the damned thing down to the basement, wire it in, and start running Ansible playbooks on it to set it up. A few minutes later:

Hello, Velaryon!
Oh, and install Nvidia's kernel modules and other tools. None of that was particularly difficult, although it was a tad more irritating than it should've been.
Once I had the GPU showing up, and the relevant tools and libraries installed, I wanted to verify that I could actually run things on the GPU, so I checked out NVIDIA's cuda-samples and built 'em.
With that done:
🐠nathan@velaryon:~/cuda-samples/build/Samples/1_Utilities/deviceQueryDrv
$ ./deviceQueryDrv
./deviceQueryDrv Starting...
CUDA Device Query (Driver API) statically linked version
Detected 1 CUDA Capable device(s)
Device 0: "NVIDIA GeForce RTX 2070 SUPER"
CUDA Driver Version: 12.9
CUDA Capability Major/Minor version number: 7.5
Total amount of global memory: 7786 MBytes (8164081664 bytes)
(40) Multiprocessors, ( 64) CUDA Cores/MP: 2560 CUDA Cores
GPU Max Clock rate: 1770 MHz (1.77 GHz)
Memory Clock rate: 7001 Mhz
Memory Bus Width: 256-bit
L2 Cache Size: 4194304 bytes
Max Texture Dimension Sizes 1D=(131072) 2D=(131072, 65536) 3D=(16384, 16384, 16384)
Maximum Layered 1D Texture Size, (num) layers 1D=(32768), 2048 layers
Maximum Layered 2D Texture Size, (num) layers 2D=(32768, 32768), 2048 layers
Total amount of constant memory: 65536 bytes
Total amount of shared memory per block: 49152 bytes
Total number of registers available per block: 65536
Warp size: 32
Maximum number of threads per multiprocessor: 1024
Maximum number of threads per block: 1024
Max dimension size of a thread block (x,y,z): (1024, 1024, 64)
Max dimension size of a grid size (x,y,z): (2147483647, 65535, 65535)
Texture alignment: 512 bytes
Maximum memory pitch: 2147483647 bytes
Concurrent copy and kernel execution: Yes with 3 copy engine(s)
Run time limit on kernels: No
Integrated GPU sharing Host Memory: No
Support host page-locked memory mapping: Yes
Concurrent kernel execution: Yes
Alignment requirement for Surfaces: Yes
Device has ECC support: Disabled
Device supports Unified Addressing (UVA): Yes
Device supports Managed Memory: Yes
Device supports Compute Preemption: Yes
Supports Cooperative Kernel Launch: Yes
Supports MultiDevice Co-op Kernel Launch: Yes
Device PCI Domain ID / Bus ID / location ID: 0 / 45 / 0
Compute Mode:
< Default (multiple host threads can use ::cudaSetDevice() with device simultaneously) >
Result = PASS
Not the sexiest thing I've ever seen, but it's a step in the right direction.
Kubernetes
Again, I only want this machine to run in very limited circumstances. I figure it'll make a nice box for cross-compiling, and for running GPU-heavy workloads when necessary, but otherwise I want it to stay in the background.
After I added it to the Kubernetes cluster:
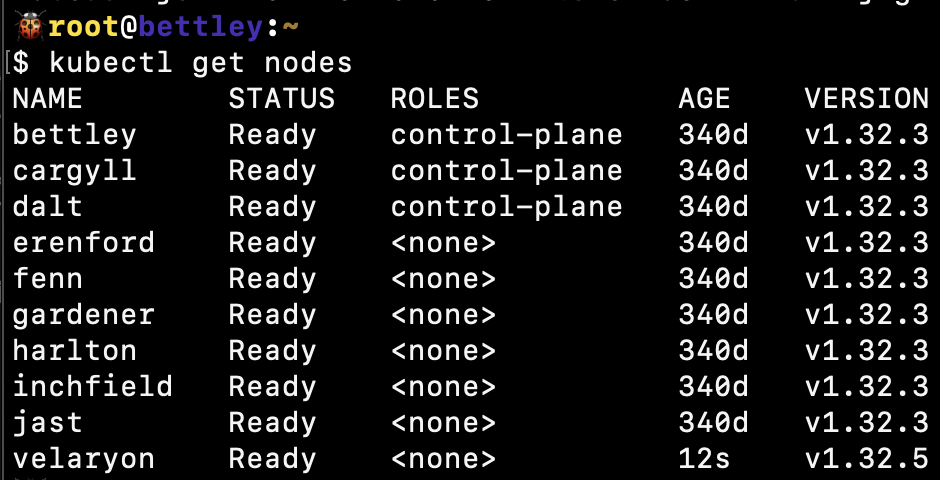
I tainted it to prevent standard pods from being scheduled on it:
kubectl taint nodes velaryon gpu=true:NoSchedule
and labeled it so that pods requiring a GPU would be scheduled on it:
kubectl label nodes velaryon gpu=true arch=amd64
Now, any pod I wish to run on this node should have the following:
tolerations:
- key: "gpu"
operator: "Equal"
value: "true"
effect: "NoSchedule"
nodeSelector:
gpu: "true"
Nomad
A similar tweak was needed for the nomad.hcl config:
{% if clean_hostname in groups['nomad_client'] -%}
client {
enabled = true
node_class = "{{ nomad.client.node_class }}"
meta {
arch = "{{ ansible_architecture }}"
gpu = "{{ 'true' if 'gpu' == nomad.client.node_class else 'false' }}"
}
}
{% endif %}
I think this will work for a constraint:
constraint {
attribute = "${node.class}"
operator = "="
value = "gpu"
}
But I haven't tried it yet.
After applying, we see the class show up:
🐠root@velaryon:~
$ nomad node status
ID Node Pool DC Name Class Drain Eligibility Status
76ff3ff3 default dc1 velaryon gpu false eligible ready
30ffab50 default dc1 inchfield default false eligible ready
db6ae26b default dc1 gardener default false eligible ready
02174920 default dc1 jast default false eligible ready
9ffa31f3 default dc1 fenn default false eligible ready
01f0cd94 default dc1 harlton default false eligible ready
793b9a5a default dc1 erenford default false eligible ready
Other than that, it should get the standard complement of features - Vector, Consul, etc. I initially set up Slurm, then undid it; I felt it would just complicate matters.
New Rack!
I poked around a bit and realized that I had two extra Raspberry Pi 4B+'s, so I ended up spending an absolutely absurd amount of money to build a 10" rack and get all of the existing and new Pis into it, along with some fans, 5V and 12V power supplies, a 16-port switch, etc. It was absolutely ridiculous and I would not recommend this course of action to anyone, and I'll never financially recover from this.
The main goal of this was to take my existing Picocluster (which was screwed together and looked nice and... well, was already paid for) and have something where I could pull out an individual Pi and replace or repair it if I needed. Another issue was that I didn't really have any substantial external storage, e.g. SSDs.
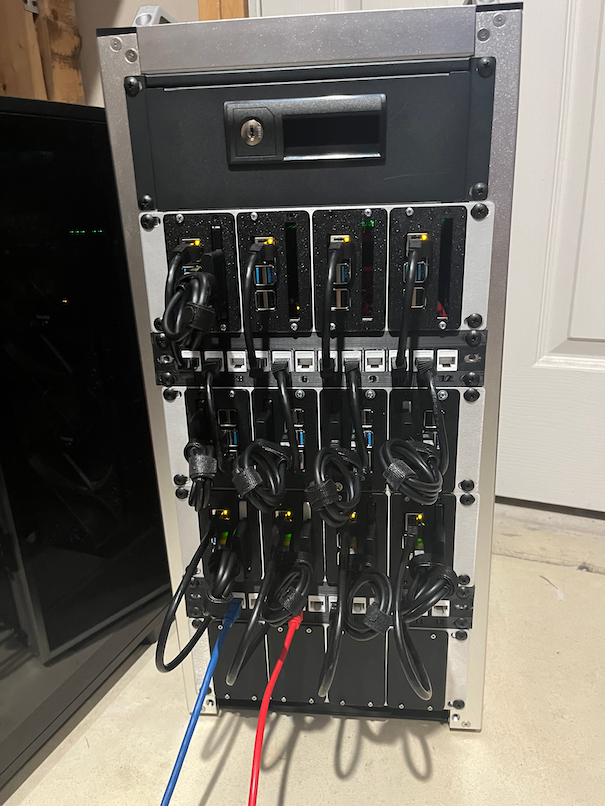
I've been playing with some other things recently, and have delayed updating this too much. I was intending my current focus to be the next article in this clog, but I think it's going to take quite a lot longer (and will likely be the subject of a great many articles), so I think in the meantime I need to return to the subject of the actual cluster and progress it along.
TLS Certificate Renewal
So some time back I configured step-ca to generate TLS certificates for various services, but I gave the certs very short lifetimes and didn't set up renewal, so... whenever I step away from the cluster for a few days, everything breaks 🙃
Today's goal is to fix that.
$ consul members
Error retrieving members: Get "http://127.0.0.1:8500/v1/agent/members?segment=_all": dial tcp 127.0.0.1:8500: connect: connection refused
Indeed, very little is working.
Fortunately, step-ca provides good instructions for dealing with this sort of situation. I created a cert-renewer@service file:
[Unit]
Description=Certificate renewer for %I
After=network-online.target
Documentation=https://smallstep.com/docs/step-ca/certificate-authority-server-production
StartLimitIntervalSec=0
; PartOf=cert-renewer.target
[Service]
Type=oneshot
User=root
Environment=STEPPATH=/etc/step-ca \
CERT_LOCATION=/etc/step/certs/%i.crt \
KEY_LOCATION=/etc/step/certs/%i.key
; ExecCondition checks if the certificate is ready for renewal,
; based on the exit status of the command.
; (In systemd <242, you can use ExecStartPre= here.)
ExecCondition=/usr/bin/step certificate needs-renewal ${CERT_LOCATION}
; ExecStart renews the certificate, if ExecStartPre was successful.
ExecStart=/usr/bin/step ca renew --force ${CERT_LOCATION} ${KEY_LOCATION}
; Try to reload or restart the systemd service that relies on this cert-renewer
; If the relying service doesn't exist, forge ahead.
; (In systemd <229, use `reload-or-try-restart` instead of `try-reload-or-restart`)
ExecStartPost=/usr/bin/env sh -c "! systemctl --quiet is-active %i.service || systemctl try-reload-or-restart %i"
[Install]
WantedBy=multi-user.target
and cert-renewer@.timer:
[Unit]
Description=Timer for certificate renewal of %I
Documentation=https://smallstep.com/docs/step-ca/certificate-authority-server-production
; PartOf=cert-renewer.target
[Timer]
Persistent=true
; Run the timer unit every 5 minutes.
OnCalendar=*:1/5
; Always run the timer on time.
AccuracySec=1us
; Add jitter to prevent a "thundering hurd" of simultaneous certificate renewals.
RandomizedDelaySec=1m
[Install]
WantedBy=timers.target
and the necessary Ansible to throw it into place, and synced that over.
Then I created an overrides file for Consul:
[Service]
; `Environment=` overrides are applied per environment variable. This line does not
; affect any other variables set in the service template.
Environment=CERT_LOCATION={{ consul.cert_path }} \
KEY_LOCATION={{ consul.key_path }}
WorkingDirectory={{ consul.key_path | dirname }}
; Restart Consul service after certificate renewal
ExecStartPost=/usr/bin/env sh -c "! systemctl --quiet is-active consul.service || systemctl try-reload-or-restart consul.service"
Unfortunately, I couldn't build the update the Consul configuration because the TLS certs had expired:
TASK [goldentooth.setup_consul : Create a Consul agent policy for each node.] ****************************************************
Wednesday 16 July 2025 18:43:18 -0400 (0:00:57.623) 0:01:24.371 ********
skipping: [bettley]
skipping: [cargyll]
skipping: [dalt]
FAILED - RETRYING: [allyrion -> bettley]: Create a Consul agent policy for each node. (3 retries left).
FAILED - RETRYING: [harlton -> bettley]: Create a Consul agent policy for each node. (3 retries left).
FAILED - RETRYING: [erenford -> bettley]: Create a Consul agent policy for each node. (3 retries left).
FAILED - RETRYING: [inchfield -> bettley]: Create a Consul agent policy for each node. (3 retries left).
FAILED - RETRYING: [velaryon -> bettley]: Create a Consul agent policy for each node. (3 retries left).
FAILED - RETRYING: [jast -> bettley]: Create a Consul agent policy for each node. (3 retries left).
FAILED - RETRYING: [karstark -> bettley]: Create a Consul agent policy for each node. (3 retries left).
FAILED - RETRYING: [fenn -> bettley]: Create a Consul agent policy for each node. (3 retries left).
FAILED - RETRYING: [gardener -> bettley]: Create a Consul agent policy for each node. (3 retries left).
FAILED - RETRYING: [lipps -> bettley]: Create a Consul agent policy for each node. (3 retries left).
FAILED - RETRYING: [allyrion -> bettley]: Create a Consul agent policy for each node. (2 retries left).
FAILED - RETRYING: [harlton -> bettley]: Create a Consul agent policy for each node. (2 retries left).
FAILED - RETRYING: [erenford -> bettley]: Create a Consul agent policy for each node. (2 retries left).
FAILED - RETRYING: [jast -> bettley]: Create a Consul agent policy for each node. (2 retries left).
FAILED - RETRYING: [inchfield -> bettley]: Create a Consul agent policy for each node. (2 retries left).
FAILED - RETRYING: [velaryon -> bettley]: Create a Consul agent policy for each node. (2 retries left).
FAILED - RETRYING: [fenn -> bettley]: Create a Consul agent policy for each node. (2 retries left).
FAILED - RETRYING: [gardener -> bettley]: Create a Consul agent policy for each node. (2 retries left).
FAILED - RETRYING: [karstark -> bettley]: Create a Consul agent policy for each node. (2 retries left).
FAILED - RETRYING: [lipps -> bettley]: Create a Consul agent policy for each node. (2 retries left).
FAILED - RETRYING: [allyrion -> bettley]: Create a Consul agent policy for each node. (1 retries left).
FAILED - RETRYING: [harlton -> bettley]: Create a Consul agent policy for each node. (1 retries left).
FAILED - RETRYING: [erenford -> bettley]: Create a Consul agent policy for each node. (1 retries left).
FAILED - RETRYING: [fenn -> bettley]: Create a Consul agent policy for each node. (1 retries left).
FAILED - RETRYING: [jast -> bettley]: Create a Consul agent policy for each node. (1 retries left).
FAILED - RETRYING: [inchfield -> bettley]: Create a Consul agent policy for each node. (1 retries left).
FAILED - RETRYING: [velaryon -> bettley]: Create a Consul agent policy for each node. (1 retries left).
FAILED - RETRYING: [gardener -> bettley]: Create a Consul agent policy for each node. (1 retries left).
FAILED - RETRYING: [lipps -> bettley]: Create a Consul agent policy for each node. (1 retries left).
FAILED - RETRYING: [karstark -> bettley]: Create a Consul agent policy for each node. (1 retries left).
fatal: [allyrion -> bettley]: FAILED! => changed=false
attempts: 3
msg: Could not connect to consul agent at bettley:8500, error was <urlopen error [Errno 111] Connection refused>
fatal: [harlton -> bettley]: FAILED! => changed=false
attempts: 3
msg: Could not connect to consul agent at bettley:8500, error was <urlopen error [Errno 111] Connection refused>
fatal: [erenford -> bettley]: FAILED! => changed=false
attempts: 3
msg: Could not connect to consul agent at bettley:8500, error was <urlopen error [Errno 111] Connection refused>
fatal: [fenn -> bettley]: FAILED! => changed=false
attempts: 3
msg: Could not connect to consul agent at bettley:8500, error was <urlopen error [Errno 111] Connection refused>
fatal: [jast -> bettley]: FAILED! => changed=false
attempts: 3
msg: Could not connect to consul agent at bettley:8500, error was <urlopen error [Errno 111] Connection refused>
fatal: [inchfield -> bettley]: FAILED! => changed=false
attempts: 3
msg: Could not connect to consul agent at bettley:8500, error was <urlopen error [Errno 111] Connection refused>
fatal: [velaryon -> bettley]: FAILED! => changed=false
attempts: 3
msg: Could not connect to consul agent at bettley:8500, error was <urlopen error [Errno 111] Connection refused>
fatal: [gardener -> bettley]: FAILED! => changed=false
attempts: 3
msg: Could not connect to consul agent at bettley:8500, error was <urlopen error [Errno 111] Connection refused>
fatal: [karstark -> bettley]: FAILED! => changed=false
attempts: 3
msg: Could not connect to consul agent at bettley:8500, error was <urlopen error [Errno 111] Connection refused>
fatal: [lipps -> bettley]: FAILED! => changed=false
attempts: 3
msg: Could not connect to consul agent at bettley:8500, error was <urlopen error [Errno 111] Connection refused>
And it was then that I noticed that the dates on all of the Raspberry Pis were off by about 8 days 😑. I'd never set up NTP. A quick Ansible playbook later, every Pi agrees on the same date and time, but now:
● consul.service - "HashiCorp Consul"
Loaded: loaded (/etc/systemd/system/consul.service; enabled; preset: enabled)
Active: active (running) since Wed 2025-07-16 18:51:09 EDT; 13s ago
Docs: https://www.consul.io/
Main PID: 733215 (consul)
Tasks: 9 (limit: 8737)
Memory: 19.4M
CPU: 551ms
CGroup: /system.slice/consul.service
└─733215 /usr/bin/consul agent -config-dir=/etc/consul.d
Jul 16 18:51:09 bettley consul[733215]: gRPC TLS: Verify Incoming: true, Min Version: TLSv1_2
Jul 16 18:51:09 bettley consul[733215]: Internal RPC TLS: Verify Incoming: true, Verify Outgoing: true (Verify Hostname: true), Min Version: TLSv1_2
Jul 16 18:51:09 bettley consul[733215]: ==> Log data will now stream in as it occurs:
Jul 16 18:51:09 bettley consul[733215]: 2025-07-16T18:51:09.903-0400 [WARN] agent: skipping file /etc/consul.d/consul.env, extension must be .hcl or .json, or config format must be set
Jul 16 18:51:09 bettley consul[733215]: 2025-07-16T18:51:09.903-0400 [WARN] agent: bootstrap_expect > 0: expecting 3 servers
Jul 16 18:51:09 bettley consul[733215]: 2025-07-16T18:51:09.963-0400 [WARN] agent.auto_config: skipping file /etc/consul.d/consul.env, extension must be .hcl or .json, or config format must be set
Jul 16 18:51:09 bettley consul[733215]: 2025-07-16T18:51:09.963-0400 [WARN] agent.auto_config: bootstrap_expect > 0: expecting 3 servers
Jul 16 18:51:09 bettley consul[733215]: 2025-07-16T18:51:09.966-0400 [WARN] agent: keyring doesn't include key provided with -encrypt, using keyring: keyring=WAN
Jul 16 18:51:09 bettley consul[733215]: 2025-07-16T18:51:09.967-0400 [ERROR] agent: startup error: error="refusing to rejoin cluster because server has been offline for more than the configured server_rejoin_age_max (168h0m0s) - consider wiping your data dir"
Jul 16 18:51:19 bettley consul[733215]: 2025-07-16T18:51:19.968-0400 [ERROR] agent: startup error: error="refusing to rejoin cluster because server has been offline for more than the configured server_rejoin_age_max (168h0m0s) - consider wiping your data dir"
It won't rebuild the cluster because it's been offline too long 🙃 So I had to zap a file on the nodes:
$ goldentooth command bettley,cargyll,dalt 'sudo rm -rf /opt/consul/server_metadata.json*'
dalt | CHANGED | rc=0 >>
bettley | CHANGED | rc=0 >>
cargyll | CHANGED | rc=0 >>
and then I was able to restart the cluster.
As it turned out, I had to rotate the Consul certificates anyway, since they were invalid, but I think it's working now. I've shortened the cert lifetime to 24 hours, so I should find out pretty quickly 🙂
After that, it's the same procedure (rotate the certs, then re-setup the app and install the cert renewal timer) for Grafana, Loki, Nomad, Vault, and Vector.
SSH Certificates
So remember back in chapter 32 when I set up Step-CA as our internal certificate authority? Step-CA also handle SSH certificates, which allows a less peer-to-peer model for authenticating between nodes. I'd actually tried to set these up before and it was an enormous pain in the pass and didn't really work well, so when I saw Step-CA included it in its featureset, I was excited.
It's very easy to allow authorized_keys to grow without bound, and I'm fairly sure very few people actually read these messages:
The authenticity of host 'wtf.node.goldentooth.net (192.168.10.51)' can't be established.
ED25519 key fingerprint is SHA256:8xKJ5Fw6K+YFGxqR5EWsM4w3t5Y7MzO1p3G9kPvXHDo.
This key is not known by any other names.
Are you sure you want to continue connecting (yes/no/[fingerprint])?
So I wanted something that would allow seamless interconnection between the nodes while maintaining good security.
SSH certificates solve both of these problems elegantly. Instead of managing individual keys, you have a certificate authority that signs certificates. For user authentication, the SSH server trusts the CA's public key. For host authentication, your SSH client trusts the CA's public key.
It's basically the same model as TLS certificates, but for SSH. And since we already have Step-CA running, why not use it?
The Implementation
I created an Ansible role called goldentooth.setup_ssh_certificates to handle all of this. Let me walk through what it does.
Setting Up the CA Trust
First, we need to grab the SSH CA public keys from our Step-CA server. There are actually two different keys - one for signing user certificates and one for signing host certificates:
- name: 'Get SSH User CA public key'
ansible.builtin.slurp:
src: "{{ step_ca.ca.etc_path }}/certs/ssh_user_ca_key.pub"
register: 'ssh_user_ca_key_b64'
delegate_to: "{{ step_ca.server }}"
run_once: true
become: true
- name: 'Get SSH Host CA public key'
ansible.builtin.slurp:
src: "{{ step_ca.ca.etc_path }}/certs/ssh_host_ca_key.pub"
register: 'ssh_host_ca_key_b64'
delegate_to: "{{ step_ca.server }}"
run_once: true
become: true
Then we configure sshd to trust certificates signed by our User CA:
- name: 'Configure sshd to trust User CA'
ansible.builtin.lineinfile:
path: '/etc/ssh/sshd_config'
regexp: '^#?TrustedUserCAKeys'
line: 'TrustedUserCAKeys /etc/ssh/ssh_user_ca.pub'
state: 'present'
validate: '/usr/sbin/sshd -t -f %s'
notify: 'reload sshd'
Host Certificates
For host certificates, we generate a certificate for each node that includes multiple principals (names the certificate is valid for):
- name: 'Generate SSH host certificate'
ansible.builtin.shell:
cmd: |
step ssh certificate \
--host \
--sign \
--force \
--no-password \
--insecure \
--provisioner="{{ step_ca.default_provisioner.name }}" \
--provisioner-password-file="{{ step_ca.default_provisioner.password_path }}" \
--principal="{{ ansible_hostname }}" \
--principal="{{ ansible_hostname }}.{{ cluster.node_domain }}" \
--principal="{{ ansible_hostname }}.{{ cluster.domain }}" \
--principal="{{ ansible_default_ipv4.address }}" \
--ca-url="https://{{ hostvars[step_ca.server].ipv4_address }}:9443" \
--root="{{ step_ca.root_cert_path }}" \
--not-after=24h \
{{ ansible_hostname }} \
/etc/step/certs/ssh_host.key.pub
Automatic Certificate Renewal
Notice the --not-after=24h? Yeah, these certificates expire daily. Which means it's very important that the automatic renewal works 😀
Enter systemd timers:
[Unit]
Description=Timer for SSH host certificate renewal
Documentation=https://smallstep.com/docs/step-cli/reference/ssh/certificate
[Timer]
OnBootSec=5min
OnUnitActiveSec=15min
RandomizedDelaySec=5min
[Install]
WantedBy=timers.target
This runs every 15 minutes (with some randomization to avoid thundering herd problems). The service itself checks if the certificate needs renewal before actually doing anything:
# Check if certificate needs renewal
ExecCondition=/usr/bin/step certificate needs-renewal /etc/step/certs/ssh_host.key-cert.pub
User Certificates
For user certificates, I set up both root and my regular user account. The process is similar - generate a certificate with appropriate principals:
- name: 'Generate root user SSH certificate'
ansible.builtin.shell:
cmd: |
step ssh certificate \
--sign \
--force \
--no-password \
--insecure \
--provisioner="{{ step_ca.default_provisioner.name }}" \
--provisioner-password-file="{{ step_ca.default_provisioner.password_path }}" \
--principal="root" \
--principal="{{ ansible_hostname }}-root" \
--ca-url="https://{{ hostvars[step_ca.server].ipv4_address }}:9443" \
--root="{{ step_ca.root_cert_path }}" \
--not-after=24h \
root@{{ ansible_hostname }} \
/etc/step/certs/root_ssh_key.pub
Then configure SSH to actually use the certificate:
- name: 'Configure root SSH to use certificate'
ansible.builtin.blockinfile:
path: '/root/.ssh/config'
create: true
owner: 'root'
group: 'root'
mode: '0600'
block: |
Host *
CertificateFile /etc/step/certs/root_ssh_key-cert.pub
IdentityFile /etc/step/certs/root_ssh_key
marker: '# {mark} ANSIBLE MANAGED BLOCK - SSH CERTIFICATE'
The Trust Configuration
For the client side, we need to tell SSH to trust host certificates signed by our CA:
- name: 'Configure SSH client to trust Host CA'
ansible.builtin.lineinfile:
path: '/etc/ssh/ssh_known_hosts'
line: "@cert-authority * {{ ssh_host_ca_key }}"
create: true
owner: 'root'
group: 'root'
mode: '0644'
And since we're all friends here in the cluster, I disabled strict host key checking for cluster nodes:
- name: 'Disable StrictHostKeyChecking for cluster nodes'
ansible.builtin.blockinfile:
path: '/etc/ssh/ssh_config'
block: |
Host *.{{ cluster.node_domain }} *.{{ cluster.domain }}
StrictHostKeyChecking no
UserKnownHostsFile /dev/null
marker: '# {mark} ANSIBLE MANAGED BLOCK - CLUSTER SSH CONFIG'
Is this less secure? Technically yes. Do I care? Not really. These are all nodes in my internal cluster that I control. The certificates provide the actual authentication.
The Results
After running the playbook, I can now SSH between any nodes in the cluster without passwords or key management:
root@bramble-ca:~# ssh bramble-01
Welcome to Ubuntu 24.04.1 LTS (GNU/Linux 6.8.0-1017-raspi aarch64)
...
Last login: Sat Jul 19 00:15:23 2025 from 192.168.10.50
root@bramble-01:~#
No host key verification prompts. No password prompts. Just instant access.
And the best part? I can verify that certificates are being used:
root@bramble-01:~# ssh-keygen -L -f /etc/step/certs/ssh_host.key-cert.pub
/etc/step/certs/ssh_host.key-cert.pub:
Type: ssh-ed25519-cert-v01@openssh.com host certificate
Public key: ED25519-CERT SHA256:M5PQn6zVH7xJL+OFQzH4yVwR5EHrF2xQPm9QR5xKXBc
Signing CA: ED25519 SHA256:gNPpOqPsZW6YZDmhWQWqJ4l+L8E5Xgg8FQyAAbPi7Ss (using ssh-ed25519)
Key ID: "bramble-01"
Serial: 8485811653946933657
Valid: from 2025-07-18T20:13:42 to 2025-07-19T20:14:42
Principals:
bramble-01
bramble-01.node.goldentooth.net
bramble-01.goldentooth.net
192.168.10.51
Critical Options: (none)
Extensions: (none)
Look at that! The certificate is valid for exactly 24 hours and includes all the names I might use to connect to this host.
ZFS and Replication
So remember back in chapters 28 and 31 when I set up NFS exports using a USB thumbdrive? Obviously my crowning achievement as an infrastructure engineer.
After living with that setup for a bit, I finally got my hands on some SSDs. Not new ones, mind you – these are various drives I've accumulated over the years. Eight of them, to be precise:
- 3x 120GB SSDs
- 3x ~450GB SSDs
- 2x 1TB SSDs
Time to do something more serious with storage.
The Storage Strategy
I spent way too much time researching distributed storage options. GlusterFS? Apparently dead. Lustre? Way overkill for a Pi cluster, and the complexity-to-benefit ratio is terrible. BeeGFS? Same story.
So I decided to split the drives across three different storage systems:
- ZFS for the 3x 120GB drives – rock solid, great snapshot support, and I already know it
- Ceph for the 3x 450GB drives – the gold standard for distributed block storage in Kubernetes
- SeaweedFS for the 2x 1TB drives – interesting distributed object storage that's simpler than MinIO
Today we're tackling ZFS, because I actually have experience with it and it seemed like the easiest place to start.
The ZFS Setup
I created a role called goldentooth.setup_zfs to handle all of this. The basic idea is to set up ZFS on nodes that have SSDs attached, create datasets for shared storage, and then use Sanoid for snapshot management and Syncoid for replication between nodes.
First, let's install ZFS and configure it for the Pi's limited RAM:
- name: 'Install ZFS.'
ansible.builtin.apt:
name:
- 'zfsutils-linux'
- 'zfs-dkms'
- 'zfs-zed'
- 'sanoid'
state: 'present'
update_cache: true
- name: 'Configure ZFS Event Daemon.'
ansible.builtin.lineinfile:
path: '/etc/zfs/zed.d/zed.rc'
regexp: '^#?ZED_EMAIL_ADDR='
line: 'ZED_EMAIL_ADDR="{{ my.email }}"'
notify: 'Restart ZFS-zed service.'
- name: 'Limit ZFS ARC to 128MB of RAM.'
ansible.builtin.lineinfile:
path: '/etc/modprobe.d/zfs.conf'
line: 'options zfs zfs_arc_max=1073741824'
create: true
notify: 'Update initramfs.'
That ARC limit is important – by default ZFS will happily eat half your RAM for caching, which is not great when you only have 8GB to start with.
Creating the Pool
The pool creation is straightforward. I'm not doing anything fancy like RAID-Z because I only have one SSD per node:
- name: 'Create ZFS pool.'
ansible.builtin.command: |
zpool create {{ zfs.pool.name }} {{ zfs.pool.device }}
args:
creates: "/{{ zfs.pool.name }}"
when: ansible_hostname == 'allyrion'
Wait, why when: ansible_hostname == 'allyrion'? Well, it turns out I'm only creating the pool on the primary node. The other nodes will receive the data via replication. This is a bit different from a typical ZFS setup where each node would have its own pool, but it makes sense for my use case.
Sanoid for Snapshots
Sanoid is a fantastic tool for managing ZFS snapshots. It handles creating snapshots on a schedule and pruning old ones according to a retention policy. The configuration is pretty simple:
# Primary dataset for source snapshots
[{{ zfs.pool.name }}/{{ zfs.datasets[0].name }}]
use_template = production
recursive = yes
autosnap = yes
autoprune = yes
[template_production]
frequently = 0
hourly = 36
daily = 30
monthly = 3
yearly = 0
autosnap = yes
autoprune = yes
This keeps 36 hourly snapshots, 30 daily snapshots, and 3 monthly snapshots. No yearly snapshots because, let's be honest, this cluster probably won't last that long without me completely rebuilding it.
Syncoid for Replication
Here's where it gets interesting. Syncoid is Sanoid's companion tool that handles ZFS replication. It's basically a smart wrapper around zfs send and zfs receive that handles all the complexity of incremental replication.
I set up systemd services and timers to handle the replication:
[Unit]
Description=Syncoid ZFS replication to %i
After=zfs-import.target
Requires=zfs-import.target
[Service]
Type=oneshot
ExecStart=/usr/sbin/syncoid --no-privilege-elevation {{ zfs.pool.name }}/{{ zfs.datasets[0].name }} root@%i:{{ zfs.pool.name }}/{{ zfs.datasets[0].name }}
StandardOutput=journal
StandardError=journal
The %i is systemd template magic – it gets replaced with whatever comes after the @ in the service name. So syncoid@bramble-01.service would replicate to bramble-01.
The timer runs every 15 minutes:
[Unit]
Description=Syncoid ZFS replication to %i timer
Requires=syncoid@%i.service
[Timer]
OnCalendar=*:0/15
RandomizedDelaySec=60
Persistent=true
SSH Configuration for Replication
Of course, Syncoid needs to SSH between nodes to do the replication. Initially, I tried to set this up with a separate SSH key for ZFS replication. That turned into such a mess that it actually motivated me to finally implement SSH certificates properly (see the previous chapter).
After setting up SSH certificates, I could simplify the configuration to just reference the certificates:
- name: 'Configure SSH config for ZFS replication using certificates.'
ansible.builtin.blockinfile:
path: '/root/.ssh/config'
create: true
mode: '0600'
block: |
# ZFS replication configuration using SSH certificates
{% for host in groups['zfs'] %}
{% if host != inventory_hostname %}
Host {{ host }}
HostName {{ hostvars[host]['ipv4_address'] }}
User root
CertificateFile /etc/step/certs/root_ssh_key-cert.pub
IdentityFile /etc/step/certs/root_ssh_key
StrictHostKeyChecking no
UserKnownHostsFile /dev/null
{% endif %}
{% endfor %}
Much cleaner! No more key management, just point to the certificates that are already being automatically renewed. Sometimes a little pain is exactly what you need to motivate doing things the right way.
The Topology
The way I set this up, only the first node in the zfs group (allyrion) actually creates datasets and takes snapshots. The other nodes just receive replicated data:
- name: 'Enable and start Syncoid timers for replication targets.'
ansible.builtin.systemd:
name: "syncoid@{{ item }}.timer"
enabled: true
state: 'started'
loop: "{{ groups['zfs'] | reject('eq', inventory_hostname) | list }}"
when:
- groups['zfs'] | length > 1
- inventory_hostname == groups['zfs'][0] # Only run on first ZFS node (allyrion)
This creates a hub-and-spoke topology where allyrion is the primary and replicates to all other ZFS nodes. It's not the most resilient topology (if allyrion dies, no new snapshots), but it's simple and works for my needs.
Does It Work?
Let's check using the goldentooth CLI:
$ goldentooth command allyrion 'zfs list'
allyrion | CHANGED | rc=0 >>
NAME USED AVAIL REFER MOUNTPOINT
rpool 546K 108G 24K /rpool
rpool/data 53K 108G 25K /data
Nice! The pool is there. Now let's look at snapshots:
$ goldentooth command allyrion 'zfs list -t snapshot'
allyrion | CHANGED | rc=0 >>
NAME USED AVAIL REFER MOUNTPOINT
rpool/data@autosnap_2025-07-18_18:13:17_monthly 0B - 24K -
rpool/data@autosnap_2025-07-18_18:13:17_daily 0B - 24K -
rpool/data@autosnap_2025-07-18_18:13:17_hourly 0B - 24K -
rpool/data@autosnap_2025-07-18_19:00:03_hourly 0B - 24K -
rpool/data@autosnap_2025-07-18_20:00:10_hourly 0B - 24K -
...
rpool/data@autosnap_2025-07-19_14:00:15_hourly 0B - 24K -
rpool/data@syncoid_allyrion_2025-07-19:10:45:32-GMT-04:00 0B - 25K -
Excellent! Sanoid is creating snapshots hourly, daily, and monthly. That last snapshot with the "syncoid" prefix shows that replication is happening too.
And on the replica nodes? Let me check which nodes have ZFS:
$ goldentooth command gardener 'zfs list'
gardener | CHANGED | rc=0 >>
NAME USED AVAIL REFER MOUNTPOINT
rpool 600K 108G 25K /rpool
rpool/data 53K 108G 25K /rpool/data
The replica has the same dataset structure. And the snapshots?
$ goldentooth command gardener 'zfs list -t snapshot | head -5'
gardener | CHANGED | rc=0 >>
NAME USED AVAIL REFER MOUNTPOINT
rpool/data@autosnap_2025-07-18_18:13:17_monthly 0B - 24K -
rpool/data@autosnap_2025-07-18_18:13:17_daily 0B - 24K -
rpool/data@autosnap_2025-07-18_18:13:17_hourly 0B - 24K -
rpool/data@autosnap_2025-07-18_19:00:03_hourly 0B - 24K -
Perfect! The snapshots are being replicated from allyrion to gardener. The replication is working.
Performance
How's the performance? Well... it's ZFS on a single SSD connected to a Raspberry Pi. It's not going to win any benchmarks:
$ goldentooth command_root allyrion 'dd if=/dev/zero of=/data/test bs=1M count=100'
allyrion | CHANGED | rc=0 >>
100+0 records in
100+0 records out
104857600 bytes (105 MB, 100 MiB) copied, 0.205277 s, 511 MB/s
511 MB/s writes! That's... actually surprisingly good for a Pi with a SATA SSD over USB3. Clearly the ZFS caching is helping here, but even so, that's plenty fast for shared configuration files, build artifacts, and other cluster data.
Expanding the Kubernetes Cluster
With the Goldentooth cluster continuing to evolve, it was time to bring two more nodes into the Kubernetes fold... Karstark and Lipps, two Raspberry Pi 4Bs (4GB) that were just kinda sitting around.
The Current State
Before the expansion, our Kubernetes cluster consisted of:
- Control Plane (3 nodes): bettley, cargyll, dalt
- Workers (7 nodes): erenford, fenn, gardener, harlton, inchfield, jast, velaryon
Karstark and Lipps were already fully integrated into the cluster infrastructure:
- Both were part of the Consul service mesh as clients
- Both were configured as Nomad clients for workload scheduling
- Both were included in other cluster services like Ray and Slurm
However, they weren't yet part of the Kubernetes cluster, which meant we were missing out on their compute capacity for containerized workloads.
Installing Kubernetes Packages
The first step was to ensure both nodes had the necessary Kubernetes packages installed. Using the goldentooth CLI:
ansible-playbook -i inventory/hosts playbooks/install_k8s_packages.yaml --limit karstark,lipps
This playbook handled:
- Installing and configuring containerd as the container runtime
- Installing kubeadm, kubectl, and kubelet packages
- Setting up proper systemd cgroup configuration
- Enabling and starting the kubelet service
Both nodes successfully installed Kubernetes v1.32.7, which was slightly newer than the existing cluster nodes running v1.32.3.
The Challenge: Certificate Issues
When attempting to use the standard goldentooth bootstrap_k8s command, we ran into certificate verification issues. The bootstrap process was timing out when trying to communicate with the Kubernetes API server.
The error manifested as:
tls: failed to verify certificate: x509: certificate signed by unknown authority
This is a common issue in clusters that have been running for a while (393 days in our case) and have undergone certificate rotations or updates.
The Solution: Manual Join Process
Instead of relying on the automated bootstrap, I took a more direct approach:
-
Generate a join token from the control plane:
goldentooth command_root bettley "kubeadm token create --print-join-command" -
Execute the join command on both nodes:
goldentooth command_root karstark,lipps "kubeadm join 10.4.0.10:6443 --token yi3zz8.qf0ziy9ce7nhnkjv --discovery-token-ca-cert-hash sha256:0d6c8981d10e407429e135db4350e6bb21382af57addd798daf6c3c5663ac964 --skip-phases=preflight"
The --skip-phases=preflight flag was key here, as it bypassed the problematic preflight checks while still allowing the nodes to join successfully.
Verification
After the join process completed, both nodes appeared in the cluster:
goldentooth command_root bettley "kubectl get nodes"
NAME STATUS ROLES AGE VERSION
bettley Ready control-plane 393d v1.32.3
cargyll Ready control-plane 393d v1.32.3
dalt Ready control-plane 393d v1.32.3
erenford Ready <none> 393d v1.32.3
fenn Ready <none> 393d v1.32.3
gardener Ready <none> 393d v1.32.3
harlton Ready <none> 393d v1.32.3
inchfield Ready <none> 393d v1.32.3
jast Ready <none> 393d v1.32.3
karstark Ready <none> 53s v1.32.7
lipps Ready <none> 54s v1.32.7
velaryon Ready <none> 52d v1.32.5
Perfect! Both nodes transitioned from "NotReady" to "Ready" status within about a minute, indicating that the Calico CNI networking had successfully configured them.
The New Topology
Our Kubernetes cluster now consists of:
- Control Plane (3 nodes): bettley, cargyll, dalt
- Workers (9 nodes): erenford, fenn, gardener, harlton, inchfield, jast, karstark, lipps, velaryon (GPU)
This brings us to a total of 12 nodes in the Kubernetes cluster, matching the full complement of our Raspberry Pi bramble plus the x86 GPU node.
GPU Node Configuration
Velaryon, my x86 GPU node, required special configuration to ensure GPU workloads are only scheduled intentionally:
Hardware Specifications
- GPU: NVIDIA GeForce RTX 2070 (8GB VRAM)
- CPU: 24 cores (x86_64)
- Memory: 32GB RAM
- Architecture: amd64
Kubernetes Configuration
The node is configured with:
- Label:
gpu=truefor workload targeting - Taint:
gpu=true:NoScheduleto prevent accidental scheduling - Architecture:
arch=amd64for x86-specific workloads
Scheduling Requirements
To schedule workloads on Velaryon, pods must include:
tolerations:
- key: gpu
operator: Equal
value: "true"
effect: NoSchedule
nodeSelector:
gpu: "true"
This ensures that only workloads explicitly designed for GPU execution can access the expensive GPU resources, following the same intentional scheduling pattern used with Nomad.
GPU Resource Detection Challenge
While the taint-based scheduling was working correctly, getting Kubernetes to actually detect and expose the GPU resources proved more challenging. The NVIDIA device plugin is responsible for discovering GPUs and advertising them as nvidia.com/gpu resources that pods can request.
Initial Problem
The device plugin was failing with the error:
E0719 16:20:41.050191 1 factory.go:115] Incompatible platform detected
E0719 16:20:41.050193 1 factory.go:116] If this is a GPU node, did you configure the NVIDIA Container Toolkit?
Despite having installed the NVIDIA Container Toolkit and configuring containerd, the device plugin couldn't detect the NVML library from within its container environment.
The Root Cause
The issue was that the device plugin container couldn't access:
- NVIDIA Management Library:
libnvidia-ml.so.1needed for GPU discovery - Device files:
/dev/nvidia*required for direct GPU communication - Proper privileges: Needed to interact with kernel-level GPU drivers
The Solution
After several iterations, the working configuration required:
Library Access:
volumeMounts:
- name: nvidia-ml-lib
mountPath: /usr/lib/x86_64-linux-gnu/libnvidia-ml.so.1
readOnly: true
- name: nvidia-ml-actual
mountPath: /usr/lib/x86_64-linux-gnu/libnvidia-ml.so.575.51.03
readOnly: true
Device Access:
volumeMounts:
- name: dev
mountPath: /dev
volumes:
- name: dev
hostPath:
path: /dev
Container Privileges:
securityContext:
privileged: true
Verification
Once properly configured, the device plugin successfully reported:
I0719 16:56:06.462937 1 server.go:165] Starting GRPC server for 'nvidia.com/gpu'
I0719 16:56:06.463631 1 server.go:117] Starting to serve 'nvidia.com/gpu' on /var/lib/kubelet/device-plugins/nvidia-gpu.sock
I0719 16:56:06.465420 1 server.go:125] Registered device plugin for 'nvidia.com/gpu' with Kubelet
The GPU resource then appeared in the node's capacity:
kubectl get nodes -o json | jq '.items[] | select(.metadata.name=="velaryon") | .status.capacity'
{
"cpu": "24",
"ephemeral-storage": "102626232Ki",
"hugepages-1Gi": "0",
"hugepages-2Mi": "0",
"memory": "32803048Ki",
"nvidia.com/gpu": "1",
"pods": "110"
}
Testing GPU Resource Allocation
To verify the system was working end-to-end, I created a test pod that:
- Requests GPU resources:
nvidia.com/gpu: 1 - Includes proper tolerations: To bypass the
gpu=true:NoScheduletaint - Targets the GPU node: Using
gpu: "true"node selector
apiVersion: v1
kind: Pod
metadata:
name: gpu-test-workload
spec:
tolerations:
- key: gpu
operator: Equal
value: "true"
effect: NoSchedule
nodeSelector:
gpu: "true"
containers:
- name: gpu-test
image: busybox
command: ["sleep", "60"]
resources:
requests:
nvidia.com/gpu: 1
limits:
nvidia.com/gpu: 1
The pod successfully scheduled and the node showed:
nvidia.com/gpu 1 1
This confirmed that GPU resource allocation tracking was working correctly.
Final NVIDIA Device Plugin Configuration
For reference, here's the complete working NVIDIA device plugin DaemonSet configuration:
apiVersion: apps/v1
kind: DaemonSet
metadata:
name: nvidia-device-plugin-daemonset
namespace: kube-system
spec:
selector:
matchLabels:
name: nvidia-device-plugin-ds
updateStrategy:
type: RollingUpdate
template:
metadata:
labels:
name: nvidia-device-plugin-ds
spec:
tolerations:
- key: gpu
operator: Equal
value: "true"
effect: NoSchedule
nodeSelector:
gpu: "true"
priorityClassName: system-node-critical
containers:
- image: nvcr.io/nvidia/k8s-device-plugin:v0.14.5
name: nvidia-device-plugin-ctr
env:
- name: FAIL_ON_INIT_ERROR
value: "false"
securityContext:
privileged: true
volumeMounts:
- name: device-plugin
mountPath: /var/lib/kubelet/device-plugins
- name: dev
mountPath: /dev
- name: nvidia-ml-lib
mountPath: /usr/lib/x86_64-linux-gnu/libnvidia-ml.so.1
readOnly: true
- name: nvidia-ml-actual
mountPath: /usr/lib/x86_64-linux-gnu/libnvidia-ml.so.575.51.03
readOnly: true
volumes:
- name: device-plugin
hostPath:
path: /var/lib/kubelet/device-plugins
- name: dev
hostPath:
path: /dev
- name: nvidia-ml-lib
hostPath:
path: /lib/x86_64-linux-gnu/libnvidia-ml.so.1
- name: nvidia-ml-actual
hostPath:
path: /usr/lib/x86_64-linux-gnu/libnvidia-ml.so.575.51.03
Key aspects of this configuration:
- Targeted deployment: Only runs on nodes with
gpu: "true"label - Taint tolerance: Can schedule on nodes with
gpu=true:NoScheduletaint - Privileged access: Required for kernel-level GPU driver interaction
- Library binding: Specific mounts for NVIDIA ML library files
- Device access: Full
/devmount for GPU device communication
GPU Storage NFS Export
With the cluster expanded to include the Velaryon GPU node, a natural question emerged: how can the Raspberry Pi cluster nodes efficiently exchange data with the GPU node for machine learning workloads and other compute-intensive tasks?
The solution was to leverage Velaryon's secondary 1TB NVMe SSD and expose it to the entire cluster via NFS, creating a high-speed shared storage pool specifically for Pi-GPU data exchange.
The Challenge
Velaryon came with two storage devices:
- Primary NVMe (nvme1n1): Linux system drive
- Secondary NVMe (nvme0n1): 1TB drive with old NTFS partitions from previous Windows installation
The goal was to repurpose this secondary drive as shared storage while maintaining architectural separation - the GPU node should provide storage services without becoming a structural component of the Pi cluster.
Storage Architecture Decision
Rather than integrating Velaryon into the existing storage ecosystem (ZFS replication, Ceph distributed storage), I opted for a simpler approach:
- Pure ext4: Single partition consuming the entire 1TB drive
- NFS export: Simple, performant network filesystem
- Subnet-wide access: Available to all 10.4.x.x nodes
This keeps the GPU node loosely coupled while providing the needed functionality.
Implementation
Drive Preparation
First, I cleared the old NTFS partitions and created a fresh GPT layout:
# Clear existing partition table
sudo wipefs -af /dev/nvme0n1
# Create new GPT partition table and single partition
sudo parted /dev/nvme0n1 mklabel gpt
sudo parted /dev/nvme0n1 mkpart primary ext4 0% 100%
# Format as ext4
sudo mkfs.ext4 -L gpu-storage /dev/nvme0n1p1
The resulting filesystem has UUID 5bc38d5b-a7a4-426e-acdb-e5caf0a809d9 and is mounted persistently at /mnt/gpu-storage.
NFS Server Configuration
Velaryon was configured as an NFS server with a single export:
# /etc/exports
/mnt/gpu-storage 10.4.0.0/20(rw,sync,no_root_squash,no_subtree_check)
This grants read-write access to the entire infrastructure subnet with synchronous writes for data integrity.
Ansible Integration
Rather than manually configuring each node, I integrated the GPU storage into the existing Ansible automation:
Inventory Updates (inventory/hosts):
nfs_server:
hosts:
allyrion: # Existing NFS server
velaryon: # New GPU storage server
Host Variables (inventory/host_vars/velaryon.yaml):
nfs_exports:
- "/mnt/gpu-storage 10.4.0.0/20(rw,sync,no_root_squash,no_subtree_check)"
Global Configuration (group_vars/all/vars.yaml):
nfs:
mounts:
primary: # Existing allyrion NFS share
share: "{{ hostvars[groups['nfs_server'] | first].ipv4_address }}:/mnt/usb1"
mount: '/mnt/nfs'
safe_name: 'mnt-nfs'
type: 'nfs'
options: {}
gpu_storage: # New GPU storage share
share: "{{ hostvars['velaryon'].ipv4_address }}:/mnt/gpu-storage"
mount: '/mnt/gpu-storage'
safe_name: 'mnt-gpu\x2dstorage' # Systemd unit name escaping
type: 'nfs'
options: {}
Systemd Automount Configuration
The trickiest part was configuring systemd automount units. Systemd requires special character escaping for mount paths - the mount point /mnt/gpu-storage must use the unit name mnt-gpu\x2dstorage (where \x2d is the escaped dash).
Mount Unit Template (templates/mount.j2):
[Unit]
Description=Mount {{ item.key }}
[Mount]
What={{ item.value.share }}
Where={{ item.value.mount }}
Type={{ item.value.type }}
{% if item.value.options -%}
Options={{ item.value.options | join(',') }}
{% else -%}
Options=defaults
{% endif %}
[Install]
WantedBy=default.target
Automount Unit Template (templates/automount.j2):
[Unit]
Description=Automount {{ item.key }}
After=remote-fs-pre.target network-online.target network.target
Before=umount.target remote-fs.target
[Automount]
Where={{ item.value.mount }}
TimeoutIdleSec=60
[Install]
WantedBy=default.target
Deployment Playbook
A new playbook setup_gpu_storage.yaml orchestrates the entire deployment:
---
# Setup GPU storage on Velaryon with NFS export
- name: 'Setup Velaryon GPU storage and NFS export'
hosts: 'velaryon'
become: true
tasks:
- name: 'Ensure GPU storage mount point exists'
ansible.builtin.file:
path: '/mnt/gpu-storage'
state: 'directory'
owner: 'root'
group: 'root'
mode: '0755'
- name: 'Check if GPU storage is mounted'
ansible.builtin.command:
cmd: 'mountpoint -q /mnt/gpu-storage'
register: gpu_storage_mounted
failed_when: false
changed_when: false
- name: 'Mount GPU storage if not already mounted'
ansible.builtin.mount:
src: 'UUID=5bc38d5b-a7a4-426e-acdb-e5caf0a809d9'
path: '/mnt/gpu-storage'
fstype: 'ext4'
opts: 'defaults'
state: 'mounted'
when: gpu_storage_mounted.rc != 0
- name: 'Configure NFS exports on Velaryon'
hosts: 'velaryon'
become: true
roles:
- 'geerlingguy.nfs'
- name: 'Setup NFS mounts on all nodes'
hosts: 'all'
become: true
roles:
- 'goldentooth.setup_nfs_mounts'
Usage
The GPU storage is now seamlessly integrated into the goldentooth CLI:
# Deploy/update GPU storage configuration
goldentooth setup_gpu_storage
# Enable automount on specific nodes
goldentooth command allyrion 'sudo systemctl enable --now mnt-gpu\x2dstorage.automount'
# Verify access (automounts on first access)
goldentooth command cargyll,bettley 'ls /mnt/gpu-storage/'
Results
The implementation provides:
- 1TB shared storage available cluster-wide at
/mnt/gpu-storage - Automatic mounting via systemd automount on directory access
- Full Ansible automation via the goldentooth CLI
- Clean separation between Pi cluster and GPU node architectures
Data written from any node is immediately visible across the cluster, enabling seamless Pi-GPU workflows for machine learning datasets, model artifacts, and computational results.
Prometheus Blackbox Exporter
The Observability Gap
Our Goldentooth cluster has comprehensive infrastructure monitoring through Prometheus, node exporters, and application metrics. But we've been missing a crucial piece: synthetic monitoring. We can see if our servers are running, but can we actually reach our services? Are our web UIs accessible? Can we connect to our APIs?
Enter the Prometheus Blackbox Exporter - our eyes and ears for service availability across the entire cluster.
What is Blackbox Monitoring?
Blackbox monitoring tests services from the outside, just like your users would. Instead of looking at internal metrics, it:
- Probes HTTP/HTTPS endpoints - "Is the Consul web UI actually working?"
- Tests TCP connectivity - "Can I connect to the Vault API port?"
- Validates DNS resolution - "Do our cluster domains resolve correctly?"
- Checks ICMP reachability - "Are all nodes responding to ping?"
It's called "blackbox" because we don't peek inside the service - we just test if it works from the outside.
Planning the Implementation
I needed to design a comprehensive monitoring strategy that would cover:
Service Categories
- HashiCorp Stack: Consul, Vault, Nomad web UIs and APIs
- Kubernetes Services: API server health, Argo CD, LoadBalancer services
- Observability Stack: Prometheus, Grafana, Loki endpoints
- Infrastructure: All 13 node homepages, HAProxy stats
- External Services: CloudFront distributions
- Network Health: DNS resolution for all cluster domains
Intelligent Probe Types
- Internal HTTPS: Uses Step-CA certificates for cluster services
- External HTTPS: Uses public CAs for external services
- HTTP: Plain HTTP for internal services
- TCP: Port connectivity for APIs and cluster communication
- DNS: Domain resolution for cluster services
- ICMP: Basic network connectivity for all nodes
The Ansible Implementation
I created a comprehensive Ansible role goldentooth.setup_blackbox_exporter that handles:
Core Deployment
# Install blackbox exporter v0.25.0
# Deploy on allyrion (same node as Prometheus)
# Configure systemd service with security hardening
# Set up TLS certificates via Step-CA
Security Integration
The blackbox exporter integrates seamlessly with our Step-CA infrastructure:
- Client certificates for secure communication
- CA validation for internal services
- Automatic renewal via systemd timers
- Proper certificate ownership for the service user
Service Discovery Magic
Instead of hardcoding targets, I implemented dynamic service discovery:
# Generate targets from Ansible inventory variables
blackbox_https_internal_targets:
- "https://consul.goldentooth.net:8501"
- "https://vault.goldentooth.net:8200"
- "https://nomad.goldentooth.net:4646"
# ... and many more
# Auto-generate ICMP targets for all cluster nodes
{% for host in groups['all'] %}
- targets:
- "{{ hostvars[host]['ipv4_address'] }}"
labels:
job: 'blackbox-icmp'
node: "{{ host }}"
{% endfor %}
Prometheus Integration
The trickiest part was configuring Prometheus to properly scrape blackbox targets. Blackbox exporter works differently than normal exporters:
# Instead of scraping the target directly...
# Prometheus scrapes the blackbox exporter with target as parameter
- job_name: 'blackbox-https-internal'
metrics_path: '/probe'
params:
module: ['https_2xx_internal']
relabel_configs:
# Redirect to blackbox exporter
- target_label: __address__
replacement: "allyrion:9115"
# Pass original target as parameter
- source_labels: [__param_target]
target_label: __param_target
Deployment Day
The deployment was mostly smooth with a few interesting challenges:
Certificate Duration Drama
# First attempt failed:
# "requested duration of 8760h is more than authorized maximum of 168h"
# Solution: Match Step-CA policy
--not-after=168h # 1 week instead of 1 year
DNS Resolution Reality Check
Many of our internal domains (*.goldentooth.net) don't actually resolve yet, so probes show up=0. This is expected and actually valuable - it shows us what infrastructure we still need to set up!
Relabel Configuration Complexity
Getting the Prometheus relabel configs right for blackbox took several iterations. The key insight: blackbox exporter targets need to be "redirected" through the exporter itself.
What We're Monitoring Now
The blackbox exporter is now actively monitoring 40+ endpoints across our cluster:
Web UIs and APIs
- Consul Web UI (
https://consul.goldentooth.net:8501) - Vault Web UI (
https://vault.goldentooth.net:8200) - Nomad Web UI (
https://nomad.goldentooth.net:4646) - Grafana Dashboard (
https://grafana.goldentooth.net:3000) - Argo CD Interface (
https://argocd.goldentooth.net)
Infrastructure Endpoints
- All 13 node homepages (
http://[node].nodes.goldentooth.net) - HAProxy statistics page (with basic auth)
- Prometheus web interface
- Loki API endpoints
Network Connectivity
- TCP connectivity to all critical service ports
- DNS resolution for all cluster domains
- ICMP ping for every cluster node
- External CloudFront distributions
The Power of Synthetic Monitoring
Now when something breaks, we'll know immediately:
probe_successtells us if the service is reachableprobe_duration_secondsshows response timesprobe_http_status_codereveals HTTP errorsprobe_ssl_earliest_cert_expirywarns about certificate expiration
This complements our existing infrastructure monitoring perfectly. We can see both "the server is running" (node exporter) and "the service actually works" (blackbox exporter).
Comprehensive Metrics Collection
After establishing the foundation of our observability stack with Prometheus, Grafana, and the blackbox exporter, it's time to ensure we're collecting metrics from every critical component in our cluster. This chapter covers the addition of Nomad telemetry and Kubernetes object metrics to our monitoring infrastructure.
The Metrics Audit
A comprehensive audit of our cluster revealed which services were already exposing metrics:
Already Configured:
- ✅ Kubernetes API server, controller manager, scheduler (via control plane endpoints)
- ✅ HAProxy (custom exporter on port 8405)
- ✅ Prometheus (self-monitoring)
- ✅ Grafana (internal metrics)
- ✅ Loki (log aggregation metrics)
- ✅ Consul (built-in Prometheus endpoint)
- ✅ Vault (telemetry endpoint)
Missing:
- ❌ Nomad (no telemetry configuration)
- ❌ Kubernetes object state (deployments, pods, services)
Enabling Nomad Telemetry
Nomad has built-in Prometheus support but requires explicit configuration. We added the telemetry block to our Nomad configuration template:
telemetry {
collection_interval = "1s"
disable_hostname = true
prometheus_metrics = true
publish_allocation_metrics = true
publish_node_metrics = true
}
This configuration:
- Enables Prometheus-compatible metrics on
/v1/metrics?format=prometheus - Publishes detailed allocation and node metrics
- Disables hostname labels (we add our own)
- Sets a 1-second collection interval for fine-grained data
Certificate-Based Authentication
Unlike some services that expose metrics without authentication, Nomad requires mutual TLS for metrics access. We leveraged our Step-CA infrastructure to generate proper client certificates:
- name: 'Generate Prometheus client certificate for Nomad metrics.'
ansible.builtin.shell:
cmd: |
{{ step_ca.executable }} ca certificate \
"prometheus.client.nomad" \
"/etc/prometheus/certs/nomad-client.crt" \
"/etc/prometheus/certs/nomad-client.key" \
--provisioner="{{ step_ca.default_provisioner.name }}" \
--password-file="{{ step_ca.default_provisioner.password_path }}" \
--san="prometheus.client.nomad" \
--san="prometheus" \
--san="{{ clean_hostname }}" \
--san="{{ ipv4_address }}" \
--not-after='24h' \
--console \
--force
This approach ensures:
- Certificates are properly signed by our cluster CA
- Client identity is clearly established
- Automatic renewal via systemd timers
- Consistent with our security model
Prometheus Scrape Configuration
With certificates in place, we configured Prometheus to scrape all Nomad nodes:
- job_name: 'nomad'
metrics_path: '/v1/metrics'
params:
format: ['prometheus']
static_configs:
- targets:
- "10.4.0.11:4646" # bettley (server)
- "10.4.0.12:4646" # cargyll (server)
- "10.4.0.13:4646" # dalt (server)
# ... all client nodes
scheme: 'https'
tls_config:
ca_file: "{{ step_ca.root_cert_path }}"
cert_file: "/etc/prometheus/certs/nomad-client.crt"
key_file: "/etc/prometheus/certs/nomad-client.key"
Kubernetes Object Metrics with kube-state-metrics
While node-level metrics tell us about resource usage, we also need visibility into Kubernetes objects themselves. Enter kube-state-metrics, which exposes metrics about:
- Deployment replica counts and rollout status
- Pod phases and container states
- Service endpoints and readiness
- PersistentVolume claims and capacity
- Job completion status
- And much more
GitOps Deployment Pattern
Following our established patterns, we created a dedicated GitOps repository for kube-state-metrics:
# Create the repository
gh repo create goldentooth/kube-state-metrics --public
# Clone into our organization structure
cd ~/Projects/goldentooth
git clone https://github.com/goldentooth/kube-state-metrics.git
# Add the required label for Argo CD discovery
gh repo edit goldentooth/kube-state-metrics --add-topic gitops-repo
The key insight here is that our Argo CD ApplicationSet automatically discovers repositories with the gitops-repo label, eliminating manual application creation.
kube-state-metrics Configuration
The deployment includes comprehensive RBAC permissions to read all Kubernetes objects:
apiVersion: rbac.authorization.k8s.io/v1
kind: ClusterRole
metadata:
name: kube-state-metrics
rules:
- apiGroups: [""]
resources:
- configmaps
- secrets
- nodes
- pods
- services
- resourcequotas
- replicationcontrollers
- limitranges
- persistentvolumeclaims
- persistentvolumes
- namespaces
- endpoints
verbs: ["list", "watch"]
# ... additional resources
We discovered that some resources like resourcequotas, replicationcontrollers, and limitranges were missing from the initial configuration, causing permission errors. A quick update to the ClusterRole resolved these issues.
Security Hardening
The kube-state-metrics deployment follows security best practices:
securityContext:
fsGroup: 65534
runAsGroup: 65534
runAsNonRoot: true
runAsUser: 65534
seccompProfile:
type: RuntimeDefault
Container-level security adds additional restrictions:
securityContext:
allowPrivilegeEscalation: false
capabilities:
drop:
- ALL
readOnlyRootFilesystem: true
Prometheus Auto-Discovery
The service includes annotations for automatic Prometheus discovery:
annotations:
prometheus.io/scrape: 'true'
prometheus.io/port: '8080'
prometheus.io/path: '/metrics'
This eliminates the need for manual Prometheus configuration - the metrics are automatically discovered and scraped.
Verifying the Deployment
After deployment, we can verify metrics are being exposed:
# Port-forward to test locally
kubectl port-forward -n kube-state-metrics service/kube-state-metrics 8080:8080
# Check deployment metrics
curl -s http://localhost:8080/metrics | grep kube_deployment_status_replicas
Example output:
kube_deployment_status_replicas{namespace="argocd",deployment="argocd-redis-ha-haproxy"} 3
kube_deployment_status_replicas{namespace="kube-system",deployment="coredns"} 2
Blocking Docker Installation
The Problem
I don't know why, and I'm too lazy to dig much into it, but if I install docker on any node in the Kubernetes cluster, this conflicts with containerd (containerd.io), which causes Kubernetes to shit blood and stop working on that node. Great.
To prevent this, I implemented a clusterwide ban on Docker. I'm recording the details here in case I need to do it again.
Implementation
First, we removed Docker from nodes where it was already installed (like Allyrion):
# Stop and remove containers
goldentooth command_root allyrion "docker stop envoy && docker rm envoy"
# Remove all images
goldentooth command_root allyrion "docker images -q | xargs -r docker rmi -f"
# Stop and disable Docker
goldentooth command_root allyrion "systemctl stop docker && systemctl disable docker"
goldentooth command_root allyrion "systemctl stop docker.socket && systemctl disable docker.socket"
# Purge Docker packages
goldentooth command_root allyrion "apt-get purge -y docker-ce docker-ce-cli containerd.io docker-buildx-plugin docker-compose-plugin"
goldentooth command_root allyrion "apt-get autoremove -y"
# Clean up Docker directories
goldentooth command_root allyrion "rm -rf /var/lib/docker /etc/docker /var/run/docker.sock"
goldentooth command_root allyrion "rm -f /etc/apt/sources.list.d/docker.list /etc/apt/keyrings/docker.gpg"
APT Preferences Configuration
Next, we added an APT preferences file to the goldentooth.setup_security role that blocks Docker packages from being installed:
- name: 'Block Docker installation to prevent conflicts with Kubernetes containerd'
ansible.builtin.copy:
dest: '/etc/apt/preferences.d/block-docker'
mode: '0644'
owner: 'root'
group: 'root'
content: |
# Block Docker installation to prevent conflicts with Kubernetes containerd
# Docker packages can break the containerd installation used by Kubernetes
# This preference file prevents accidental installation of Docker
Package: docker-ce
Pin: origin ""
Pin-Priority: -1
Package: docker-ce-cli
Pin: origin ""
Pin-Priority: -1
Package: docker-ce-rootless-extras
Pin: origin ""
Pin-Priority: -1
Package: docker-buildx-plugin
Pin: origin ""
Pin-Priority: -1
Package: docker-compose-plugin
Pin: origin ""
Pin-Priority: -1
Package: docker.io
Pin: origin ""
Pin-Priority: -1
Package: docker-compose
Pin: origin ""
Pin-Priority: -1
Package: docker-registry
Pin: origin ""
Pin-Priority: -1
Package: docker-doc
Pin: origin ""
Pin-Priority: -1
# Also block the older containerd.io package that comes with Docker
# Kubernetes should use the standard containerd package instead
Package: containerd.io
Pin: origin ""
Pin-Priority: -1
Deployment
The configuration was deployed to all nodes using:
goldentooth configure_cluster
Verification
We can verify that Docker is now blocked:
# Check Docker package policy
goldentooth command allyrion "apt-cache policy docker-ce"
# Output shows: Candidate: (none)
# Verify the preferences file exists
goldentooth command all "ls -la /etc/apt/preferences.d/block-docker"
How APT Preferences Work
APT preferences allow you to control which versions of packages are installed. By setting a Pin-Priority of -1, we effectively tell APT to never install these packages, regardless of their availability in the configured repositories.
This is more robust than simply removing Docker repositories because:
- It prevents installation from any source (including manual addition of repositories)
- It provides clear documentation of why these packages are blocked
- It's easily reversible if needed (just remove the preferences file)
Infrastructure Test Framework Improvements
After running comprehensive tests across the cluster, we discovered several critical issues with our test framework that were masking real infrastructure problems. This chapter documents the systematic fixes we implemented to ensure our automated testing provides accurate health monitoring.
The Initial Problem
When running goldentooth test all, multiple test failures appeared across different nodes:
PLAY RECAP *********************************************************************
bettley : ok=47 changed=0 unreachable=0 failed=1 skipped=3 rescued=0 ignored=2
cargyll : ok=47 changed=0 unreachable=0 failed=1 skipped=3 rescued=0 ignored=1
dalt : ok=47 changed=0 unreachable=0 failed=1 skipped=3 rescued=0 ignored=1
The challenge was determining whether these failures indicated real infrastructure issues or problems with the test framework itself.
Root Cause Analysis
1. Kubernetes API Server Connectivity Issues
The most critical failure was the Kubernetes API server health check consistently failing on the bettley control plane node:
Status code was -1 and not [200]: Request failed: <urlopen error [Errno 111] Connection refused>
url: https://10.4.0.11:6443/healthz
Initial investigation revealed that while kubelet was running, both etcd and kube-apiserver pods were in CrashLoopBackOff state. This led us to discover that Kubernetes certificates had expired on June 20, 2025, but we were running tests in July 2025.
2. Test Framework Configuration Issues
Several test framework bugs were identified:
- Vault decryption errors: Tests couldn't access encrypted vault secrets
- Wrong certificate paths: Tests checking CA certificates instead of service certificates
- Undefined variables: JMESPath dependencies and variable reference errors
- Localhost binding assumptions: Services bound to specific IPs, not localhost
Infrastructure Fixes
Kubernetes Certificate Renewal
The most significant infrastructure issue was expired Kubernetes certificates. We resolved this using kubeadm:
# Backup existing certificates
ansible -i inventory/hosts bettley -m shell -a "cp -r /etc/kubernetes/pki /etc/kubernetes/pki.backup.$(date +%Y%m%d_%H%M%S)" --become
# Renew all certificates
ansible -i inventory/hosts bettley -m shell -a "kubeadm certs renew all" --become
# Restart control plane components by moving manifests temporarily
cd /etc/kubernetes/manifests
mv kube-apiserver.yaml kube-apiserver.yaml.tmp
mv etcd.yaml etcd.yaml.tmp
mv kube-controller-manager.yaml kube-controller-manager.yaml.tmp
mv kube-scheduler.yaml kube-scheduler.yaml.tmp
# Wait 10 seconds, then restore manifests
sleep 10
mv kube-apiserver.yaml.tmp kube-apiserver.yaml
mv etcd.yaml.tmp etcd.yaml
mv kube-controller-manager.yaml.tmp kube-controller-manager.yaml
mv kube-scheduler.yaml.tmp kube-scheduler.yaml
After renewal, certificates were valid until July 2026:
CERTIFICATE EXPIRES RESIDUAL TIME CERTIFICATE AUTHORITY EXTERNALLY MANAGED
apiserver Jul 23, 2026 00:01 UTC 364d ca no
etcd-peer Jul 23, 2026 00:01 UTC 364d etcd-ca no
etcd-server Jul 23, 2026 00:01 UTC 364d etcd-ca no
Test Framework Fixes
1. Vault Authentication
Fixed missing vault password configuration in test environment:
# /Users/nathan/Projects/goldentooth/ansible/tests/ansible.cfg
[defaults]
vault_password_file = ~/.goldentooth_vault_password
2. Certificate Path Corrections
Updated tests to check actual service certificates instead of CA certificates:
# Before: Checking CA certificates (5-year lifespan)
path: /etc/consul.d/tls/consul-agent-ca.pem
# After: Checking service certificates (24-hour rotation)
path: /etc/consul.d/certs/tls.crt
3. API Connectivity Fixes
Fixed hardcoded localhost assumptions to use actual node IP addresses:
# Before: Assuming localhost binding
url: "https://127.0.0.1:8501/v1/status/leader"
# After: Using actual node IP
url: "http://{{ ansible_default_ipv4.address }}:8500/v1/status/leader"
4. Consul Members Command
Enhanced Consul connectivity testing with proper address specification:
- name: Check if consul command exists
stat:
path: /usr/bin/consul
register: consul_command_stat
- name: Check Consul members
command: consul members -status=alive -http-addr={{ ansible_default_ipv4.address }}:8500
when:
- consul_service.status.ActiveState == "active"
- consul_command_stat.stat.exists
5. Kubernetes Test Improvements
Simplified Kubernetes tests to avoid JMESPath dependencies and fixed variable scoping:
# Simplified node readiness test
- name: Record node readiness test (simplified)
set_fact:
k8s_tests: "{{ k8s_tests + [{'name': 'k8s_cluster_accessible', 'category': 'kubernetes', 'success': (k8s_nodes_raw is defined and k8s_nodes_raw is succeeded) | bool, 'duration': 0.5}] }}"
# Fixed API health test scoping
- name: Record API health test
set_fact:
k8s_tests: "{{ k8s_tests + [{'name': 'k8s_api_healthy', 'category': 'kubernetes', 'success': (k8s_api.status == 200 and k8s_api.content | default('') == 'ok') | bool, 'duration': 0.2}] }}"
when:
- k8s_api is defined
- inventory_hostname in groups['k8s_control_plane']
6. Step-CA Variable References
Fixed undefined variable references in Step-CA connectivity tests:
# Fixed IP address lookup
elif step ca health --ca-url https://{{ hostvars[groups['step_ca'] | first]['ipv4_address'] }}:9443 --root /etc/ssl/certs/goldentooth.pem; then
7. Localhost Aggregation Task
Fixed the test summary task that was failing due to missing facts:
- name: Aggregate test results
hosts: localhost
gather_facts: true # Changed from false
Test Design Philosophy
We adopted a principle of separating certificate presence from validity testing:
# Test 1: Certificate exists
- name: Check Consul certificate exists
stat:
path: /etc/consul.d/certs/tls.crt
register: consul_cert
- name: Record certificate presence test
set_fact:
consul_tests: "{{ consul_tests + [{'name': 'consul_certificate_present', 'category': 'consul', 'success': consul_cert.stat.exists | bool, 'duration': 0.1}] }}"
# Test 2: Certificate is valid (separate test)
- name: Check if certificate needs renewal
command: step certificate needs-renewal /etc/consul.d/certs/tls.crt
register: cert_needs_renewal
when: consul_cert.stat.exists
- name: Record certificate validity test
set_fact:
consul_tests: "{{ consul_tests + [{'name': 'consul_certificate_valid', 'category': 'consul', 'success': (cert_needs_renewal.rc != 0) | bool, 'duration': 0.1}] }}"
This approach provides better debugging information and clearer failure isolation.
Slurm Refactoring and Improvements
Overview
After the initial Slurm deployment (documented in chapter 032), the cluster faced performance and reliability challenges that required significant refactoring. The monolithic setup role was taking 10+ minutes to execute and had idempotency issues, while memory configuration mismatches caused node validation failures.
It's my fault - it's because of my laziness. So this chapter is essentially me saying "yeah, I did a shitty thing, and so now I have to fix it."
Problems Identified
Performance Issues
- Setup Duration: The original
goldentooth.setup_slurmrole took over 10 minutes - Non-idempotent: Re-running the role would repeat expensive operations
- Monolithic Design: Single role handled everything from basic Slurm to complex HPC software stacks
Node Validation Failures
- Memory Mismatch: karstark and lipps nodes (4GB Pi 4s) were configured with 4096MB but only had ~3797MB available
- Invalid State: These nodes showed as "inval" in
sinfooutput - Authentication Issues: MUNGE key synchronization problems across nodes
Configuration Management
- Static Memory Values: All nodes hardcoded to 4096MB regardless of actual capacity
- Limited Flexibility: Single configuration approach didn't account for hardware variations
Refactoring Solution
Modular Role Architecture
Split the monolithic role into focused components:
Core Components (goldentooth.setup_slurm_core)
- Purpose: Essential Slurm and MUNGE setup only
- Duration: Reduced from 10+ minutes to ~50 seconds
- Scope: Package installation, basic configuration, service management
- Features: MUNGE key synchronization, systemd PID file fixes
Specialized Modules
goldentooth.setup_lmod: Environment module systemgoldentooth.setup_hpc_software: HPC software stack (OpenMPI, Singularity, Conda)goldentooth.setup_slurm_modules: Module files for installed software
Dynamic Memory Detection
Replaced static memory configuration with dynamic detection:
# Before: Static configuration
NodeName=DEFAULT CPUs=4 RealMemory=4096 Sockets=1 CoresPerSocket=4 ThreadsPerCore=1 State=UNKNOWN
# After: Dynamic per-node configuration
NodeName=DEFAULT CPUs=4 Sockets=1 CoresPerSocket=4 ThreadsPerCore=1 State=UNKNOWN
{% for slurm_compute_name in groups['slurm_compute'] %}
NodeName={{ slurm_compute_name }} NodeAddr={{ hostvars[slurm_compute_name].ipv4_address }} RealMemory={{ hostvars[slurm_compute_name].ansible_memtotal_mb }}
{% endfor %}
Node Exclusion Strategy
For nodes with insufficient memory (karstark, lipps):
- Inventory Update: Removed from
slurm_computegroup - Service Cleanup: Stopped and disabled slurmd/munge services
- Package Removal: Uninstalled Slurm packages to prevent conflicts
Implementation Details
MUNGE Key Synchronization
Added permanent solution to MUNGE authentication issues:
- name: 'Synchronize MUNGE keys across cluster'
block:
- name: 'Retrieve MUNGE key from first controller'
ansible.builtin.slurp:
src: '/etc/munge/munge.key'
register: 'controller_munge_key'
run_once: true
delegate_to: "{{ groups['slurm_controller'] | first }}"
- name: 'Distribute MUNGE key to all nodes'
ansible.builtin.copy:
content: "{{ controller_munge_key.content | b64decode }}"
dest: '/etc/munge/munge.key'
owner: 'munge'
group: 'munge'
mode: '0400'
backup: yes
when: inventory_hostname != groups['slurm_controller'] | first
notify: 'Restart MUNGE'
SystemD Integration Fixes
Resolved PID file path mismatches:
- name: 'Fix slurmctld pidfile path mismatch'
ansible.builtin.copy:
content: |
[Service]
PIDFile=/var/run/slurm/slurmctld.pid
dest: '/etc/systemd/system/slurmctld.service.d/override.conf'
mode: '0644'
when: inventory_hostname in groups['slurm_controller']
notify: 'Reload systemd and restart slurmctld'
NFS Permission Resolution
Fixed directory permissions that prevented slurm user access:
# Fixed root directory permissions on NFS server
chmod 755 /mnt/usb1 # Was 700, preventing slurm user access
Results
Performance Improvements
- Setup Time: Reduced from 10+ minutes to ~50 seconds for core functionality
- Idempotency: Role can be safely re-run without expensive operations
- Modularity: Users can choose which components to install
Cluster Health
- Node Status: 9 nodes operational and idle
- Authentication: MUNGE working consistently across all nodes
- Resource Detection: Accurate memory reporting per node
Final Cluster State
general* up infinite 9 idle bettley,cargyll,dalt,erenford,fenn,gardener,harlton,inchfield,jast
debug up infinite 9 idle bettley,cargyll,dalt,erenford,fenn,gardener,harlton,inchfield,jast
Prometheus Slurm Exporter
Overview
Following the Slurm refactoring work, the next logical step was to add comprehensive monitoring for the HPC workload manager. This chapter documents the implementation of prometheus-slurm-exporter to provide real-time visibility into cluster utilization, job queues, and resource allocation.
The Challenge
While Slurm was operational with 9 nodes in idle state, there was no integration with the existing Prometheus/Grafana observability stack. Key missing capabilities:
- No Cluster Metrics: Unable to monitor CPU/memory utilization across nodes
- No Job Visibility: No insight into job queues, completion rates, or resource consumption
- No Historical Data: No way to track cluster usage patterns over time
- Limited Alerting: No proactive monitoring of cluster health or resource exhaustion
Implementation Approach
Exporter Selection
Initially attempted the original vpenso/prometheus-slurm-exporter but discovered it was unmaintained and lacked modern features. Switched to the rivosinc/prometheus-slurm-exporter fork which provided:
- Active Maintenance: 87 commits, regular releases through v1.6.10
- Pre-built Binaries: ARM64 support via GitHub releases
- Enhanced Features: Job tracing, CLI fallback modes, throttling support
- Better Performance: Optimized for multiple Prometheus instances
Architecture Design
Deployed the exporter following goldentooth cluster patterns:
# Deployment Strategy
Target Nodes: slurm_controller (bettley, cargyll, dalt)
Service Port: 9092 (HTTP)
Protocol: HTTP with Prometheus file-based service discovery
Integration: Full Step-CA certificate management ready
User Management: Dedicated slurm-exporter service user
Role Structure
Created goldentooth.setup_slurm_exporter following established conventions:
roles/goldentooth.setup_slurm_exporter/
├── CLAUDE.md # Comprehensive documentation
├── tasks/main.yaml # Main deployment tasks
├── templates/
│ ├── slurm-exporter.service.j2 # Systemd service
│ ├── slurm_targets.yaml.j2 # Prometheus targets
│ └── cert-renewer@slurm-exporter.conf.j2 # Certificate renewal
└── handlers/main.yaml # Service management handlers
Technical Implementation
Binary Installation
- name: 'Download prometheus-slurm-exporter from rivosinc fork'
ansible.builtin.get_url:
url: 'https://github.com/rivosinc/prometheus-slurm-exporter/releases/download/v{{ prometheus_slurm_exporter.version }}/prometheus-slurm-exporter_linux_{{ host.architecture }}.tar.gz'
dest: '/tmp/prometheus-slurm-exporter-{{ prometheus_slurm_exporter.version }}.tar.gz'
mode: '0644'
Service Configuration
[Service]
Type=simple
User=slurm-exporter
Group=slurm-exporter
ExecStart=/usr/local/bin/prometheus-slurm-exporter \
-web.listen-address={{ ansible_default_ipv4.address }}:{{ prometheus_slurm_exporter.port }} \
-web.log-level=info
Prometheus Integration
Added to the existing scrape configuration:
prometheus_scrape_configs:
- job_name: 'slurm'
file_sd_configs:
- files:
- "/etc/prometheus/file_sd/slurm_targets.yaml"
relabel_configs:
- source_labels: [instance]
target_label: instance
regex: '([^:]+):\d+'
replacement: '${1}'
Service Discovery
Dynamic target generation for all controller nodes:
- targets:
- "{{ hostvars[slurm_controller].ansible_default_ipv4.address }}:{{ prometheus_slurm_exporter.port }}"
labels:
job: 'slurm'
instance: '{{ slurm_controller }}'
cluster: '{{ cluster_name }}'
role: 'slurm-controller'
Metrics Exposed
The rivosinc exporter provides comprehensive cluster visibility:
Core Cluster Metrics
slurm_cpus_total 36 # Total CPU cores (9 nodes × 4 cores)
slurm_cpus_idle 36 # Available CPU cores
slurm_cpus_per_state{state="idle"} 36
slurm_node_count_per_state{state="idle"} 9
Memory Utilization
slurm_mem_real 7.0281e+10 # Total cluster memory (MB)
slurm_mem_alloc 6.0797e+10 # Allocated memory
slurm_mem_free 9.484e+09 # Available memory
Job Queue Metrics
slurm_jobs_pending 0 # Jobs waiting in queue
slurm_jobs_running 0 # Currently executing jobs
slurm_job_scrape_duration 29 # Metric collection performance
Performance Monitoring
slurm_cpu_load 5.83 # Current CPU load average
slurm_node_scrape_duration 35 # Node data collection time
Deployment Results
Service Health
All three controller nodes running successfully:
● slurm-exporter.service - Prometheus Slurm Exporter
Loaded: loaded (/etc/systemd/system/slurm-exporter.service; enabled)
Active: active (running)
Main PID: 3692156 (prometheus-slur)
Tasks: 5 (limit: 8737)
Memory: 1.5M (max: 128.0M available)
Metrics Validation
curl http://10.4.0.11:9092/metrics | grep '^slurm_'
slurm_cpu_load 5.83
slurm_cpus_idle 36
slurm_cpus_per_state{state="idle"} 36
slurm_cpus_total 36
slurm_node_count_per_state{state="idle"} 9
Prometheus Integration
Targets automatically discovered and scraped:
- bettley:9092 - Controller node metrics
- cargyll:9092 - Controller node metrics
- dalt:9092 - Controller node metrics
Configuration Management
Variables Structure
# Prometheus Slurm Exporter configuration (rivosinc fork)
prometheus_slurm_exporter:
version: "1.6.10"
port: 9092
user: "slurm-exporter"
group: "slurm-exporter"
Command Interface
# Deploy exporter
goldentooth setup_slurm_exporter
# Verify deployment
goldentooth command slurm_controller "systemctl status slurm-exporter"
# Check metrics
goldentooth command bettley "curl -s http://localhost:9092/metrics | head -10"
Troubleshooting Lessons
Initial Issues Encountered
-
Wrong Repository: Started with unmaintained vpenso fork
- Solution: Switched to actively maintained rivosinc fork
-
TLS Configuration: Attempted HTTPS but exporter doesn't support TLS flags
- Solution: Used HTTP with plans for future TLS proxy if needed
-
Binary Availability: No pre-built ARM64 binaries in original version
- Solution: rivosinc fork provides comprehensive release assets
-
Port Conflicts: Initially used port 8080
- Solution: Used exporter default 9092 to avoid conflicts
Debugging Process
Service logs were key to identifying configuration issues:
journalctl -u slurm-exporter --no-pager -l
Metrics endpoint testing confirmed functionality:
curl -s http://localhost:9092/metrics | grep -E '^slurm_'
Integration with Existing Stack
The exporter seamlessly integrates with goldentooth monitoring infrastructure:
Prometheus Configuration
- File-based Service Discovery: Automatic target management
- Label Strategy: Consistent with existing exporters
- Scrape Intervals: Standard 60-second collection
Certificate Management
- Step-CA Ready: Templates prepared for future TLS implementation
- Automatic Renewal: Systemd timer configuration included
- Service User: Dedicated account with minimal permissions
Observability Pipeline
- Prometheus: Metrics collection and storage
- Grafana: Dashboard visualization (ready for implementation)
- Alerting: Rule definition for cluster health monitoring
Performance Impact
Resource Usage
- Memory: ~1.5MB RSS per exporter instance
- CPU: Minimal impact during scraping
- Network: Standard HTTP metrics collection
- Slurm Load: Read-only operations with built-in throttling
Scalability Considerations
- Multiple Controllers: Distributed across all controller nodes
- High Availability: No single point of failure
- Data Consistency: Each exporter provides complete cluster view
Certificate Renewal Debugging Odyssey
Some time after setting up the certificate renewal system, the cluster was humming along nicely with 24-hour certificate lifetimes and automatic renewal every 5 minutes. Or so I thought.
One morning, I discovered that Vault certificates had mysteriously expired overnight, despite the renewal system supposedly working. This kicked off a multi-day investigation that would lead to significant improvements in our certificate management and monitoring infrastructure.
The Mystery: Why Didn't Vault Certificates Renew?
The first clue was puzzling - some services had renewed their certificates successfully (Consul, Nomad), while others (Vault) had failed silently. The cert-renewer systemd service showed no errors, and the timers were running on schedule.
$ goldentooth command_root jast 'systemctl status cert-renewer@vault.timer'
● cert-renewer@vault.timer - Timer for certificate renewal of vault
Loaded: loaded (/etc/systemd/system/cert-renewer@.timer; enabled)
Active: active (waiting) since Wed 2025-07-23 14:05:12 EDT; 3h ago
The timer was active, but the certificates were still expired. Something was fundamentally wrong with our renewal logic.
Building a Certificate Renewal Canary
Rather than guessing at the problem, I decided to build proper test infrastructure. The solution was a "canary" service - a minimal certificate renewal setup with extremely short lifetimes that would fail fast and give us rapid feedback.
Creating the Canary Service
I created a new Ansible role goldentooth.setup_cert_renewer_canary that:
- Creates a dedicated user and service:
cert-canaryuser with its own systemd service - Uses 15-minute certificate lifetimes: Fast enough to debug quickly
- Runs on a 5-minute timer: Same schedule as production services
- Provides comprehensive logging: Detailed output for debugging
# roles/goldentooth.setup_cert_renewer_canary/defaults/main.yaml
cert_canary:
username: cert-canary
group: cert-canary
cert_lifetime: 15m
cert_path: /opt/cert-canary/certs/tls.crt
key_path: /opt/cert-canary/certs/tls.key
The canary service template includes detailed logging:
[Unit]
Description=Certificate Canary Service
After=network-online.target
[Service]
Type=oneshot
User=cert-canary
WorkingDirectory=/opt/cert-canary
ExecStart=/bin/echo "Certificate canary service executed successfully"
Discovering the Root Cause
With the canary in place, I could observe the renewal process in real-time. The breakthrough came when I examined the step certificate needs-renewal command more carefully.
The 66% Threshold Problem
The default cert-renewer configuration uses a 66% threshold for renewal - certificates renew when they have less than 66% of their lifetime remaining. For 24-hour certificates, this means renewal occurs when there are about 8 hours left.
But here's the critical issue: with a 5-minute timer interval, there's only a narrow window for successful renewal. If the renewal fails during that window (due to network issues, service restarts, etc.), the next attempt won't occur until the timer fires again.
The math was unforgiving:
- 24-hour certificate: 66% threshold = ~8 hour renewal window
- 5-minute timer: 12 attempts per hour
- Network/service instability: Occasional renewal failures
- Result: Certificates could expire if multiple renewal attempts failed in succession
The Solution: Environment Variable Configuration
The fix involved making the cert-renewer system more configurable and robust. I updated the base cert-renewer@.service template to support environment variable overrides:
[Unit]
Description=Certificate renewer for %I
After=network-online.target
Documentation=https://smallstep.com/docs/step-ca/certificate-authority-server-production
StartLimitIntervalSec=0
[Service]
Type=oneshot
User=root
Environment=STEPPATH=/etc/step-ca
Environment=CERT_LOCATION=/etc/step/certs/%i.crt
Environment=KEY_LOCATION=/etc/step/certs/%i.key
Environment=EXPIRES_IN_THRESHOLD=66%
ExecCondition=/usr/bin/step certificate needs-renewal ${CERT_LOCATION} --expires-in ${EXPIRES_IN_THRESHOLD}
ExecStart=/usr/bin/step ca renew --force ${CERT_LOCATION} ${KEY_LOCATION}
ExecStartPost=/usr/bin/env sh -c "! systemctl --quiet is-active %i.service || systemctl try-reload-or-restart %i.service"
[Install]
WantedBy=multi-user.target
Service-Specific Overrides
Each service now gets its own override configuration that specifies the exact certificate paths and renewal behavior:
# /etc/systemd/system/cert-renewer@vault.service.d/override.conf
[Service]
Environment=CERT_LOCATION=/opt/vault/tls/tls.crt
Environment=KEY_LOCATION=/opt/vault/tls/tls.key
WorkingDirectory=/opt/vault/tls
ExecStartPost=/usr/bin/env sh -c "! systemctl --quiet is-active vault.service || systemctl try-reload-or-restart vault.service"
The beauty of this approach is that we can now tune renewal behavior per service without modifying the base template.
Comprehensive Monitoring Infrastructure
While debugging the certificate issue, I also built comprehensive monitoring dashboards and alerting to prevent future incidents.
New Grafana Dashboards
I created three major monitoring dashboards:
- Slurm Cluster Overview: Job queue metrics, resource utilization, historical trends
- HashiCorp Services Overview: Consul health, Vault status, Nomad allocation monitoring
- Infrastructure Health Overview: Node uptime, storage capacity, network metrics
Enhanced Metrics Collection
The monitoring improvements included:
- Vector Internal Metrics: Enabled Vector's internal metrics and Prometheus exporter
- Certificate Expiration Tracking: Automated monitoring of certificate days-remaining
- Service Health Indicators: Real-time status for all critical cluster services
- Alert Rules: Proactive notifications for certificate expiration and service failures
Testing Infrastructure Improvements
The certificate renewal investigation led to significant improvements in our testing infrastructure.
Certificate-Aware Test Suite
I created a comprehensive test_certificate_renewal role that:
- Node-Specific Testing: Only tests certificates for services actually deployed on each node
- Multi-Layered Validation: Certificate presence, validity, timer status, renewal capability
- Chain Validation: Verifies certificates against the cluster CA
- Canary Health Monitoring: Tracks the certificate canary's renewal cycles
Smart Service Filtering
The test improvements included "intelligent" service filtering:
# Filter services to only those deployed on this node
- name: Filter services for current node
set_fact:
node_certificate_services: |-
{%- set filtered_services = [] -%}
{%- for service in certificate_services -%}
{%- set should_include = false -%}
{%- if service.get('specific_hosts') -%}
{%- if inventory_hostname in service.specific_hosts -%}
{%- set should_include = true -%}
{%- endif -%}
{%- elif service.host_groups -%}
{%- for group in service.host_groups -%}
{%- if inventory_hostname in groups.get(group, []) -%}
{%- set should_include = true -%}
{%- endif -%}
{%- endfor -%}
{%- endif -%}
{%- if should_include -%}
{%- set _ = filtered_services.append(service) -%}
{%- endif -%}
{%- endfor -%}
{{ filtered_services }}
This eliminated false positives where tests were failing for missing certificates on nodes where services weren't supposed to be running.
Nextflow Workflow Management System
Overview
After successfully establishing a robust Slurm HPC cluster with comprehensive monitoring and observability, the next logical step was to add a modern workflow management system. Nextflow provides a powerful solution for data-intensive computational pipelines, enabling scalable and reproducible scientific workflows using software containers.
This chapter documents the installation and integration of Nextflow 24.10.0 with the existing Slurm cluster, complete with Singularity container support, shared storage integration, and module system configuration.
The Challenge
While our Slurm cluster was fully functional for individual job submission, we lacked a sophisticated workflow management system that could:
- Orchestrate Complex Pipelines: Chain multiple computational steps with dependency management
- Provide Reproducibility: Ensure consistent results across different execution environments
- Support Containers: Leverage containerized software for portable and consistent environments
- Integrate with Slurm: Seamlessly submit jobs to our existing cluster scheduler
- Enable Scalability: Automatically parallelize workflows across cluster nodes
Modern bioinformatics and data science workflows often require hundreds of interconnected tasks, making manual job submission impractical and error-prone.
Implementation Approach
The solution involved creating a comprehensive Nextflow installation that integrates deeply with our existing infrastructure:
1. Architecture Design
- Shared Storage Integration: Install Nextflow on NFS to ensure cluster-wide accessibility
- Slurm Executor: Configure native Slurm executor for distributed job execution
- Container Runtime: Leverage existing Singularity installation for reproducible environments
- Module System: Integrate with Lmod for consistent environment management
2. Installation Strategy
- Java Runtime: Install OpenJDK 17 as a prerequisite across all compute nodes
- Centralized Installation: Single installation on shared storage accessible by all nodes
- Configuration Templates: Create reusable configuration for common workflow patterns
- Example Workflows: Provide ready-to-run examples for testing and learning
Technical Implementation
New Ansible Role Creation
Created goldentooth.setup_nextflow role with comprehensive installation logic:
# Install Java OpenJDK (required for Nextflow)
- name: 'Install Java OpenJDK (required for Nextflow)'
ansible.builtin.apt:
name:
- 'openjdk-17-jdk'
- 'openjdk-17-jre'
state: 'present'
# Download and install Nextflow
- name: 'Download Nextflow binary'
ansible.builtin.get_url:
url: "https://github.com/nextflow-io/nextflow/releases/download/v{{ slurm.nextflow_version }}/nextflow"
dest: "{{ slurm.nfs_base_path }}/nextflow/{{ slurm.nextflow_version }}/nextflow"
owner: 'slurm'
group: 'slurm'
mode: '0755'
Slurm Executor Configuration
Created comprehensive Nextflow configuration optimized for our cluster:
// Nextflow Configuration for Goldentooth Cluster
process {
executor = 'slurm'
queue = 'general'
// Default resource requirements
cpus = 1
memory = '1GB'
time = '1h'
// Enable Singularity containers
container = 'ubuntu:20.04'
// Process-specific configurations
withLabel: 'small' {
cpus = 1
memory = '2GB'
time = '30m'
}
withLabel: 'large' {
cpus = 4
memory = '8GB'
time = '6h'
}
}
// Slurm executor configuration
executor {
name = 'slurm'
queueSize = 100
submitRateLimit = '10/1min'
clusterOptions = {
"--account=default " +
"--partition=\${task.queue} " +
"--job-name=nf-\${task.hash}"
}
}
Container Integration
Configured Singularity integration for reproducible workflows:
singularity {
enabled = true
autoMounts = true
envWhitelist = 'SLURM_*'
// Cache directory on shared storage
cacheDir = '/mnt/nfs/slurm/singularity/cache'
// Mount shared directories
runOptions = '--bind /mnt/nfs/slurm:/mnt/nfs/slurm'
}
Module System Integration
Extended the existing Lmod system with a Nextflow module:
-- Nextflow Workflow Management System
whatis("Nextflow workflow management system 24.10.0")
-- Load required Java module (dependency)
depends_on("java/17")
-- Add Nextflow to PATH
prepend_path("PATH", "/mnt/nfs/slurm/nextflow/24.10.0")
-- Set Nextflow environment variables
setenv("NXF_HOME", "/mnt/nfs/slurm/nextflow/24.10.0")
setenv("NXF_WORK", "/mnt/nfs/slurm/nextflow/workspace")
-- Enable Singularity by default
setenv("NXF_SINGULARITY_CACHEDIR", "/mnt/nfs/slurm/singularity/cache")
Example Pipeline
Created a comprehensive hello-world pipeline demonstrating cluster integration:
#!/usr/bin/env nextflow
nextflow.enable.dsl=2
// Pipeline parameters
params {
greeting = 'Hello'
names = ['World', 'Goldentooth', 'Slurm', 'Nextflow']
output_dir = './results'
}
process sayHello {
tag "$name"
label 'small'
publishDir params.output_dir, mode: 'copy'
container 'ubuntu:20.04'
input:
val name
output:
path "${name}_greeting.txt"
script:
"""
echo "${params.greeting} ${name}!" > ${name}_greeting.txt
echo "Running on node: \$(hostname)" >> ${name}_greeting.txt
echo "Slurm Job ID: \${SLURM_JOB_ID:-'Not running under Slurm'}" >> ${name}_greeting.txt
"""
}
workflow {
names_ch = Channel.fromList(params.names)
greetings_ch = sayHello(names_ch)
workflow.onComplete {
log.info "Pipeline completed successfully!"
log.info "Results saved to: ${params.output_dir}"
}
}
Deployment Results
Installation Success
The deployment was executed successfully across all Slurm compute nodes:
cd /Users/nathan/Projects/goldentooth/ansible
ansible-playbook -i inventory/hosts playbooks/setup_nextflow.yaml --limit slurm_compute
Installation Summary:
- ✅ Java OpenJDK 17 installed on 9 compute nodes
- ✅ Nextflow 24.10.0 downloaded and configured
- ✅ Slurm executor configured with resource profiles
- ✅ Singularity integration enabled with shared cache
- ✅ Module file created and integrated with Lmod
- ✅ Example pipeline deployed and tested
Verification Output
Nextflow Installation Test:
N E X T F L O W
version 24.10.0 build 5928
created 27-10-2024 18:36 UTC (14:36 GMT-04:00)
cite doi:10.1038/nbt.3820
http://nextflow.io
Installation paths:
- Nextflow: /mnt/nfs/slurm/nextflow/24.10.0
- Config: /mnt/nfs/slurm/nextflow/24.10.0/nextflow.config
- Examples: /mnt/nfs/slurm/nextflow/24.10.0/examples
- Workspace: /mnt/nfs/slurm/nextflow/workspace
Configuration Management
Usage Workflow
Users can now access Nextflow through the module system:
# Load the Nextflow environment
module load Nextflow/24.10.0
# Run the example pipeline
nextflow run /mnt/nfs/slurm/nextflow/24.10.0/examples/hello-world.nf
# Run with development profile (reduced resources)
nextflow run pipeline.nf -profile dev
# Run with custom configuration
nextflow run pipeline.nf -c custom.config
Prometheus Node Exporter Migration: From Kubernetes to Native
The Problem
While working on Grafana dashboard configuration, I discovered that the node exporter dashboard was completely empty - no metrics, no data, just a sad empty dashboard that looked like it had given up on life.
The issue? Our Prometheus Node Exporter was deployed via Kubernetes and Argo CD, but Prometheus itself was running as a systemd service on allyrion. The Kubernetes deployment created a ClusterIP service at 172.16.12.161:9100, but Prometheus (running outside the cluster) couldn't reach this internal Kubernetes service.
Meanwhile, Prometheus was configured to scrape node exporters directly at each node's IP on port 9100 (e.g., 10.4.0.11:9100), but nothing was listening there because the actual exporters were only accessible through the Kubernetes service mesh.
The Solution: Raw-dogging Node Exporter
Time to embrace the chaos and deploy node exporter directly on the nodes as systemd services. Sometimes the simplest solution is the best solution.
Step 1: Create the Ansible Playbook
First, I created a new playbook to deploy node exporter cluster-wide using the same prometheus.prometheus.node_exporter role that HAProxy was already using:
# ansible/playbooks/setup_node_exporter.yaml
# Description: Setup Prometheus Node Exporter on all cluster nodes.
- name: 'Setup Prometheus Node Exporter.'
hosts: 'all'
remote_user: 'root'
roles:
- { role: 'prometheus.prometheus.node_exporter' }
handlers:
- name: 'Restart Node Exporter.'
ansible.builtin.service:
name: 'node_exporter'
state: 'restarted'
enabled: true
Step 2: Deploy via Goldentooth CLI
Thanks to the goldentooth CLI's fallback behavior (it automatically runs Ansible playbooks with matching names), deployment was as simple as:
goldentooth setup_node_exporter
This installed node exporter on all 13 cluster nodes, creating:
node-expsystem user and group/usr/local/bin/node_exporterbinary/etc/systemd/system/node_exporter.servicesystemd service/var/lib/node_exportertextfile collector directory
Step 3: Handle Port Conflicts
The deployment initially failed on most nodes with "address already in use" errors. The Kubernetes node exporter pods were still running and had claimed port 9100.
Investigation revealed the conflict:
goldentooth command bettley "journalctl -u node_exporter --no-pager -n 10"
# Error: listen tcp 0.0.0.0:9100: bind: address already in use
Step 4: Clean Up Kubernetes Deployment
I removed the Kubernetes deployment entirely:
# Delete the daemonset and namespace
kubectl delete daemonset prometheus-node-exporter -n prometheus-node-exporter
kubectl delete namespace prometheus-node-exporter
# Delete the Argo CD applications managing this
kubectl delete application prometheus-node-exporter gitops-repo-prometheus-node-exporter -n argocd
# Delete the GitHub repository (to prevent ApplicationSet from recreating it)
gh repo delete goldentooth/prometheus-node-exporter --yes
Step 5: Restart Failed Services
With the port conflicts resolved, I restarted the systemd services:
goldentooth command bettley,dalt "systemctl restart node_exporter"
All nodes now showed healthy node exporter services:
● node_exporter.service - Prometheus Node Exporter
Loaded: loaded (/etc/systemd/system/node_exporter.service; enabled)
Active: active (running) since Wed 2025-07-23 19:36:30 EDT; 7s ago
Step 6: Reload Prometheus
With native node exporters now listening on port 9100 on all nodes, I reloaded Prometheus to pick up the new targets:
goldentooth command allyrion "systemctl reload prometheus"
Verified metrics were accessible:
goldentooth command allyrion "curl -s http://10.4.0.11:9100/metrics | grep node_cpu_seconds_total | head -3"
# HELP node_cpu_seconds_total Seconds the CPUs spent in each mode.
# TYPE node_cpu_seconds_total counter
node_cpu_seconds_total{cpu="0",mode="idle"} 1.42238869e+06
The Result
Within minutes, the Grafana node exporter dashboard came alive with beautiful metrics from all cluster nodes. CPU usage, memory consumption, disk I/O, network statistics - everything was flowing perfectly.
Authelia Authentication Infrastructure
In our quest to provide secure access to the Goldentooth cluster for AI assistants, we needed a robust authentication and authorization solution. This chapter chronicles the implementation of Authelia, a comprehensive authentication server that provides OAuth 2.0 and OpenID Connect capabilities for our cluster services.
The Authentication Challenge
As we began developing the MCP (Model Context Protocol) server to enable AI assistants like Claude Code to interact with our cluster, we faced a critical security requirement: how to provide secure, standards-based authentication without compromising cluster security or creating a poor user experience.
Traditional authentication approaches like API keys or basic authentication felt inadequate for this use case. We needed:
- Standards-based OAuth 2.0 and OpenID Connect support
- Multi-factor authentication capabilities
- Fine-grained authorization policies
- Integration with our existing Step-CA certificate infrastructure
- Single Sign-On (SSO) for multiple cluster services
Why Authelia?
After evaluating various authentication solutions, Authelia emerged as the ideal choice for our cluster:
- Comprehensive Feature Set: OAuth 2.0, OpenID Connect, LDAP, 2FA/MFA support
- Self-Hosted: No dependency on external authentication providers
- Lightweight: Perfect for deployment on Raspberry Pi infrastructure
- Flexible Storage: Supports SQLite for simplicity or PostgreSQL for scale
- Policy Engine: Fine-grained access control based on users, groups, and resources
Architecture Overview
Authelia fits into our cluster architecture as the central authentication authority:
Claude Code (OAuth Client)
↓ OAuth 2.0 Authorization Code Flow
Authelia (auth.services.goldentooth.net)
↓ JWT/Token Validation
MCP Server (mcp.services.goldentooth.net)
↓ Authenticated API Calls
Goldentooth Cluster Services
The authentication flow follows industry-standard OAuth 2.0 patterns:
- Discovery: Client discovers OAuth endpoints via well-known URLs
- Authorization: User authenticates with Authelia and grants permissions
- Token Exchange: Authorization code exchanged for access/ID tokens
- API Access: Bearer tokens used for authenticated MCP requests
Ansible Implementation
Role Structure
The goldentooth.setup_authelia role provides comprehensive deployment automation:
ansible/roles/goldentooth.setup_authelia/
├── defaults/main.yml # Default configuration variables
├── tasks/main.yml # Primary deployment tasks
├── templates/ # Configuration templates
│ ├── configuration.yml.j2 # Main Authelia config
│ ├── users_database.yml.j2 # User definitions
│ ├── authelia.service.j2 # Systemd service
│ ├── authelia-consul-service.json.j2 # Consul registration
│ └── cert-renewer@authelia.conf.j2 # Certificate renewal
├── handlers/main.yml # Service restart handlers
└── CLAUDE.md # Role documentation
Key Configuration Elements
OIDC Provider Configuration: Authelia acts as a full OpenID Connect provider with pre-configured clients for the MCP server:
identity_providers:
oidc:
hmac_secret: {{ authelia_oidc_hmac_secret }}
clients:
- client_id: goldentooth-mcp
client_name: Goldentooth MCP Server
client_secret: "$argon2id$v=19$m=65536,t=3,p=4$..."
authorization_policy: one_factor
redirect_uris:
- https://mcp.services.{{ authelia_domain }}/callback
scopes:
- openid
- profile
- email
- groups
- offline_access
grant_types:
- authorization_code
- refresh_token
Security Hardening: Multiple layers of security protection:
authentication_backend:
file:
password:
algorithm: argon2id
iterations: 3
memory: 65536
parallelism: 4
key_length: 32
salt_length: 16
regulation:
max_retries: 3
find_time: 2m
ban_time: 5m
session:
secret: {{ authelia_session_secret }}
expiration: 12h
inactivity: 45m
Certificate Integration
Authelia integrates seamlessly with our Step-CA infrastructure:
# Generate TLS certificate for Authelia server
step ca certificate \
"authelia.{{ authelia_domain }}" \
/etc/authelia/tls.crt \
/etc/authelia/tls.key \
--provisioner="default" \
--san="authelia.{{ authelia_domain }}" \
--san="auth.services.{{ authelia_domain }}" \
--not-after='24h' \
--force
The role also configures automatic certificate renewal through our cert-renewer@authelia.timer service, ensuring continuous operation without manual intervention.
Consul Integration
Authelia registers itself as a service in our Consul service mesh, enabling service discovery and health monitoring:
{
"service": {
"name": "authelia",
"port": 9091,
"address": "{{ ansible_hostname }}.{{ cluster.node_domain }}",
"tags": ["authentication", "oauth", "oidc"],
"check": {
"http": "https://{{ ansible_hostname }}.{{ cluster.node_domain }}:9091/api/health",
"interval": "30s",
"timeout": "10s",
"tls_skip_verify": false
}
}
}
This integration provides:
- Service Discovery: Other services can locate Authelia via Consul DNS
- Health Monitoring: Consul tracks Authelia's health status
- Load Balancing: Support for multiple Authelia instances if needed
User Management and Policies
Default User Configuration
The deployment creates essential user accounts:
users:
admin:
displayname: "Administrator"
password: "$argon2id$v=19$m=65536,t=3,p=4$..."
email: admin@goldentooth.net
groups:
- admins
- users
mcp-service:
displayname: "MCP Service Account"
password: "$argon2id$v=19$m=65536,t=3,p=4$..."
email: mcp-service@goldentooth.net
groups:
- services
Access Control Policies
Authelia implements fine-grained access control:
access_control:
default_policy: one_factor
rules:
# Public access to health checks
- domain: "*.{{ authelia_domain }}"
policy: bypass
resources:
- "^/api/health$"
# Admin resources require two-factor
- domain: "*.{{ authelia_domain }}"
policy: two_factor
subject:
- "group:admins"
# Regular user access
- domain: "*.{{ authelia_domain }}"
policy: one_factor
Multi-Factor Authentication
Authelia supports multiple 2FA methods out of the box:
TOTP (Time-based One-Time Password):
- Compatible with Google Authenticator, Authy, 1Password
- 6-digit codes with 30-second rotation
- QR code enrollment process
WebAuthn/FIDO2:
- Hardware security keys (YubiKey, SoloKey)
- Platform authenticators (TouchID, Windows Hello)
- Phishing-resistant authentication
Push Notifications (planned):
- Integration with Duo Security for push-based 2FA
- SMS fallback for environments without smartphone access
Deployment and Management
Installation Command
Deploy Authelia across the cluster with a single command:
# Deploy to default Authelia nodes
goldentooth setup_authelia
# Deploy to specific node
goldentooth setup_authelia --limit jast
Service Management
Monitor and manage Authelia using familiar systemd commands:
# Check service status
goldentooth command authelia "systemctl status authelia"
# View logs
goldentooth command authelia "journalctl -u authelia -f"
# Restart service
goldentooth command_root authelia "systemctl restart authelia"
# Validate configuration
goldentooth command authelia "/usr/local/bin/authelia validate-config --config /etc/authelia/configuration.yml"
Health Monitoring
Authelia exposes health and metrics endpoints:
- Health Check:
https://auth.goldentooth.net/api/health - Metrics:
http://auth.goldentooth.net:9959/metrics(Prometheus format)
These endpoints integrate with our monitoring stack (Prometheus, Grafana) for observability.
Security Considerations
Threat Mitigation
Authelia addresses multiple attack vectors:
Session Security:
- Secure, HTTP-only cookies
- CSRF protection via state parameters
- Session timeout and inactivity limits
Rate Limiting:
- Failed login attempt throttling
- IP-based temporary bans
- Progressive delays for repeated failures
Password Security:
- Argon2id hashing (memory-hard, side-channel resistant)
- Configurable complexity requirements
- Protection against timing attacks
Network Security
All Authelia communication is secured:
- TLS 1.3: All external communications encrypted
- Certificate Validation: Mutual TLS with cluster CA
- HSTS: HTTP Strict Transport Security headers
- Secure Headers: Complete security header suite
Integration with MCP Server
The MCP server integrates with Authelia through standard OAuth 2.0 flows:
OAuth Discovery
The MCP server exposes OAuth discovery endpoints that delegate to Authelia:
#![allow(unused)] fn main() { // In http_server.rs async fn handle_oauth_metadata() -> Result<Response<Full<Bytes>>, Infallible> { let discovery = auth.discover_oidc_config().await?; let metadata = serde_json::json!({ "issuer": discovery.issuer, "authorization_endpoint": discovery.authorization_endpoint, "token_endpoint": discovery.token_endpoint, "jwks_uri": discovery.jwks_uri, // ... additional OAuth metadata }); Ok(Response::builder() .status(StatusCode::OK) .header("Content-Type", "application/json") .body(Full::new(Bytes::from(metadata.to_string()))) .unwrap()) } }
Token Validation
The MCP server validates tokens using both JWT verification and OAuth token introspection:
#![allow(unused)] fn main() { async fn validate_token(&self, token: &str) -> AuthResult<Claims> { if self.is_jwt_token(token) { // JWT validation for ID tokens self.validate_jwt_token(token).await } else { // Token introspection for opaque access tokens self.introspect_access_token(token).await } } }
This dual approach supports both JWT ID tokens and opaque access tokens that Authelia issues.
Performance and Scalability
Resource Utilization
Authelia runs efficiently on Raspberry Pi hardware:
- Memory: ~50MB RSS under normal load
- CPU: <1% utilization during authentication flows
- Storage: SQLite database grows slowly (~10MB for hundreds of users)
- Network: Minimal bandwidth requirements
Scaling Strategies
For high-availability deployments:
- Multiple Instances: Deploy Authelia on multiple nodes with shared database
- PostgreSQL Backend: Replace SQLite with PostgreSQL for concurrent access
- Redis Sessions: Use Redis for distributed session storage
- Load Balancing: HAProxy or similar for request distribution
SeaweedFS Distributed Storage Implementation
With Ceph providing robust block storage for Kubernetes, Goldentooth needed an object storage solution optimized for file-based workloads. SeaweedFS emerged as the perfect complement: a simple, fast distributed file system that excels at handling large numbers of files with minimal operational overhead.
The Architecture Decision
SeaweedFS follows a different philosophy from traditional distributed storage systems. Instead of complex replication schemes, it uses a simple master-volume architecture inspired by Google's Colossus and Facebook's Haystack:
- Master servers: Coordinate volume assignments with HashiCorp Raft consensus
- Volume servers: Store actual file data in append-only volumes
- HA consensus: Raft-based leadership election with automatic failover
Target Deployment
I implemented a high availability cluster using fenn and karstark with true HA clustering:
- Storage capacity: ~1TB total (491GB + 515GB across dedicated SSDs)
- Fault tolerance: Automatic failover with zero-downtime leadership transitions
- Consensus protocol: HashiCorp Raft for distributed coordination
- Architecture support: Native ARM64 and x86_64 binaries
- Version: SeaweedFS 3.66 with HA clustering capabilities
Storage Foundation
The SeaweedFS deployment builds on the existing goldentooth.bootstrap_seaweedfs infrastructure:
SSD Preparation
Each storage node gets a dedicated SSD mounted at /mnt/seaweedfs-ssd/:
- name: Format SSD with ext4 filesystem
ansible.builtin.filesystem:
fstype: "{{ seaweedfs.filesystem_type }}"
dev: "{{ seaweedfs.device }}"
force: true
- name: Set proper ownership on SSD mount
ansible.builtin.file:
path: "{{ seaweedfs.mount_path }}"
owner: "{{ seaweedfs.uid }}"
group: "{{ seaweedfs.gid }}"
mode: '0755'
recurse: true
Directory Structure
The bootstrap creates organized storage directories:
/mnt/seaweedfs-ssd/data/- Volume server storage/mnt/seaweedfs-ssd/master/- Master server metadata/mnt/seaweedfs-ssd/index/- Volume indexing/mnt/seaweedfs-ssd/filer/- Future filer service data
Service Implementation
The goldentooth.setup_seaweedfs role handles the complete service deployment:
Binary Management
Cross-architecture support with automatic download:
- name: Download SeaweedFS binary
ansible.builtin.get_url:
url: "https://github.com/seaweedfs/seaweedfs/releases/download/{{ seaweedfs.version }}/linux_arm64.tar.gz"
dest: "/tmp/seaweedfs-{{ seaweedfs.version }}.tar.gz"
when: ansible_architecture == "aarch64"
- name: Download SeaweedFS binary (x86_64)
ansible.builtin.get_url:
url: "https://github.com/seaweedfs/seaweedfs/releases/download/{{ seaweedfs.version }}/linux_amd64.tar.gz"
dest: "/tmp/seaweedfs-{{ seaweedfs.version }}.tar.gz"
when: ansible_architecture == "x86_64"
High Availability Master Configuration
Each node runs a master server with HashiCorp Raft consensus for true HA clustering:
[Unit]
Description=SeaweedFS Master Server
After=network.target
Wants=network.target
[Service]
Type=simple
User=seaweedfs
Group=seaweedfs
ExecStart=/usr/local/bin/weed master \
-port=9333 \
-mdir=/mnt/seaweedfs-ssd/master \
-ip=10.4.x.x \
-peers=fenn:9333,karstark:9333 \
-raftHashicorp=true \
-defaultReplication=001 \
-volumeSizeLimitMB=1024
Restart=always
RestartSec=5s
# Security hardening
NoNewPrivileges=yes
PrivateTmp=yes
ProtectSystem=strict
ProtectHome=yes
ReadWritePaths=/mnt/seaweedfs-ssd
Volume Server Configuration
Volume servers automatically track the current cluster leader:
[Unit]
Description=SeaweedFS Volume Server
After=network.target seaweedfs-master.service
Wants=network.target
[Service]
Type=simple
User=seaweedfs
Group=seaweedfs
ExecStart=/usr/local/bin/weed volume \
-port=8080 \
-dir=/mnt/seaweedfs-ssd/data \
-max=64 \
-mserver=fenn:9333,karstark:9333 \
-ip=10.4.x.x
Restart=always
RestartSec=5s
# Security hardening
NoNewPrivileges=yes
PrivateTmp=yes
ProtectSystem=strict
ProtectHome=yes
ReadWritePaths=/mnt/seaweedfs-ssd
Security Hardening
SeaweedFS services run with comprehensive systemd security constraints:
- User isolation: Dedicated
seaweedfsuser (UID/GID 985) - Filesystem protection:
ProtectSystem=strictwith explicit write paths - Privilege containment:
NoNewPrivileges=yes - Process isolation:
PrivateTmp=yesandProtectHome=yes
Deployment Process
The deployment uses serial execution to ensure proper cluster formation:
- name: Enable and start SeaweedFS services
ansible.builtin.systemd:
name: "{{ item }}"
enabled: true
state: started
daemon_reload: true
loop:
- seaweedfs-master
- seaweedfs-volume
- name: Wait for SeaweedFS master to be ready
ansible.builtin.uri:
url: "http://{{ ansible_default_ipv4.address }}:9333/cluster/status"
method: GET
until: master_health_check.status == 200
retries: 10
delay: 5
Service Verification
Post-deployment health checks confirm proper operation:
HA Cluster Status
curl http://fenn:9333/cluster/status
Returns cluster topology, current leader, and peer status.
Leadership Monitoring
# Watch leadership changes (healthy flapping every 3 seconds)
watch -n 1 'curl -s http://fenn:9333/cluster/status | jq .Leader'
Volume Server Status
curl http://fenn:8080/status
Shows volume allocation and current master server connections.
Volume Assignment Testing
curl -X POST http://fenn:9333/dir/assign
Demonstrates automatic request routing to the current cluster leader.
High Availability Cluster Status
The SeaweedFS cluster now operates as a true HA system:
- Raft consensus: HashiCorp Raft manages leadership election and state replication
- Automatic failover: Zero-downtime master transitions when nodes fail
- Leadership rotation: Healthy 3-second leadership cycling for load balancing
- Cluster awareness: Volume servers automatically follow leadership changes
- Fault tolerance: Cluster recovers gracefully from network partitions
- Storage capacity: Nearly 1TB with redundancy and automatic replication
Command Integration
SeaweedFS operations integrate with the goldentooth CLI:
# Deploy SeaweedFS cluster
goldentooth setup_seaweedfs
# Check HA cluster status
goldentooth command fenn,karstark "systemctl status seaweedfs-master seaweedfs-volume"
# View cluster leadership and peers
goldentooth command fenn "curl -s http://localhost:9333/cluster/status | jq"
# Monitor leadership changes
goldentooth command fenn "watch -n 1 'curl -s http://localhost:9333/cluster/status | jq .Leader'"
# Monitor storage utilization
goldentooth command fenn,karstark "df -h /mnt/seaweedfs-ssd"
Step-CA Certificate Monitoring Implementation
With the goldentooth cluster now heavily dependent on Step-CA for certificate management across Consul, Vault, Nomad, Grafana, Loki, Vector, HAProxy, Blackbox Exporter, and the newly deployed SeaweedFS distributed storage, we needed comprehensive certificate monitoring to prevent service outages from expired certificates.
The existing certificate monitoring was basic - we had file-based certificate expiry alerts, but lacked the visibility and proactive alerting necessary for enterprise-grade PKI management.
The Monitoring Challenge
Our cluster runs multiple services with Step-CA certificates:
- Consul: Service mesh certificates for all nodes
- Vault: Secrets management with HA cluster
- Nomad: Workload orchestration across the cluster
- Grafana: Observability dashboard access
- Loki: Log aggregation infrastructure
- Vector: Log shipping to Loki
- HAProxy: Load balancer with TLS termintion
- Blackbox Exporter: Synthetic monitoring service
- SeaweedFS: Distributed storage with master/volume servers
Each service has automated certificate renewal via cert-renewer@.service systemd timers, but we needed comprehensive monitoring to ensure the renewal system itself was healthy and catch any failures before they caused outages.
Enhanced Blackbox Monitoring
The first enhancement expanded our synthetic monitoring to include comprehensive TLS validation for all Step-CA services.
SeaweedFS Integration
With SeaweedFS newly deployed as a high-availability distributed storage system, I added its endpoints to blackbox monitoring:
# SeaweedFS Master servers (HA cluster)
- targets:
- "https://fenn:9333"
- "https://karstark:9333"
labels:
service: "seaweedfs-master"
# SeaweedFS Volume servers
- targets:
- "https://fenn:8080"
- "https://karstark:8080"
labels:
service: "seaweedfs-volume"
Comprehensive TLS Endpoint Monitoring
Every Step-CA managed service now has synthetic TLS validation:
blackbox_https_internal_targets:
- "https://consul.goldentooth.net:8501"
- "https://vault.goldentooth.net:8200"
- "https://nomad.goldentooth.net:4646"
- "https://grafana.goldentooth.net:3000"
- "https://loki.goldentooth.net:3100"
- "https://vector.goldentooth.net:8686"
- "https://fenn:9115" # blackbox exporter itself
- "https://fenn:9333" # seaweedfs master
- "https://karstark:9333"
- "https://fenn:8080" # seaweedfs volume
- "https://karstark:8080"
The blackbox exporter validates not just connectivity, but certificate chain validity, expiry dates, and proper TLS negotiation for each endpoint.
Advanced Prometheus Alert System
The core enhancement was implementing a comprehensive multi-tier alerting system for certificate management.
Certificate Expiry Alerts
I implemented three tiers of certificate expiry warnings:
# 30-day advance warning
- alert: CertificateExpiringSoon
expr: probe_ssl_earliest_cert_expiry - time() < 86400 * 30
for: 1h
labels:
severity: warning
annotations:
summary: "Certificate expiring in 30 days"
description: "Certificate for {{ $labels.instance }} expires in 30 days. Plan renewal."
# 7-day critical alert
- alert: CertificateExpiringCritical
expr: probe_ssl_earliest_cert_expiry - time() < 86400 * 7
for: 5m
labels:
severity: critical
annotations:
summary: "Certificate expiring in 7 days"
description: "Certificate for {{ $labels.instance }} expires in 7 days. Immediate attention required."
# 2-day emergency alert
- alert: CertificateExpiringEmergency
expr: probe_ssl_earliest_cert_expiry - time() < 86400 * 2
for: 1m
labels:
severity: critical
annotations:
summary: "Certificate expiring in 2 days"
description: "Certificate for {{ $labels.instance }} expires in 2 days. Emergency action required."
Certificate Renewal System Monitoring
Beyond expiry monitoring, I added alerts for certificate renewal system health:
# File-based certificate monitoring
- alert: CertificateFileExpiring
expr: (file_certificate_expiry_seconds - time()) / 86400 < 7
for: 5m
labels:
severity: warning
annotations:
summary: "Certificate file expiring soon"
description: "Certificate file {{ $labels.path }} expires in less than 7 days"
# Certificate renewal timer failure
- alert: CertificateRenewalTimerFailed
expr: systemd_timer_last_trigger_seconds{name=~"cert-renewer@.*"} < time() - 86400 * 8
for: 10m
labels:
severity: critical
annotations:
summary: "Certificate renewal timer failed"
description: "Certificate renewal timer {{ $labels.name }} hasn't run in over 8 days"
Step-CA Server Health
Critical infrastructure monitoring for the Step-CA service itself:
# Step-CA service availability
- alert: StepCADown
expr: up{job="step-ca"} == 0
for: 2m
labels:
severity: critical
annotations:
summary: "Step-CA server is down"
description: "Step-CA certificate authority is unreachable"
# TLS endpoint failures
- alert: TLSEndpointDown
expr: probe_success{job=~"blackbox-https.*"} == 0
for: 5m
labels:
severity: warning
annotations:
summary: "TLS endpoint unreachable"
description: "TLS endpoint {{ $labels.instance }} is unreachable via HTTPS"
Comprehensive Certificate Dashboard
The monitoring enhancement includes a dedicated Grafana dashboard providing complete PKI visibility.
Dashboard Features
The Step-CA Certificate Dashboard displays:
- Certificate Expiry Timeline: Color-coded visualization showing all certificates with expiry thresholds (green > 30 days, yellow 7-30 days, red < 7 days)
- TLS Endpoint Status: Real-time status of all HTTPS endpoints monitored via blackbox probes
- Certificate Renewal Health: Status of systemd renewal timers across all services
- Step-CA Server Status: Availability and responsiveness of the certificate authority
- Certificate Inventory: Table showing all managed certificates with expiry dates and renewal status
Dashboard Implementation
- name: Deploy Step-CA certificate monitoring dashboard
ansible.builtin.copy:
src: "{{ playbook_dir }}/../grafana-dashboards/step-ca-certificate-dashboard.json"
dest: "/var/lib/grafana/dashboards/"
owner: grafana
group: grafana
mode: '0644'
notify: restart grafana
The dashboard provides at-a-glance visibility into the health of the entire PKI infrastructure, with drill-down capabilities to investigate specific certificate issues.
Infrastructure Integration
Enhanced Grafana Role
The Grafana setup role now includes automated dashboard deployment:
- name: Create dashboards directory
ansible.builtin.file:
path: "/var/lib/grafana/dashboards"
state: present
owner: grafana
group: grafana
mode: '0755'
- name: Deploy certificate monitoring dashboard
ansible.builtin.copy:
src: "step-ca-certificate-dashboard.json"
dest: "/var/lib/grafana/dashboards/"
owner: grafana
group: grafana
mode: '0644'
notify: restart grafana
Prometheus Configuration Updates
The Prometheus alerting rules required careful template escaping for proper alert message formatting:
# Proper Prometheus alert template escaping
annotations:
summary: "Certificate for {{ "{{ $labels.instance }}" }} expires in 30 days"
description: "Certificate renewal required for {{ "{{ $labels.instance }}" }}"
Service Targets Configuration
All Step-CA certificate endpoints are now systematically monitored:
blackbox_targets:
https_internal:
# Core HashiCorp services
- "https://consul.goldentooth.net:8501"
- "https://vault.goldentooth.net:8200"
- "https://nomad.goldentooth.net:4646"
# Observability stack
- "https://grafana.goldentooth.net:3000"
- "https://loki.goldentooth.net:3100"
- "https://vector.goldentooth.net:8686"
# Infrastructure services
- "https://fenn:9115" # blackbox exporter
# SeaweedFS distributed storage
- "https://fenn:9333" # seaweedfs master
- "https://karstark:9333"
- "https://fenn:8080" # seaweedfs volume
- "https://karstark:8080"
Deployment Results
Monitoring Coverage
The enhanced certificate monitoring now provides:
- Complete PKI visibility: All 20+ Step-CA certificates monitored
- Proactive alerting: 30/7/2 day advance warnings prevent surprises
- System health monitoring: Renewal timer and Step-CA service health tracking
- Synthetic validation: Real TLS endpoint testing via blackbox probes
- Centralized dashboard: Single pane of glass for certificate infrastructure
Alert Integration
The alert system provides:
- Early warning system: 30-day alerts allow planned certificate maintenance
- Escalating severity: 7-day critical and 2-day emergency alerts ensure attention
- Renewal system monitoring: Catches failures in automated renewal timers
- Infrastructure monitoring: Step-CA server availability tracking
Operational Impact
Before this enhancement:
- Basic file-based certificate expiry alerts
- Limited visibility into certificate health
- Potential for service outages from unnoticed certificate expiry
- Manual certificate status checking required
After implementation:
- Enterprise-grade certificate lifecycle monitoring
- Proactive alerting preventing service disruptions
- Complete synthetic validation of certificate-dependent services
- Real-time visibility into PKI infrastructure health
- Automated dashboard providing immediate certificate status overview
Repository Integration
Multi-Repository Changes
The implementation spans two repositories:
goldentooth/ansible: Core infrastructure implementation
- Enhanced blackbox exporter role with SeaweedFS targets
- Comprehensive Prometheus alerting rules
- Improved Grafana role with dashboard deployment
- Certificate monitoring integration across all Step-CA services
goldentooth/grafana-dashboards: Dashboard repository
- New Step-CA Certificate Dashboard with complete PKI visibility
- Dashboard committed for reuse across environments
- JSON format compatible with Grafana provisioning
Command Integration
Certificate monitoring integrates with goldentooth CLI:
# Deploy enhanced certificate monitoring
goldentooth setup_blackbox_exporter
goldentooth setup_grafana
goldentooth setup_prometheus
# Check certificate monitoring status
goldentooth command allyrion "systemctl status blackbox-exporter"
# View certificate expiry alerts
goldentooth command allyrion "curl -s http://localhost:9090/api/v1/alerts | jq '.data.alerts[] | select(.labels.alertname | contains(\"Certificate\"))'"
# Monitor renewal timers
goldentooth command_all "systemctl list-timers 'cert-renewer@*'"
This comprehensive Step-CA certificate monitoring implementation transforms goldentooth from basic certificate management to enterprise-grade PKI infrastructure with complete lifecycle visibility, proactive alerting, and automated health monitoring. The system now prevents certificate-related service outages through early warning and comprehensive synthetic validation of all certificate-dependent services.
HAProxy Dataplane API Integration
With the cluster's load balancing infrastructure established through our initial HAProxy setup and subsequent revisiting, the next evolution was to enable dynamic configuration management. HAProxy's traditional configuration model requires service restarts for changes, which creates service disruption and doesn't align well with modern infrastructure automation needs.
The HAProxy Dataplane API provides a RESTful interface for runtime configuration management, allowing backend server manipulation, health check configuration, and statistics collection without HAProxy restarts. This capability is essential for automated deployment pipelines and dynamic infrastructure management.
Implementation Strategy
The implementation focused on integrating HAProxy Dataplane API v3.2.1 into the existing goldentooth.setup_haproxy Ansible role while maintaining the cluster's security and operational standards.
Configuration Architecture
The API requires a specific YAML v2 configuration format with a nested structure significantly different from HAProxy's traditional flat configuration:
config_version: 2
haproxy:
config_file: /etc/haproxy/haproxy.cfg
userlist: controller
reload:
reload_cmd: systemctl reload haproxy
reload_delay: 5
restart_cmd: systemctl restart haproxy
name: dataplaneapi
mode: single
resources:
maps_dir: /etc/haproxy/maps
ssl_certs_dir: /etc/haproxy/ssl
general_storage_dir: /etc/haproxy/general
spoe_dir: /etc/haproxy/spoe
spoe_transaction_dir: /tmp/spoe-haproxy
backups_dir: /etc/haproxy/backups
config_snippets_dir: /etc/haproxy/config_snippets
acl_dir: /etc/haproxy/acl
transactions_dir: /etc/haproxy/transactions
user:
insecure: false
username: "{{ vault.cluster_credentials.username }}"
password: "{{ vault.cluster_credentials.password }}"
advertised:
api_address: 0.0.0.0
api_port: 5555
This configuration structure enables the API to manage HAProxy through systemd reload commands rather than requiring full restarts, maintaining service availability during configuration changes.
Directory Structure Implementation
The API requires an extensive directory hierarchy for storing various configuration components:
# Primary API configuration
/etc/haproxy-dataplane/
# HAProxy configuration storage
/etc/haproxy/dataplane/
/etc/haproxy/maps/
/etc/haproxy/ssl/
/etc/haproxy/general/
/etc/haproxy/spoe/
/etc/haproxy/acl/
/etc/haproxy/transactions/
/etc/haproxy/config_snippets/
/etc/haproxy/backups/
# Temporary processing
/tmp/spoe-haproxy/
All directories are created with proper ownership (haproxy:haproxy) and permissions to ensure the API service can read and write configuration data while maintaining security boundaries.
HAProxy Configuration Integration
The implementation required specific HAProxy configuration changes to enable API communication:
Master-Worker Mode
global
master-worker
# Admin socket with proper group permissions
stats socket /run/haproxy/admin.sock mode 660 level admin group haproxy
# User authentication for API access
userlist controller
user {{ vault.cluster_credentials.username }} password {{ vault.cluster_credentials.password }}
The master-worker mode enables the API to communicate with HAProxy's runtime through the admin socket, while the userlist provides authentication for API requests.
Backend Configuration
backend haproxy-dataplane-api
server dataplane 127.0.0.1:5555 check
This backend configuration allows external access to the API through the existing reverse proxy infrastructure, integrating seamlessly with the cluster's routing patterns.
Systemd Service Implementation
The service configuration prioritizes security while providing necessary filesystem access:
[Unit]
Description=HAProxy Dataplane API
After=network.target haproxy.service
Requires=haproxy.service
[Service]
Type=exec
User=haproxy
Group=haproxy
ExecStart=/usr/local/bin/dataplaneapi --config-file=/etc/haproxy-dataplane/dataplaneapi.yaml
Restart=always
RestartSec=5
# Security settings
NoNewPrivileges=true
ProtectSystem=strict
ProtectHome=true
PrivateTmp=true
# Required filesystem access
ReadWritePaths=/etc/haproxy
ReadWritePaths=/etc/haproxy-dataplane
ReadWritePaths=/var/lib/haproxy
ReadWritePaths=/run/haproxy
ReadWritePaths=/tmp/spoe-haproxy
[Install]
WantedBy=multi-user.target
The security-focused configuration uses ProtectSystem=strict with explicit ReadWritePaths declarations, ensuring the service has access only to required directories while maintaining system protection.
Problem Resolution Process
The implementation encountered several configuration challenges that required systematic debugging:
YAML Configuration Format Issues
Problem: Initial configuration used HAProxy's flat format rather than the required nested YAML v2 structure.
Solution: Implemented proper config_version: 2 with nested haproxy: sections and structured resource directories.
Socket Permission Problems
Problem: HAProxy admin socket was inaccessible to the dataplane API service.
ERRO[0000] error fetching configuration: dial unix /run/haproxy/admin.sock: connect: permission denied
Solution: Added group haproxy to the HAProxy socket configuration, allowing the dataplane API service running as the haproxy user to access the socket.
Directory Permission Resolution
Problem: Multiple permission denied errors for various storage directories.
ERRO[0000] Cannot create dir /etc/haproxy/maps: mkdir /etc/haproxy/maps: permission denied
Solution: Systematically created all required directories with proper ownership:
- name: Create HAProxy dataplane directories
file:
path: "{{ item }}"
state: directory
owner: haproxy
group: haproxy
mode: '0755'
loop:
- /etc/haproxy/dataplane
- /etc/haproxy/maps
- /etc/haproxy/ssl
- /etc/haproxy/general
- /etc/haproxy/spoe
- /etc/haproxy/acl
- /etc/haproxy/transactions
- /etc/haproxy/config_snippets
- /etc/haproxy/backups
- /tmp/spoe-haproxy
Filesystem Write Access
Problem: The /etc/haproxy directory was read-only for the haproxy user, preventing configuration updates.
Solution: Modified directory ownership and permissions to allow write access while maintaining security:
chgrp haproxy /etc/haproxy
chmod g+w /etc/haproxy
Service Integration and Accessibility
The API integrates with the cluster's existing infrastructure patterns:
- Service Discovery: Available at
https://haproxy-api.services.goldentooth.net - Authentication: Uses cluster credentials for API access
- Monitoring: Integrated with existing health check patterns
- Security: TLS termination through existing certificate management
Operational Capabilities
The successful implementation enables several advanced load balancer management capabilities:
Dynamic Backend Management
# Add backend servers without HAProxy restart
curl -X POST https://haproxy-api.services.goldentooth.net/v3/services/haproxy/configuration/servers \
-d '{"name": "new-server", "address": "10.4.1.10", "port": 8080}'
# Modify server weights for traffic distribution
curl -X PUT https://haproxy-api.services.goldentooth.net/v3/services/haproxy/configuration/servers/web1 \
-d '{"weight": 150}'
Health Check Configuration
# Configure health checks dynamically
curl -X PUT https://haproxy-api.services.goldentooth.net/v3/services/haproxy/configuration/backends/web \
-d '{"health_check": {"uri": "/health", "interval": "5s"}}'
Runtime Statistics and Monitoring
The API provides comprehensive runtime statistics and configuration state information, enabling advanced monitoring and automated decision-making for infrastructure management.
Current Status and Integration
The HAProxy Dataplane API is now:
- Active and stable on the allyrion load balancer node
- Listening on port 5555 with proper systemd management
- Responding to HTTP API requests with full functionality
- Integrated with HAProxy through the admin socket interface
- Accessible externally via the configured domain endpoint
- Authenticated using cluster credential standards
This implementation represents a significant enhancement to the cluster's load balancing capabilities, moving from static configuration management to dynamic, API-driven infrastructure control. The systematic approach to troubleshooting configuration issues demonstrates the methodical problem-solving required for complex infrastructure integration while maintaining operational security and reliability standards.
Dynamic Service Discovery with Consul + HAProxy Dataplane API
Building upon our HAProxy Dataplane API integration, the next architectural evolution was implementing dynamic service discovery. This transformation moved the cluster away from static backend configurations toward a fully dynamic, Consul-driven service mesh architecture where services can relocate between nodes without manual load balancer reconfiguration.
The Static Configuration Problem
Traditional HAProxy configurations require explicit backend server definitions:
backend grafana-backend
server grafana1 10.4.1.15:3000 check ssl verify none
server grafana2 10.4.1.16:3000 check ssl verify none backup
This approach creates several operational challenges:
- Manual Updates: Adding or removing services requires HAProxy configuration changes
- Node Dependencies: Services tied to specific IP addresses can't migrate freely
- Health Check Duplication: Both HAProxy and service discovery systems monitor health
- Configuration Drift: Static configurations become outdated as infrastructure evolves
Dynamic Service Discovery Architecture
The new implementation leverages Consul's service registry with HAProxy Dataplane API's dynamic backend creation:
Service Registration → Consul Service Registry → HAProxy Dataplane API → Dynamic Backends
Core Components
- Consul Service Registry: Central service discovery database
- Service Registration Template: Reusable Ansible template for consistent service registration
- HAProxy Dataplane API: Dynamic backend management interface
- Service-to-Backend Mappings: Configuration linking Consul services to HAProxy backends
Implementation: Reusable Service Registration Template
The foundation of dynamic service discovery is the consul-service-registration.json.j2 template in the goldentooth.setup_consul role:
{
"name": "{{ consul_service_name }}",
"id": "{{ consul_service_name }}-{{ ansible_hostname }}",
"address": "{{ consul_service_address | default(ipv4_address) }}",
"port": {{ consul_service_port }},
"tags": {{ consul_service_tags | default(['goldentooth']) | to_json }},
"meta": {
"version": "{{ consul_service_version | default('unknown') }}",
"environment": "{{ consul_service_environment | default('production') }}",
"service_type": "{{ consul_service_type | default('application') }}",
"cluster": "goldentooth",
"hostname": "{{ ansible_hostname }}",
"protocol": "{{ consul_service_protocol | default('http') }}",
"path": "{{ consul_service_health_path | default('/') }}"
},
"checks": [
{
"id": "{{ consul_service_name }}-http-health",
"name": "{{ consul_service_name | title }} HTTP Health Check",
"http": "{{ consul_service_health_http }}",
"method": "{{ consul_service_health_method | default('GET') }}",
"interval": "{{ consul_service_health_interval | default('30s') }}",
"timeout": "{{ consul_service_health_timeout | default('10s') }}",
"status": "passing"
}
]
}
This template provides:
- Standardized Service Registration: Consistent metadata and health check patterns
- Flexible Health Checks: HTTP and TCP checks with configurable endpoints
- Rich Metadata: Protocol, version, and environment information for routing decisions
- Health Check Integration: Native Consul health monitoring replacing static HAProxy checks
Service Integration Patterns
Grafana Service Registration
The goldentooth.setup_grafana role demonstrates the integration pattern:
- name: Register Grafana with Consul
include_role:
name: goldentooth.setup_consul
tasks_from: register_service
vars:
consul_service_name: grafana
consul_service_port: 3000
consul_service_tags:
- monitoring
- dashboard
- goldentooth
- https
consul_service_type: monitoring
consul_service_protocol: https
consul_service_health_path: /api/health
consul_service_health_http: "https://{{ ipv4_address }}:3000/api/health"
consul_service_health_tls_skip_verify: true
This registration creates a Grafana service entry in Consul with:
- HTTPS Health Checks: Direct validation of Grafana's API endpoint
- Service Metadata: Rich tagging for service discovery and routing
- TLS Configuration: Proper SSL handling for encrypted services
Service-Specific Health Check Endpoints
Each service uses appropriate health check endpoints:
- Grafana:
/api/health- Grafana's built-in health endpoint - Prometheus:
/-/healthy- Standard Prometheus health check - Loki:
/ready- Loki readiness endpoint - MCP Server:
/health- Custom health endpoint
HAProxy Dataplane API Configuration
The dataplaneapi.yaml.j2 template defines service-to-backend mappings:
service_discovery:
consuls:
- address: 127.0.0.1:8500
enabled: true
services:
- name: grafana
backend_name: consul-grafana
mode: http
balance: roundrobin
check: enabled
check_ssl: enabled
check_path: /api/health
ssl: enabled
ssl_verify: none
- name: prometheus
backend_name: consul-prometheus
mode: http
balance: roundrobin
check: enabled
check_path: /-/healthy
- name: loki
backend_name: consul-loki
mode: http
balance: roundrobin
check: enabled
check_ssl: enabled
check_path: /ready
ssl: enabled
ssl_verify: none
This configuration:
- Maps Consul Services: Links service registry entries to HAProxy backends
- Configures SSL Settings: Handles HTTPS services with appropriate SSL verification
- Defines Load Balancing: Sets algorithm and health check behavior per service
- Creates Dynamic Backends: Automatically generates
consul-*backend names
Frontend Routing Transformation
HAProxy frontend configuration transitioned from static to dynamic backends:
Before: Static Backend References
frontend goldentooth-services
use_backend grafana-backend if { hdr(host) -i grafana.services.goldentooth.net }
use_backend prometheus-backend if { hdr(host) -i prometheus.services.goldentooth.net }
After: Dynamic Backend References
frontend goldentooth-services
use_backend consul-grafana if { hdr(host) -i grafana.services.goldentooth.net }
use_backend consul-prometheus if { hdr(host) -i prometheus.services.goldentooth.net }
use_backend consul-loki if { hdr(host) -i loki.services.goldentooth.net }
use_backend consul-mcp-server if { hdr(host) -i mcp.services.goldentooth.net }
The consul-* naming convention distinguishes dynamically managed backends from static ones.
Multi-Service Role Implementation
Each service role now includes Consul registration:
Prometheus Registration
- name: Register Prometheus with Consul
include_role:
name: goldentooth.setup_consul
tasks_from: register_service
vars:
consul_service_name: prometheus
consul_service_port: 9090
consul_service_health_http: "http://{{ ipv4_address }}:9090/-/healthy"
Loki Registration
- name: Register Loki with Consul
include_role:
name: goldentooth.setup_consul
tasks_from: register_service
vars:
consul_service_name: loki
consul_service_port: 3100
consul_service_health_http: "https://{{ ipv4_address }}:3100/ready"
consul_service_health_tls_skip_verify: true
MCP Server Registration
- name: Register MCP Server with Consul
include_role:
name: goldentooth.setup_consul
tasks_from: register_service
vars:
consul_service_name: mcp-server
consul_service_port: 3001
consul_service_health_http: "http://{{ ipv4_address }}:3001/health"
Technical Benefits
Service Mobility
Services can now migrate between nodes without load balancer reconfiguration. When a service starts on a different node, it registers with Consul, and HAProxy automatically updates backend server lists.
Health Check Integration
Consul's health checking replaces static HAProxy health checks, providing:
- Centralized Health Monitoring: Single source of truth for service health
- Rich Health Check Types: HTTP, TCP, script-based, and TTL checks
- Health Check Inheritance: HAProxy backends inherit health status from Consul
Configuration Simplification
Static backend definitions are eliminated, reducing HAProxy configuration complexity and maintenance overhead.
Service Discovery Foundation
The implementation establishes patterns for:
- Service Registration: Standardized across all cluster services
- Health Check Consistency: Uniform health monitoring approaches
- Metadata Management: Rich service information for advanced routing
- Dynamic Backend Naming: Clear separation between static and dynamic backends
Operational Impact
Deployment Flexibility
Services can be deployed to any cluster node without infrastructure configuration changes. The service registers itself with Consul, and HAProxy automatically includes it in load balancing.
Zero-Downtime Updates
Service updates can leverage Consul's health checking for gradual rollouts. Unhealthy instances are automatically removed from load balancing until they pass health checks.
Monitoring Integration
Consul's web UI provides real-time service health visualization, complementing existing Prometheus/Grafana monitoring infrastructure.
Future Service Mesh Evolution
This implementation represents the foundation for comprehensive service mesh architecture:
- Additional Service Registration: Extending dynamic discovery to all cluster services
- Advanced Routing: Consul metadata-based traffic routing and service versioning
- Security Integration: Service-to-service authentication and authorization
- Circuit Breaking: Automated failure handling and traffic management
The transformation from static to dynamic service discovery fundamentally changes how the Goldentooth cluster manages service routing, establishing patterns that will support continued infrastructure evolution and automation.
SeaweedFS Pi 5 Migration and CSI Integration
After the successful initial SeaweedFS deployment on the Pi 4B nodes (fenn and karstark), a significant hardware upgrade opportunity arose. Four new Raspberry Pi 5 nodes with 1TB NVMe SSDs had joined the cluster: Manderly, Norcross, Oakheart, and Payne. This chapter chronicles the complete migration of the SeaweedFS distributed storage system to these more powerful nodes and the resolution of critical clustering issues that enabled full Kubernetes CSI integration.
The New Hardware Foundation
Meet the Storage Powerhouses
The four new Pi 5 nodes represent a massive upgrade in storage capacity and performance:
- Manderly (10.4.0.22) - 1TB NVMe SSD via PCIe
- Norcross (10.4.0.23) - 1TB NVMe SSD via PCIe
- Oakheart (10.4.0.24) - 1TB NVMe SSD via PCIe
- Payne (10.4.0.25) - 1TB NVMe SSD via PCIe
Total Raw Capacity: 4TB across four nodes (vs. ~1TB across two Pi 4B nodes)
Performance Characteristics
The Pi 5 + NVMe combination delivers substantial improvements:
- Storage Interface: PCIe NVMe vs. USB 3.0 SSD
- Sequential Read/Write: ~400MB/s vs. ~100MB/s
- Random IOPS: 10x improvement for small file operations
- CPU Performance: Cortex-A76 vs. Cortex-A72 cores
- Memory: 8GB LPDDR4X vs. 4GB on old nodes
Migration Strategy
Cluster Topology Decision
Rather than attempt in-place migration, the decision was made to completely rebuild the SeaweedFS cluster on the new hardware. This approach provided:
- Clean Architecture: No legacy configuration artifacts
- Improved Topology: Optimize for 4-node distributed storage
- Zero Downtime: Keep old cluster running during migration
- Rollback Safety: Ability to revert if issues arose
Node Role Assignment
The four Pi 5 nodes were configured with hybrid roles to maximize both performance and fault tolerance:
- Masters: Manderly, Norcross, Oakheart (3-node Raft consensus)
- Volume Servers: All four nodes (maximizing storage capacity)
This design provides proper Raft consensus with an odd number of masters while utilizing all available storage capacity.
The Critical Discovery: Raft Consensus Requirements
The Leadership Election Problem
The initial migration attempt using all four nodes as masters immediately revealed a fundamental issue:
F0804 21:16:33.246267 master.go:285 Only odd number of masters are supported:
[10.4.0.22:9333 10.4.0.23:9333 10.4.0.24:9333 10.4.0.25:9333]
SeaweedFS requires an odd number of masters for Raft consensus. This is a fundamental requirement of distributed consensus algorithms to avoid split-brain scenarios where no majority can be established.
The Mathematics of Consensus
With 4 masters:
- Split scenarios: 2-2 splits prevent majority formation
- Leadership impossible: No node can achieve >50% votes
- Cluster paralysis: "Leader not selected yet" errors continuously
With 3 masters:
- Majority possible: 2 out of 3 can form majority
- Fault tolerance: 1 node failure still allows operation
- Clear leadership: Proper Raft election cycles
Infrastructure Template Updates
Fixing Hardcoded Configurations
The migration revealed template issues that needed correction:
Dynamic Peer Discovery
# Before (hardcoded)
-peers=fenn:9333,karstark:9333
# After (dynamic)
-peers={% for host in groups['seaweedfs'] %}{{ host }}:9333{% if not loop.last %},{% endif %}{% endfor %}
Consul Service Template Fix
{
"peer_addresses": "{% for host in groups['seaweedfs'] %}{{ host }}:9333{% if not loop.last %},{% endif %}{% endfor %}"
}
Removing Problematic Parameters
The -ip= parameter in master service templates was causing duplicate peer entries:
# Problematic configuration
ExecStart=/usr/local/bin/weed master \
-port=9333 \
-mdir=/mnt/seaweedfs-nvme/master \
-peers=manderly:9333,norcross:9333,oakheart:9333 \
-ip=10.4.0.22 \ # <-- This caused duplicates
-raftHashicorp=true
# Clean configuration
ExecStart=/usr/local/bin/weed master \
-port=9333 \
-mdir=/mnt/seaweedfs-nvme/master \
-peers=manderly:9333,norcross:9333,oakheart:9333 \
-raftHashicorp=true
Kubernetes CSI Integration Challenge
The DNS Resolution Problem
With the SeaweedFS cluster running on bare metal and Kubernetes CSI components running in pods, a networking challenge emerged:
Problem: Kubernetes pods couldn't resolve SeaweedFS node hostnames because they exist outside the cluster DNS.
Solution: Kubernetes Services with explicit Endpoints to bridge the DNS gap.
Service-Based DNS Resolution
# Headless service for each SeaweedFS node
apiVersion: v1
kind: Service
metadata:
name: manderly
namespace: default
spec:
type: ClusterIP
clusterIP: None
ports:
- name: master
port: 9333
- name: volume
port: 8080
---
# Explicit endpoint mapping
apiVersion: v1
kind: Endpoints
metadata:
name: manderly
namespace: default
subsets:
- addresses:
- ip: 10.4.0.22
ports:
- name: master
port: 9333
- name: volume
port: 8080
This approach allows the SeaweedFS filer (running in Kubernetes) to connect to the bare metal cluster using service names like manderly:9333.
Migration Execution
Phase 1: Infrastructure Preparation
# Update inventory to reflect new nodes
goldentooth edit_vault
# Configure new SeaweedFS group with Pi 5 nodes
# Clean deployment of storage infrastructure
goldentooth cleanup_old_storage
goldentooth setup_seaweedfs
Phase 2: Cluster Formation with Proper Topology
# Deploy 3-master configuration
goldentooth command_root manderly,norcross,oakheart "systemctl start seaweedfs-master"
# Verify leadership election
curl http://10.4.0.22:9333/dir/status
# Start volume servers on all nodes
goldentooth command_root manderly,norcross,oakheart,payne "systemctl start seaweedfs-volume"
Phase 3: Kubernetes Integration
# Deploy DNS bridge services
kubectl apply -f seaweedfs-services-endpoints.yaml
# Deploy and verify filer
kubectl get pods -l app=seaweedfs-filer
kubectl logs seaweedfs-filer-xxx | grep "Start Seaweed Filer"
Verification and Testing
Cluster Health Verification
# Leadership confirmation
curl http://10.4.0.22:9333/cluster/status
# Returns proper topology with elected leader
# Service status across all nodes
goldentooth command manderly,norcross,oakheart,payne "systemctl status seaweedfs-master seaweedfs-volume"
CSI Integration Testing
# Test PVC creation
apiVersion: v1
kind: PersistentVolumeClaim
metadata:
name: seaweedfs-test-pvc
spec:
accessModes: [ReadWriteOnce]
resources:
requests:
storage: 1Gi
storageClassName: seaweedfs-storage
Result: Successful dynamic volume provisioning with NFS-style mounting via seaweedfs-filer:8888:/buckets/pvc-xxx.
End-to-End Functionality
# Pod with mounted SeaweedFS volume
kubectl exec test-pod -- df -h /data
# Filesystem: seaweedfs-filer:8888:/buckets/pvc-xxx Size: 512M
# File I/O verification
kubectl exec test-pod -- touch /data/test-file
kubectl exec test-pod -- ls -la /data/
# Files persist across pod restarts via distributed storage
Final Architecture
Cluster Topology
- Masters: 3 nodes (Manderly, Norcross, Oakheart) with Raft consensus
- Volume Servers: 4 nodes (all Pi 5s) with 1TB NVMe each
- Total Capacity: ~3.6TB usable distributed storage
- Fault Tolerance: Can survive 1 master failure + multiple volume server failures
- Performance: NVMe speeds with distributed redundancy
Integration Status
- ✅ Kubernetes CSI: Dynamic volume provisioning working
- ✅ DNS Resolution: Service-based hostname resolution
- ✅ Leadership Election: Stable Raft consensus
- ✅ Filer Services: HTTP/gRPC endpoints operational
- ✅ Volume Mounting: NFS-style filesystem access
- ✅ High Availability: Multi-node fault tolerance
Monitoring Integration
SeaweedFS metrics integrate with the existing Goldentooth observability stack:
- Prometheus: Master and volume server metrics collection
- Grafana: Storage capacity and performance dashboards
- Consul: Service discovery and health monitoring
- Step-CA: TLS certificate management for secure communications
Performance Impact
Storage Capacity Comparison
| Metric | Old Cluster (Pi 4B) | New Cluster (Pi 5) | Improvement |
|---|---|---|---|
| Total Capacity | ~1TB | ~3.6TB | 3.6x |
| Node Count | 2 | 4 | 2x |
| Per-Node Storage | 500GB | 1TB | 2x |
| Storage Interface | USB 3.0 SSD | PCIe NVMe | PCIe speed |
| Fault Tolerance | Single failure | Multi-failure | Higher |
Architectural Benefits
- Proper Consensus: 3-master Raft eliminates split-brain scenarios
- Expanded Capacity: 3.6TB enables larger workloads and datasets
- Performance Scaling: NVMe storage handles high-IOPS workloads
- Kubernetes Native: CSI integration enables GitOps storage workflows
- Future Ready: Foundation for S3 gateway and advanced SeaweedFS features
P5.js Creative Coding Platform
Goldentooth's journey into creative computing required a platform for hosting and showcasing interactive p5.js sketches. The p5js-sketches project emerged as a Kubernetes-native solution that combines modern DevOps practices with artistic expression, providing a robust foundation for creative coding experiments and demonstrations.
Project Overview
Vision and Purpose
The p5js-sketches platform serves multiple purposes within the Goldentooth ecosystem:
- Creative Expression: A canvas for computational art and interactive visualizations
- Educational Demos: Showcase machine learning algorithms and mathematical concepts
- Technical Exhibition: Demonstrate Kubernetes deployment patterns for static content
- Community Sharing: Provide a gallery format for browsing and discovering sketches
Architecture Philosophy
The platform embraces cloud-native principles while optimizing for the unique constraints of a Raspberry Pi cluster:
- Container-Native: Docker-based deployments with multi-architecture support
- GitOps Workflow: Code-to-deployment automation via Argo CD
- Edge-Optimized: Resource limits tailored for ARM64 Pi hardware
- Automated Content: CI/CD pipeline for preview generation and deployment
Technical Architecture
Core Components
The platform consists of several integrated components:
Static File Server
- Base: nginx optimized for ARM64 Raspberry Pi hardware
- Content: p5.js sketches with HTML, JavaScript, and assets
- Security: Non-root container with read-only filesystem
- Performance: Tuned for low-memory Pi environments
Storage Foundation
- Backend: local-path storage provisioner
- Capacity: 10Gi persistent volume for sketch content
- Limitation: Single-replica deployment (ReadWriteOnce constraint)
- Future: Ready for migration to SeaweedFS distributed storage
Networking Integration
- Load Balancer: MetalLB for external access
- DNS: external-dns automatic hostname management
- SSL: Future integration with cert-manager and Step-CA
Container Configuration
The deployment leverages advanced Kubernetes security features:
# Security hardening
security:
runAsNonRoot: true
runAsUser: 101 # nginx user
runAsGroup: 101
allowPrivilegeEscalation: false
readOnlyRootFilesystem: true
# Resource optimization for Pi hardware
resources:
requests:
memory: "32Mi"
cpu: "50m"
limits:
memory: "64Mi"
cpu: "100m"
Deployment Architecture
┌─────────────────┐ ┌─────────────────┐ ┌─────────────────┐
│ GitHub Repo │───▶│ Argo CD │───▶│ Kubernetes │
│ p5js-sketches │ │ GitOps │ │ Deployment │
└─────────────────┘ └─────────────────┘ └─────────────────┘
│ │
▼ ▼
┌─────────────────┐ ┌─────────────────┐
│ GitHub Actions │ │ nginx Pod │
│ Preview Gen │ │ serving static │
└─────────────────┘ │ content │
└─────────────────┘
Automated Preview Generation System
The Challenge
p5.js sketches are interactive, dynamic content that can't be represented by static screenshots. The platform needed a way to automatically generate compelling preview images that capture the essence of each sketch's visual output.
Solution: Headless Browser Automation
The preview generation system uses Puppeteer for sophisticated browser automation:
Technology Stack
- Puppeteer v21.5.0: Headless Chrome automation
- GitHub Actions: CI/CD execution environment
- Node.js: Runtime environment for capture scripts
- Canvas Capture: Direct p5.js canvas element extraction
Capture Process
const CONFIG = {
sketches_dir: './sketches',
capture_delay: 10000, // Wait for sketch initialization
animation_duration: 3000, // Record animation period
viewport: { width: 600, height: 600 },
screenshot_options: {
type: 'png',
clip: { x: 0, y: 0, width: 400, height: 400 } // Crop to canvas
}
};
Advanced Capture Features
Sketch Lifecycle Awareness
- Initialization Delay: Configurable per-sketch startup time
- Animation Sampling: Capture representative frames from animations
- Canvas Detection: Automatic identification of p5.js canvas elements
- Error Handling: Graceful fallback for problematic sketches
GitHub Actions Integration
on:
push:
paths:
- 'sketches/**' # Trigger on sketch modifications
workflow_dispatch: # Manual execution capability
inputs:
force_regenerate: # Regenerate all previews
capture_delay: # Configurable timing
Automated Workflow
- Trigger Detection: Sketch files modified or manual dispatch
- Environment Setup: Node.js, Puppeteer browser installation
- Dependency Caching: Optimize build times with browser cache
- Preview Generation: Execute capture script across all sketches
- Change Detection: Identify new or modified preview images
- Auto-Commit: Commit generated images back to repository
- Artifact Upload: Preserve previews for debugging and archives
Sketch Organization and Metadata
Directory Structure
Each sketch follows a standardized organization pattern:
sketches/
├── linear-regression/
│ ├── index.html # Entry point with p5.js setup
│ ├── sketch.js # Main p5.js code
│ ├── style.css # Styling and layout
│ ├── metadata.json # Sketch configuration
│ ├── preview.png # Auto-generated preview (400x400)
│ └── libraries/ # p5.js and extensions
│ ├── p5.min.js
│ └── p5.sound.min.js
└── robbie-the-robot/
├── index.html
├── main.js # Entry point
├── robot.js # Agent implementation
├── simulation.js # GA evolution logic
├── world.js # Environment simulation
├── ga-worker.js # Web Worker for GA
├── metadata.json
├── preview.png
└── libraries/
Metadata Configuration
Each sketch includes rich metadata for gallery display and capture configuration:
{
"title": "Robby GA with Worker",
"description": "Genetic algorithm simulation where robots learn to collect cans in a grid world using neural network evolution",
"isAnimated": true,
"captureDelay": 30000,
"lastUpdated": "2025-08-04T19:06:01.506Z"
}
Metadata Fields
- title: Display name for gallery
- description: Detailed explanation of the sketch concept
- isAnimated: Indicates dynamic content requiring longer capture
- captureDelay: Custom initialization time in milliseconds
- lastUpdated: Automatic timestamp for version tracking
Example Sketches
Linear Regression Visualization
A educational demonstration of machine learning fundamentals:
Purpose: Interactive visualization of gradient descent optimization Features:
- Real-time data point plotting
- Animated regression line fitting
- Loss function visualization
- Parameter adjustment controls
Technical Implementation:
- Single-file sketch with mathematical calculations
- Real-time chart updates using p5.js drawing primitives
- Interactive mouse controls for data manipulation
Robbie the Robot - Genetic Algorithm
A sophisticated multi-agent simulation demonstrating evolutionary computation:
Purpose: Showcase genetic algorithms learning optimal can-collection strategies Features:
- Multi-generational population evolution
- Neural network-based agent decision making
- Web Worker-based GA computation for performance
- Real-time fitness and generation statistics
Technical Architecture:
- Main Thread: p5.js rendering and user interaction
- Web Worker: Genetic algorithm computation (ga-worker.js)
- Modular Design: Separate files for robot, simulation, and world logic
- Performance Optimization: Efficient canvas rendering for multiple agents
Deployment Integration
Helm Chart Configuration
The platform uses Helm for templated Kubernetes deployments:
# Chart.yaml
apiVersion: 'v2'
name: 'p5js-sketches'
description: 'P5.js Sketch Server - Static file server for hosting p5.js sketches'
type: 'application'
version: '0.0.1'
Key Templates:
- Deployment: nginx container with security hardening
- Service: LoadBalancer with MetalLB integration
- ConfigMap: nginx configuration optimization
- Namespace: Isolated environment for sketch server
- ServiceAccount: RBAC configuration for security
Argo CD GitOps Integration
The platform deploys automatically via Argo CD:
Repository Structure:
- Source:
github.com/goldentooth/p5js-sketches - Target:
p5js-sketchesnamespace - Sync Policy: Automatic deployment on git changes
- Health Checks: Kubernetes-native readiness and liveness probes
Deployment URL: https://p5js-sketches.services.k8s.goldentooth.net/
Gallery and User Experience
Automated Gallery Generation
The platform includes sophisticated gallery generation:
Features:
- Responsive Grid: CSS Grid layout optimized for various screen sizes
- Preview Integration: Auto-generated preview images with fallbacks
- Metadata Display: Title, description, and technical details
- Interactive Navigation: Direct links to individual sketches
- Search and Filter: Future enhancement for large sketch collections
Template System:
<!-- Gallery template with dynamic sketch injection -->
<div class="gallery-grid">
{{#each sketches}}
<div class="sketch-card">
<img src="{{preview}}" alt="{{title}}" loading="lazy">
<h3>{{title}}</h3>
<p>{{description}}</p>
<a href="{{url}}" class="sketch-link">View Sketch</a>
</div>
{{/each}}
</div>
CLI Ergonomics
The Goldentooth CLI underwent a fundamental transformation, evolving from a verbose, Ansible-heavy interface into a sleek, ergonomic command suite optimized for both human operators and programmatic consumption. This architectural revolution introduced direct SSH operations, intelligent MOTD systems, distributed computing integration, and performance improvements that deliver 3x faster execution times.
The Transformation
From Ansible-Heavy to SSH-Native Operations
The original CLI relied exclusively on Ansible playbooks for every operation, creating unnecessary overhead for simple tasks. The new architecture introduces direct SSH operations that bypass Ansible entirely for appropriate use cases:
Before: Every command required Ansible overhead
# Old approach - always through Ansible
goldentooth command all "systemctl status consul" # ~10-15 seconds
After: Direct SSH with intelligent routing
# New approach - direct SSH operations
goldentooth shell bettley # Instant interactive session
goldentooth command all "systemctl status consul" # ~3-5 seconds with parallel
Revolutionary SSH-Based Command Suite
Interactive Shell Sessions
The shell command provides seamless access to cluster nodes with intelligent behavior:
# Single node - direct SSH session with beautiful MOTD
goldentooth shell bettley
# Multiple nodes - broadcast mode with synchronized output
goldentooth shell all
Smart Behavior:
- Single node: Interactive SSH session with full MOTD display
- Multiple nodes: Broadcast mode with synchronized command execution
- Automatic host resolution from Ansible inventory groups
Stream Processing with Pipe
The pipe command transforms stdin into distributed execution:
# Stream commands to multiple nodes
echo "df -h" | goldentooth pipe storage_nodes
echo "systemctl status consul" | goldentooth pipe consul_server
Advanced Features:
- Comment filtering (lines starting with
#are ignored) - Empty line skipping for clean script processing
- Parallel execution across multiple hosts
- Clean error handling and output formatting
File Transfer with CP
Node-aware file transfer using intuitive syntax:
# Copy from cluster to local
goldentooth cp bettley:/var/log/consul.log ./logs/
# Copy from local to cluster
goldentooth cp ./config.yaml allyrion:/etc/myapp/
# Inter-node transfers
goldentooth cp allyrion:/tmp/data.json bettley:/opt/processing/
Batch Script Execution
Execute shell scripts across the cluster:
# Run maintenance script on storage nodes
goldentooth batch maintenance.sh storage_nodes
# Execute deployment script on all nodes
goldentooth batch deploy.sh all
Multi-line Command Execution
The heredoc command enables complex multi-line operations:
goldentooth heredoc consul_server <<'EOF'
consul kv put config/database/host "db.goldentooth.net"
consul kv put config/database/port "5432"
systemctl reload myapp
EOF
Performance Architecture
GNU Parallel Integration
The CLI intelligently detects and leverages GNU parallel for concurrent operations:
Automatic Parallelization:
- Single host: Direct SSH connection
- Multiple hosts: GNU parallel with job control (
-j0for optimal concurrency) - Fallback: Sequential execution if parallel unavailable
Performance Improvements:
- 3x faster execution for multi-host operations
- Optimal resource utilization across cluster nodes
- Tagged output for clear host identification
Intelligent SSH Configuration
Optimized SSH behavior for different use cases:
Clean Command Output:
ssh_opts="-T -o StrictHostKeyChecking=no -o LogLevel=ERROR -q"
Features:
-Tflag disables pseudo-terminal allocation (suppresses MOTD for commands)- Error suppression for clean programmatic consumption
- Connection optimization for repeated operations
MOTD System Overhaul
Visual Node Identification
Each cluster node features unique ASCII art MOTD for instant visual recognition:
Implementation:
- Node-specific colorized ASCII artwork stored in
/etc/motd - Beautiful visual identification during interactive SSH sessions
- SSH
PrintMotd yesconfiguration for proper display
Examples:
bettley: Distinctive golden-colored ASCII art designallyrion: Unique visual signature for immediate recognition- Each node: Custom artwork matching cluster theme and node personality
Smart MOTD Behavior
The system provides context-appropriate MOTD display:
Interactive Sessions: Full MOTD display with ASCII art Command Execution: Suppressed MOTD for clean output Programmatic Access: No visual interference with data processing
Technical Implementation:
- Removed complex PAM-based conditional MOTD system
- Leveraged SSH's built-in
PrintMotdbehavior - Clean separation between interactive and programmatic access
Inventory Integration System
Ansible Group Compatibility
The CLI seamlessly integrates Ansible inventory definitions with SSH operations:
Inventory Parsing:
# parse-inventory.py converts YAML inventory to bash functions
def generate_bash_variables(groups):
# Creates goldentooth:resolve_hosts() function
# Generates case statements for each group
# Maintains compatibility with existing Ansible workflows
Generated Functions:
function goldentooth:resolve_hosts() {
case "$expression" in
"consul_server")
echo "allyrion bettley cargyll"
;;
"storage_nodes")
echo "jast karstark lipps"
;;
# ... all inventory groups
esac
}
Installation Integration:
- Inventory parsing during CLI installation (
make install) - Automatic generation of
/usr/local/bin/goldentooth-inventory.sh - Dynamic loading of inventory groups into CLI
Distributed LLaMA Integration
Cross-Platform Compilation
Advanced cross-compilation support for ARM64 distributed computing:
Architecture:
- x86_64 Velaryon node: Cross-compilation host
- ARM64 Pi nodes: Deployment targets
- Automated binary distribution and service management
Commands:
# Model management
goldentooth dllama_download_model meta-llama/Llama-3.2-1B
# Service lifecycle
goldentooth dllama_start_workers
goldentooth dllama_stop
# Cluster status
goldentooth dllama_status
# Distributed inference
goldentooth dllama_inference "Explain quantum computing"
Technical Features:
- Automatic model download and conversion
- Distributed worker node management
- Cross-architecture binary deployment
- Performance monitoring and status reporting
Command Line Interface Enhancements
Bash Completion System
Comprehensive tab completion for all operations:
Features:
- Command completion for all CLI functions
- Host and group name completion
- Context-aware parameter suggestions
- Integration with existing shell environments
Error Handling and Output Management
Professional error management with proper stream handling:
Implementation:
- Error messages directed to stderr
- Clean stdout for programmatic consumption
- Consistent exit codes for automation integration
- Detailed error reporting with actionable suggestions
Help and Documentation
Built-in documentation system:
# List available commands
goldentooth help
# Command-specific help
goldentooth help shell
goldentooth help dllama_inference
# Show available inventory groups
goldentooth list_groups
Integration with Existing Infrastructure
Ansible Compatibility
The new CLI maintains full compatibility with existing Ansible workflows:
Hybrid Approach:
- SSH operations for simple, fast tasks
- Ansible playbooks for complex configuration management
- Seamless switching between approaches based on task requirements
Examples:
# Quick status check - SSH
goldentooth command all "uptime"
# Complex configuration - Ansible
goldentooth setup_consul
Monitoring and Observability
CLI operations integrate with existing monitoring systems:
Features:
- Command execution logging
- Performance metrics collection
- Integration with Prometheus/Grafana monitoring
- Audit trail for security compliance
User Experience Improvements
Intuitive Command Syntax
Natural, memorable command patterns:
# Intuitive file operations
goldentooth cp source destination
# Clear service management
goldentooth dllama_start_workers
# Obvious interactive access
goldentooth shell hostname
Talos
At this point, I was quite a ways into this project; about 15-18 months of off-and-on work. It was very complex, with a long list of Ansible playbooks and roles, a custom CLI, several additional repositories for GitOps, a half-implemented AI agent and a half-implemented MCP server, multiple filesystems, complex mesh networking...
The complexity was (and still is) a large part of the point; I wanted a bustling, lively cluster full of ephemeral, dispensable services, with an architecture in the fashion of one designed by multiple teams organized chaotically. A lot of chatter, a lot of noise. Much ado about nothing. That's all fine, and that was working more-or-less as intended.
But this month (September 2025) I found myself dissatisfied and yearning for the Holy Grail of infrastructure, which (currently at least) can be summarized as everything being declarative.
Back when I first tried Kubernetes, in... IDK, 2016 or 2017... I quickly became frustrated with running Kubernetes on Debian and made the leap to CoreOS, which is confusingly different from what I now understand to be CoreOS and is closer to what I believe is called Flatcar Linux. Apologies if I'm getting any of that wrong; the reasons why will likely beome clear.
I had four old Dell Optiplex PCs, which I threw 32GB RAM apiece on, installed VMWare (this was before I knew about Proxmox), and created four VMs on each PC so that I had a 2D matrix of 16 VMs. I set up another VM to host Matchbox and then wrote Ignition configurations (again, I might be wrong about the naming here) so that each VM, with its distinct MAC address, would PXE-boot CoreOS and form a Kubernetes cluster, then install some other manifests and host some services. I learned a lot, aged quickly, etc. I upgraded Kubernetes, I followed Ignition through its godawful rebranding as "CoreOS Matchbox Configurator" or something equally appalling, etc.
But this was a homelab, and as has generally been the pattern with my homelabs, I installed services like Plex and such that "mattered" and that needed to be "stable". So however much the VMs started out as "cattle," the cluster itself became a sort of "pet". And the complexity of the infrastructure and my lack of effective ops knowledge (compounded exponentially by my ginger treatment of the cluster) of course led to something that I didn't touch and ended up replacing with a normal "pet" server that was easier to reason about. The cluster languished and at some point I broke it down and sold the parts.
But that cluster of VMs remained a fond memory, especially because I could absolutely bork a node beyond all recognition and then... just...reboot. The specification of the cluster either worked or it didn't, and the cluster would either conform to its specification or it wouldn't; no confusion or misconfiguration arising from past states, no filesystem clutter, no need to consult my notes when an SD card shat blood or a new node was added.
So I definitely took note of Talos Linux when I first started hearing buzz about it a couple years back. But the time wasn't yet ripe. I wanted to play with some other systems - Slurm, Nomad, Docker Swarm, etc.
Now I've done that, and I think I'm fairly satisfied with my flirtations. I was very interested in Slurm and HPC, and proud of the cluster I'd built out, but I wasn't able to get any traction applying for the few relevant jobs I found in the area. Nomad's cool, but it seemed like any place that ran Nomad was equally fine with someone who had Kubernetes experience. I don't know if I ever saw anyone explicitly mention Docker Swarm.
So the few concerns I had about shifting to Talos and "fulltime" Kubernetes evaporated, and the hybrid approach of running bare-metal services and Kubernetes services and Nomad services was starting to be a PITA.
This chapter of the CLOG is therefore kind of a tombstone on the old structure and marks the cluster's transition to a new infrastructure based on Talos. Currently, I'm not netbooting (that'll come later), and not all of the nodes are running Talos (it's not supported on Pi 5s, and I haven't gotten around to installing it on Velaryon), but I have gotten it installed on the 12 RPi Bs, and I'm figuring out how to manage the Talos configuration in a GitOps-y way with Talhelper. My findings there are not terribly interesting, and given that I'm a rank newbie I'm concerned about spreading misinformation and antipatterns.
But I'll pick up in the next chapter with... something of interest. I hope.
Disk Cleanup
Once I had the cluster in running shape, I figured it was a good time to set up storage. I'd set up ZFS, SeaweedFS, and played with Ceph (with and without Rook), GlusterFS, and BeeGFS. I really liked SeaweedFS but thought it might be good to work with Longhorn, which seems (for better or worse) to be a good, "conventional" choice.
As mentioned previously, I have Talos installed on twelve Raspberry Pi 4B's. Eight of them (Erenford, Fenn, Gardener, Harlton, Inchfield, Jast, Karstark, and Lipps) have SSDs installed via USB <-> SATA cables. The one on Harlton isn't working; not sure if that's an issue with the SSD or the USB cable, but I haven't checked it out yet. The disks vary in size from 120GB to 1TB.
So I obligingly added some sections like this to my talconfig.yaml:
userVolumes:
- name: usb
provisioning:
diskSelector:
match: disk.transport == "usb"
minSize: 100GiB
filesystem:
type: xfs
I applied, checked the disks - no change. I checked the dmesg and Talos couldn't find > 100GiB to use. Weird. I lowered it to 1GiB, but it still didn't work. It was then I realized that Talos wouldn't just yeet an existing partition into the abyss; nice. So I used the handy talosctl wipe disk ... --drop-partition commands to wipe the disks and drop the partitions so that the userVolumes configs could work.
This worked everywhere except Inchfield, whose SSD was repurposed from a Proxmox machine with LVM logical volumes, volume groups, and physical volumes. Talos doesn't include any tools for dealing with LVM, and the wipe disk command wouldn't work with the device mapper volumes, leading to an unfortunate error:
$ talosctl -n inchfield wipe disk sda3 --drop-partition
1 error occurred:
* inchfield: rpc error: code = FailedPrecondition desc = blockdevice "sda3" is in use by blockdevice "dm-0"
The solution was to create a static pod that contained the appropriate LVM tools and use that to delete the LVM resources.
I ended up with the following:
apiVersion: v1
kind: Pod
metadata:
name: lvm-cleanup
namespace: kube-system
spec:
hostNetwork: true
hostPID: true
hostIPC: true
containers:
- name: lvm-tools
image: ubuntu:22.04
command: ["/bin/bash"]
args: ["-c", "apt-get update && apt-get install -y lvm2 gdisk util-linux && while true; do sleep 3600; done"]
securityContext:
privileged: true
runAsUser: 0
volumeMounts:
- name: dev
mountPath: /dev
- name: sys
mountPath: /sys
- name: proc
mountPath: /proc
- name: run-udev
mountPath: /run/udev
- name: run-lvm
mountPath: /run/lvm
env:
- name: LVM_SUPPRESS_FD_WARNINGS
value: "1"
volumes:
- name: dev
hostPath:
path: /dev
- name: sys
hostPath:
path: /sys
- name: proc
hostPath:
path: /proc
- name: run-udev
hostPath:
path: /run/udev
- name: run-lvm
hostPath:
path: /run/lvm
restartPolicy: Never
tolerations:
- operator: Exists
nodeSelector:
kubernetes.io/hostname: inchfield
and this script:
#!/bin/bash
set -e
echo "Current LVM state:"
echo "--- Volume Groups ---"
vgs || echo "No volume groups found"
echo
echo "--- Logical Volumes ---"
lvs || echo "No logical volumes found"
echo
echo "--- Physical Volumes ---"
pvs || echo "No physical volumes found"
echo
echo "Deactivating all volume groups..."
vgchange -an || echo "No volume groups to deactivate"
echo "Removing logical volumes..."
for lv in $(lvs --noheadings -o lv_path 2>/dev/null || true); do
echo "Removing logical volume: $lv"
lvremove -f "$lv" || echo "Failed to remove $lv"
done
echo "Removing volume groups..."
for vg in $(vgs --noheadings -o vg_name 2>/dev/null || true); do
echo "Removing volume group: $vg"
vgremove -f "$vg" || echo "Failed to remove $vg"
done
echo "Removing physical volumes..."
for pv in /dev/sda3 /dev/dm-6p3; do
if pvs "$pv" 2>/dev/null; then
echo "Removing physical volume: $pv"
pvremove -f "$pv" || echo "Failed to remove $pv"
else
echo "Physical volume $pv not found or already removed"
fi
done
echo "Wiping USB disk /dev/sda..."
if [ -b /dev/sda ]; then
sgdisk --zap-all /dev/sda
echo "USB disk /dev/sda wiped successfully"
else
echo "USB disk /dev/sda not found"
fi
echo
echo "=== Cleanup completed ==="
echo "Verify results:"
vgs || echo "No volume groups (expected)"
lvs || echo "No logical volumes (expected)"
pvs || echo "No physical volumes (expected)"
That seemed to do it; even without a reboot the xfs volume appeared.
$ talosctl get discoveredvolumes --nodes inchfield
NODE NAMESPACE TYPE ID VERSION TYPE SIZE DISCOVERED LABEL PARTITIONLABEL
inchfield runtime DiscoveredVolume loop2 1 disk 483 kB squashfs
inchfield runtime DiscoveredVolume loop3 1 disk 66 MB squashfs
inchfield runtime DiscoveredVolume mmcblk0 1 disk 128 GB gpt
inchfield runtime DiscoveredVolume mmcblk0p1 1 partition 105 MB vfat EFI EFI
inchfield runtime DiscoveredVolume mmcblk0p2 1 partition 1.0 MB BIOS
inchfield runtime DiscoveredVolume mmcblk0p3 1 partition 2.1 GB xfs BOOT BOOT
inchfield runtime DiscoveredVolume mmcblk0p4 1 partition 1.0 MB talosmeta META
inchfield runtime DiscoveredVolume mmcblk0p5 1 partition 105 MB xfs STATE STATE
inchfield runtime DiscoveredVolume mmcblk0p6 1 partition 126 GB xfs EPHEMERAL EPHEMERAL
inchfield runtime DiscoveredVolume sda 1 disk 1.0 TB gpt
inchfield runtime DiscoveredVolume sda1 1 partition 1.0 TB xfs u-usb
MetalLB (again)
I won't document this separately for obvious reasons, but I followed the excellent "Getting Started" and "Ways of Structuring Your Repositories" documentation to get FluxCD set up with the gitops repository. Now I'm back to having some semblance of GitOps, although without any applications of note (though podinfo is really cool!).
So that brings us back to setting up MetalLB so that I can easily access Kubernetes services.
MetalLB was straightforward. Its namespace needs elevated privileges, but the Helm chart and repository definition were very straightforward:
---
apiVersion: v1
kind: Namespace
metadata:
name: metallb-system
labels:
# Allow MetalLB speaker pods to use privileged capabilities
pod-security.kubernetes.io/enforce: privileged
pod-security.kubernetes.io/audit: privileged
pod-security.kubernetes.io/warn: privileged
---
apiVersion: helm.toolkit.fluxcd.io/v2beta1
kind: HelmRelease
metadata:
name: metallb
namespace: flux-system
spec:
interval: 30m
targetNamespace: metallb-system
chart:
spec:
chart: metallb
version: "0.14.5"
sourceRef:
kind: HelmRepository
name: metallb
namespace: flux-system
install:
createNamespace: false
crds: Create
remediation:
retries: 3
upgrade:
crds: CreateReplace
remediation:
retries: 3
values:
# Enable Prometheus metrics (ServiceMonitor disabled - requires Prometheus Operator)
prometheus:
serviceAccount: metallb-controller
namespace: metallb-system
serviceMonitor:
enabled: false
# Speaker configuration for L2 mode
speaker:
enabled: true
tolerateMaster: true
# Disable FRR for simple L2 mode
frr:
enabled: false
# Controller configuration
controller:
enabled: true
---
apiVersion: source.toolkit.fluxcd.io/v1beta2
kind: HelmRepository
metadata:
name: metallb
namespace: flux-system
spec:
interval: 24h
url: https://metallb.github.io/metallb
I placed that information in infrastructure/metallb, and then the following MetalLB configuration resources in apps/metallb.yaml to deploy subsequently:
---
apiVersion: metallb.io/v1beta1
kind: IPAddressPool
metadata:
name: primary
namespace: metallb-system
spec:
addresses:
- "10.4.11.0-10.4.15.254"
---
apiVersion: metallb.io/v1beta1
kind: L2Advertisement
metadata:
name: primary
namespace: metallb-system
spec:
ipAddressPools:
- primary
My podinfo configuration looked like this:
---
apiVersion: v1
kind: Namespace
metadata:
name: podinfo
---
apiVersion: source.toolkit.fluxcd.io/v1
kind: GitRepository
metadata:
name: podinfo
namespace: flux-system
spec:
interval: 1m0s
ref:
branch: master
url: https://github.com/stefanprodan/podinfo
---
apiVersion: kustomize.toolkit.fluxcd.io/v1
kind: Kustomization
metadata:
name: podinfo
namespace: flux-system
spec:
interval: 30m0s
path: ./kustomize
prune: true
retryInterval: 2m0s
sourceRef:
kind: GitRepository
name: podinfo
targetNamespace: podinfo
timeout: 3m0s
wait: true
patches:
- patch: |-
apiVersion: autoscaling/v2
kind: HorizontalPodAutoscaler
metadata:
name: podinfo
spec:
minReplicas: 3
target:
name: podinfo
kind: HorizontalPodAutoscaler
- patch: |-
- op: add
path: /metadata/annotations/metallb.io~1address-pool
value: default
- op: replace
path: /spec/type
value: LoadBalancer
- op: add
path: /spec/externalTrafficPolicy
value: Local
- op: replace
path: /spec/ports
value:
- port: 80
targetPort: 9898
protocol: TCP
name: http
- port: 9999
targetPort: 9999
protocol: TCP
name: grpc
target:
kind: Service
name: podinfo
With this deployed, I was able to curl podinfo!
$ curl http://10.4.11.0/
{
"hostname": "podinfo-6fd9b57958-7sr4v",
"version": "6.9.2",
"revision": "e86405a8674ecab990d0a389824c7ebbd82973b5",
"color": "#34577c",
"logo": "https://raw.githubusercontent.com/stefanprodan/podinfo/gh-pages/cuddle_clap.gif",
"message": "greetings from podinfo v6.9.2",
"goos": "linux",
"goarch": "arm64",
"runtime": "go1.25.1",
"num_goroutine": "8",
"num_cpu": "4"
}
External DNS (again)
Now that the IP-layer stuff is set up, I need DNS-layer stuff. I want to be able to request https://<service>.goldentooth.net/ and access that service.
Fortunately, I already had this in place once before, so I knew how to do it. Unlike MetalLB, which uses a Helm chart, I opted for a plain Kubernetes deployment for External-DNS. This gives me finer control over the configuration and keeps things simpler for this use case.
Infrastructure Setup
The External-DNS deployment lives in infrastructure/external-dns and consists of several standard Kubernetes resources:
Namespace and Service Account
---
apiVersion: v1
kind: Namespace
metadata:
name: external-dns
---
apiVersion: v1
kind: ServiceAccount
metadata:
name: external-dns
namespace: external-dns
labels:
app.kubernetes.io/name: external-dns
RBAC Configuration
External-DNS needs cluster-wide read access to watch for services, ingresses, and other resources that might need DNS records:
---
apiVersion: rbac.authorization.k8s.io/v1
kind: ClusterRole
metadata:
name: external-dns
labels:
app.kubernetes.io/name: external-dns
rules:
- apiGroups: [""]
resources: ["services"]
verbs: ["get","watch","list"]
- apiGroups: [""]
resources: ["pods"]
verbs: ["get","watch","list"]
- apiGroups: ["networking","networking.k8s.io"]
resources: ["ingresses"]
verbs: ["get","watch","list"]
- apiGroups: [""]
resources: ["nodes"]
verbs: ["get","watch","list"]
- apiGroups: [""]
resources: ["endpoints"]
verbs: ["get","watch","list"]
---
apiVersion: rbac.authorization.k8s.io/v1
kind: ClusterRoleBinding
metadata:
name: external-dns-viewer
labels:
app.kubernetes.io/name: external-dns
roleRef:
apiGroup: rbac.authorization.k8s.io
kind: ClusterRole
name: external-dns
subjects:
- kind: ServiceAccount
name: external-dns
namespace: external-dns
Deployment
The deployment itself runs a single instance of External-DNS (using Recreate strategy to avoid conflicts) and configures it to watch services and update AWS Route 53:
---
apiVersion: apps/v1
kind: Deployment
metadata:
name: external-dns
namespace: external-dns
labels:
app.kubernetes.io/name: external-dns
spec:
strategy:
type: Recreate
selector:
matchLabels:
app.kubernetes.io/name: external-dns
template:
metadata:
labels:
app.kubernetes.io/name: external-dns
spec:
serviceAccountName: external-dns
containers:
- name: external-dns
image: registry.k8s.io/external-dns/external-dns:v0.14.2
args:
- --source=service
- --domain-filter=goldentooth.net
- --provider=aws
- --aws-zone-type=public
- --registry=txt
- --txt-owner-id=external-dns-external-dns
- --log-level=debug
env:
- name: AWS_DEFAULT_REGION
value: us-east-1
- name: AWS_SHARED_CREDENTIALS_FILE
value: /.aws/credentials
volumeMounts:
- name: aws-credentials
mountPath: /.aws
readOnly: true
volumes:
- name: aws-credentials
secret:
secretName: external-dns
AWS Credentials
The deployment mounts AWS credentials from a SOPS-encrypted secret (stored in secret.yaml). This secret contains an AWS credentials file with permissions to update Route 53 records for the goldentooth.net zone.
I'm new to Sops, but really digging it so far. It's far nicer than depending (hackily) on the Ansible vault I was using before.
With this all in place, services can be annotated to create DNS records for them. I updated the podinfo Kustomization patches to add that hostname:
---
apiVersion: kustomize.toolkit.fluxcd.io/v1
kind: Kustomization
metadata:
name: podinfo
namespace: flux-system
spec:
interval: 30m0s
path: ./kustomize
prune: true
retryInterval: 2m0s
sourceRef:
kind: GitRepository
name: podinfo
targetNamespace: podinfo
timeout: 3m0s
wait: true
patches:
- patch: |-
apiVersion: autoscaling/v2
kind: HorizontalPodAutoscaler
metadata:
name: podinfo
spec:
minReplicas: 3
target:
name: podinfo
kind: HorizontalPodAutoscaler
- patch: |-
- op: add
path: /metadata/annotations/metallb.io~1address-pool
value: default
- op: add
path: /metadata/annotations/external-dns.alpha.kubernetes.io~1hostname
value: podinfo.goldentooth.net
- op: replace
path: /spec/type
value: LoadBalancer
- op: add
path: /spec/externalTrafficPolicy
value: Local
- op: replace
path: /spec/ports
value:
- port: 80
targetPort: 9898
protocol: TCP
name: http
- port: 9999
targetPort: 9999
protocol: TCP
name: grpc
target:
kind: Service
name: podinfo
and it works:
$ curl http://podinfo.goldentooth.net/
{
"hostname": "podinfo-6fd9b57958-7sr4v",
"version": "6.9.2",
"revision": "e86405a8674ecab990d0a389824c7ebbd82973b5",
"color": "#34577c",
"logo": "https://raw.githubusercontent.com/stefanprodan/podinfo/gh-pages/cuddle_clap.gif",
"message": "greetings from podinfo v6.9.2",
"goos": "linux",
"goarch": "arm64",
"runtime": "go1.25.1",
"num_goroutine": "8",
"num_cpu": "4"
}
Kube-VIP for Control Plane High Availability
With the Talos cluster up and running, I wanted to eliminate a potential single point of failure: the control plane endpoint. While I had three control plane nodes (allyrion, bettley, and cargyll), my DNS record cp.k8s.goldentooth.net was configured as a simple round-robin across all three IPs. This works, but it's not ideal—if one node goes down, clients would still try to connect to it until the DNS record updated.
The solution? A Virtual IP (VIP) that floats across the control plane nodes, managed by kube-vip.
Why Kube-VIP?
Kube-vip is beautifully simple: it uses etcd leader election to decide which control plane node "owns" the VIP at any given time. The winning node responds to requests on that IP. If that node fails:
- Graceful shutdown: The VIP migrates almost instantly
- Unexpected failure: Failover takes about a minute (by design, to avoid split-brain scenarios)
The best part? No external load balancer hardware required. The VIP is managed entirely within the cluster itself.
The Chicken-and-Egg Problem
Here's the catch: kube-vip relies on etcd for leader election, so the VIP won't come alive until the cluster is already bootstrapped. This means you can't use the VIP as your initial endpoint when setting up Talos—you need to bootstrap using the individual node IPs first.
Also, as the Talos docs warn: don't use the VIP in your talosconfig endpoint. Since the VIP depends on etcd and the Kubernetes API server being healthy, you won't be able to recover from certain failures if you're trying to manage Talos through the VIP.
Configuration
Talos has built-in support for VIPs (powered by kube-vip under the hood), making the setup quite straightforward. I just needed to add the configuration to my talconfig.yaml.
Choosing the VIP Address
My control plane nodes were using:
- allyrion:
10.4.0.10 - bettley:
10.4.0.11 - cargyll:
10.4.0.12
I picked 10.4.0.9 for the VIP—an unused IP in the same subnet, which my DHCP server wouldn't assign.
Interface Name Gotcha
The first attempt didn't work. I initially configured the VIP on eth0... forgetting that Raspberry Pis running Talos use predictable interface names, so the primary interface is actually end0. Once I fixed that, everything worked perfectly.
Here's the final configuration in talconfig.yaml:
additionalApiServerCertSans:
- 10.4.0.9 # VIP address
- 10.4.0.10
- 10.4.0.11
- 10.4.0.12
- cp.k8s.goldentooth.net
controlPlane:
patches:
- |-
machine:
network:
interfaces:
- interface: end0 # Not eth0!
dhcp: true
vip:
ip: 10.4.0.9
DNS Update
I also updated the Terraform configuration to point the DNS record to just the VIP instead of round-robin:
resource "aws_route53_record" "k8s_control_plane" {
zone_id = local.zone_id
name = "cp.k8s.goldentooth.net"
type = "A"
ttl = local.default_ttl
records = [
"10.4.0.9", # kube-vip VIP for control plane HA
]
}
Deployment
After updating the configuration:
- Applied the Terraform changes to update DNS
- Regenerated the Talos machine configs:
talhelper genconfig - Applied the new configs to each control plane:
talosctl apply-config -n 10.4.0.10 -f clusterconfig/goldentooth-allyrion.yaml talosctl apply-config -n 10.4.0.11 -f clusterconfig/goldentooth-bettley.yaml talosctl apply-config -n 10.4.0.12 -f clusterconfig/goldentooth-cargyll.yaml
Within seconds, the VIP came alive:
$ ping -c 3 10.4.0.9
PING 10.4.0.9 (10.4.0.9): 56 data bytes
64 bytes from 10.4.0.9: icmp_seq=0 ttl=63 time=3.618 ms
64 bytes from 10.4.0.9: icmp_seq=1 ttl=63 time=2.714 ms
64 bytes from 10.4.0.9: icmp_seq=2 ttl=63 time=3.117 ms
$ kubectl get nodes
NAME STATUS ROLES AGE VERSION
allyrion Ready control-plane 19d v1.34.0
bettley Ready control-plane 19d v1.34.0
cargyll Ready control-plane 19d v1.34.0
...
Checking VIP Ownership
You can see which node currently owns the VIP by checking the network addresses:
$ talosctl -n 10.4.0.10 get addresses | grep "10.4.0.9"
10.4.0.10 network AddressStatus end0/10.4.0.9/32 10.4.0.9/32 end0
In this case, allyrion (10.4.0.10) is the current owner. If it fails, one of the other control planes will take over automatically.
Velaryon Returns: GPU Support in Talos
After migrating the Goldentooth cluster to Talos Linux (see 070_talos), I had one major piece left to bring over: Velaryon, the x86 GPU node that originally joined the cluster way back in 046_new_server.
Back then, I'd added this RTX 2070 Super-equipped machine to run GPU-heavy workloads that would be impossible on the Raspberry Pis. But with the switch to Talos, I needed to figure out how to properly integrate it into the new cluster with full GPU support.
Why Talos for a GPU Node?
The old setup ran Ubuntu 24.04 with manually installed NVIDIA drivers and Kubernetes tooling. It worked, but it was a special snowflake that didn't match the rest of the cluster's configuration-as-code approach.
With Talos, I could:
- Use the same declarative configuration pattern as the Pi nodes
- Leverage Talos's system extension mechanism for NVIDIA drivers
- Get immutable infrastructure even for the GPU node
- Manage everything through the same
talconfig.yamlfile
Talos Image Factory for NVIDIA
Talos doesn't ship with NVIDIA drivers baked in (for good reason—most nodes don't need them). Instead, you use the Image Factory to build a custom Talos image with the NVIDIA system extensions included.
The process is straightforward:
- Select the Talos version (v1.11.1 in my case)
- Choose the system extensions needed:
siderolabs/nonfree-kmod-nvidia-lts- The NVIDIA kernel modulessiderolabs/nvidia-container-toolkit- Container runtime integration
- Get a custom image URL to use for installation
The Image Factory generates a unique URL that I added to Velaryon's configuration in talconfig.yaml:
- hostname: velaryon
ipAddress: 10.4.0.30
installDisk: /dev/nvme0n1
controlPlane: false
nodeLabels:
role: 'gpu'
slot: 'X'
talosImageURL: factory.talos.dev/metal-installer/af8eb82417d3deaa94d2ef19c3b590b0dac1b2549d0b9b35b3da2bc325de75f7
patches:
- |-
machine:
kernel:
modules:
- name: nvidia
- name: nvidia_uvm
- name: nvidia_drm
- name: nvidia_modeset
The kernel modules patch ensures the NVIDIA drivers load at boot. The labels (role: gpu) make it easy to target GPU workloads to this specific node.
Kubernetes RuntimeClass Configuration
Just having the NVIDIA drivers loaded isn't enough—Kubernetes needs to know how to use them. This is where RuntimeClass comes in.
A RuntimeClass tells Kubernetes to use a specific container runtime handler for pods. For NVIDIA GPUs, we need the nvidia runtime handler, which sets up the proper device access and library paths.
I created the RuntimeClass manifest in the GitOps repository:
apiVersion: node.k8s.io/v1
kind: RuntimeClass
metadata:
name: nvidia
handler: nvidia
This went into /gitops/infrastructure/nvidia/ along with a dedicated namespace for GPU workloads. The namespace uses the privileged PodSecurity policy since GPU containers need device access that violates the standard restricted policy.
Deployment
After updating the configurations:
- Generated the custom Talos image and added it to talconfig.yaml
- Installed Talos on Velaryon using the custom image
- Applied the node configuration with kernel module patches
- Committed the RuntimeClass manifests to the gitops repository
- Let Flux reconcile the infrastructure changes
Within a few minutes, Velaryon was back in the cluster:
$ kubectl get nodes velaryon
NAME STATUS ROLES AGE VERSION
velaryon Ready <none> 36s v1.34.0
Verification
To verify the GPU was accessible, I ran a quick test using NVIDIA's CUDA container:
kubectl run nvidia-test \
--namespace nvidia \
--restart=Never \
-ti --rm \
--image nvcr.io/nvidia/cuda:12.2.0-base-ubuntu22.04 \
--overrides '{"spec": {"runtimeClassName": "nvidia", "nodeSelector": {"role": "gpu"}}}' \
-- nvidia-smi
Important note: The CUDA version in the container must match what the driver supports. Velaryon's driver (version 535.247.01) supports CUDA 12.2, so I used the cuda:12.2.0-base image rather than newer versions.
The test succeeded beautifully:
Sat Nov 8 23:28:00 2025
+---------------------------------------------------------------------------------------+
| NVIDIA-SMI 535.247.01 Driver Version: 535.247.01 CUDA Version: 12.2 |
|-----------------------------------------+----------------------+----------------------+
| GPU Name Persistence-M | Bus-Id Disp.A | Volatile Uncorr. ECC |
| Fan Temp Perf Pwr:Usage/Cap | Memory-Usage | GPU-Util Compute M. |
|=========================================+======================+======================|
| 0 NVIDIA GeForce RTX 2070 ... On | 00000000:2D:00.0 Off | N/A |
| 0% 45C P8 19W / 215W | 1MiB / 8192MiB | 0% Default |
+-----------------------------------------+----------------------+----------------------+
Perfect! The RTX 2070 Super is ready for GPU workloads.
Preventing Non-GPU Workloads
Just like in the original setup (see 046_new_server), I wanted to ensure that only GPU workloads would be scheduled on Velaryon. This prevents regular pods from consuming resources on the expensive GPU node.
Talhelper makes this straightforward with the nodeTaints configuration. I simply added it to Velaryon's node config in talconfig.yaml:
- hostname: velaryon
ipAddress: 10.4.0.30
nodeLabels:
role: 'gpu'
nodeTaints:
gpu: "true:NoSchedule"
This gets translated into the appropriate Talos machine configuration, which tells the kubelet to register with this taint when the node first joins the cluster.
The NodeRestriction Catch
There's an important caveat: due to Kubernetes' NodeRestriction admission controller, worker nodes cannot modify their own taints after they've already registered with the cluster. This is a security feature that prevents nodes from promoting themselves to different roles.
For an existing node (like Velaryon after initial installation), the taint needs to be applied manually via kubectl:
kubectl taint nodes velaryon gpu=true:NoSchedule
However, the nodeTaints configuration in talconfig.yaml ensures that if Velaryon ever needs to be rebuilt or rejoins the cluster, it will automatically come back with the taint already applied—no manual intervention needed.
Verifying the Taint
$ kubectl describe node velaryon | grep Taints
Taints: gpu=true:NoSchedule
Perfect! Now only pods that explicitly tolerate the GPU taint can be scheduled on Velaryon.
Using the GPU in Pods
To schedule a pod on Velaryon with GPU access, the pod spec needs two things:
- RuntimeClass: Use the
nvidiaruntime - Toleration: Tolerate the
gputaint - Node Selector: Target the GPU node
Here's a complete example:
apiVersion: v1
kind: Pod
metadata:
name: gpu-workload
namespace: nvidia
spec:
runtimeClassName: nvidia
nodeSelector:
role: gpu
tolerations:
- key: gpu
operator: Equal
value: "true"
effect: NoSchedule
containers:
- name: cuda-app
image: nvcr.io/nvidia/cuda:12.2.0-base-ubuntu22.04
command: ["nvidia-smi"]
The combination of the taint and node selector ensures GPU workloads run on Velaryon while keeping non-GPU workloads away.
Cilium CNI: eBPF-Based Networking
After migrating to Talos Linux (see 070_talos), the cluster was running with Flannel as the Container Network Interface (CNI) and kube-proxy for service load balancing. While this worked, it wasn't taking advantage of modern eBPF capabilities or the full potential of Talos's networking features.
Enter Cilium: an eBPF-based CNI that replaces both Flannel and kube-proxy with more efficient, observable, and feature-rich networking.
Why Cilium?
Cilium offers several advantages over traditional CNIs:
- eBPF-based data plane: More efficient than iptables-based solutions
- KubeProxy replacement: Talos integrates with Cilium's kube-proxy replacement via KubePrism
- Hubble observability: Deep network flow visibility without external tooling
- L7-aware policies: HTTP/gRPC-level network policies and load balancing
- Bandwidth management: Built-in traffic shaping with BBR congestion control
- Host firewall: eBPF-based firewall on each node
- Encryption ready: Optional WireGuard transparent encryption
For a learning cluster, Cilium provides a wealth of features to explore and experiment with.
Talos-Specific Configuration
Talos requires specific CNI configuration that differs from standard Kubernetes:
1. Disable Built-in CNI
In talconfig.yaml, the CNI must be explicitly disabled:
patches:
- |-
cluster:
network:
cni:
name: none
proxy:
disabled: true
This tells Talos not to deploy its own CNI or kube-proxy, leaving that responsibility to Cilium.
2. Security Context Adjustments
Talos doesn't allow pods to load kernel modules, so the SYS_MODULE capability must be removed from Cilium's security context. The eBPF programs don't require this capability anyway.
3. Cgroup Configuration
Talos uses cgroupv2 and mounts it at /sys/fs/cgroup. Cilium needs to be told to use these existing mounts rather than trying to mount its own:
cgroup:
autoMount:
enabled: false
hostRoot: /sys/fs/cgroup
4. KubePrism Integration
Talos replaces kube-proxy with KubePrism, which runs on localhost:7445. Cilium's kube-proxy replacement needs to know about this:
k8sServiceHost: localhost
k8sServicePort: 7445
kubeProxyReplacement: true
GitOps Deployment with Flux
Rather than using the Cilium CLI installer, I deployed Cilium via Flux HelmRelease to maintain the GitOps approach. This ensures the CNI configuration is version-controlled and reproducible.
The structure mirrors other infrastructure components:
gitops/infrastructure/cilium/
├── kustomization.yaml
├── namespace.yaml
├── release.yaml
└── repository.yaml
The HelmRelease (release.yaml) contains all the Cilium configuration, including:
- Talos-specific settings (covered above)
- IPAM mode set to
kubernetes(required for Talos) - Hubble observability enabled
- Bandwidth manager with BBR
- L7 proxy for HTTP/gRPC features
- Host firewall enabled
- Network tunnel mode (VXLAN)
Migration Process
The migration from Flannel to Cilium was surprisingly straightforward:
- Created GitOps manifests: Added Cilium HelmRelease to the infrastructure kustomization
- Pushed to Git: Committed the changes to trigger Flux reconciliation
- Regenerated Talos configs: Ran
talhelper genconfigto generate new machine configurations with CNI disabled - Applied configuration: Used
talhelper gencommand apply | bashto apply to all nodes - Waited for Cilium: Nodes rebooted and waited (hung on phase 18/19 as expected) until Cilium pods started
- Removed old CNI: Deleted the Flannel and kube-proxy DaemonSets:
kubectl delete daemonset -n kube-system kube-flannel kubectl delete daemonset -n kube-system kube-proxy
The cluster had a brief period where both CNIs were running simultaneously, which caused some endpoint conflicts. Once Flannel was removed, Cilium took over completely and networking stabilized.
Verification
After the migration, verification confirmed everything was working:
$ kubectl exec -n kube-system ds/cilium -- cilium status --brief
OK
All 17 nodes came back as Ready, with Cilium agent and Envoy pods running on each:
- 17 Cilium agents (main CNI component)
- 17 Cilium Envoy proxies (L7 proxy)
- 1 Cilium Operator (cluster-wide coordination)
- 1 Hubble Relay (flow aggregation)
- 1 Hubble UI (web interface for flow visualization)
Testing connectivity with a simple pod confirmed networking was functional:
$ kubectl run test-pod --image=busybox --rm -it --restart=Never -- wget -O- -T 5 https://google.com
Connecting to google.com (192.178.154.139:443)
writing to stdout
<!doctype html><html itemscope="" itemtype="http://schema.org/WebPage" lang="en">...
DNS resolution and external connectivity both worked perfectly.
Features Enabled
The deployment enables several advanced features out of the box:
Hubble Observability
Hubble provides deep visibility into network flows without requiring external tools or sidecar proxies. It captures:
- DNS queries and responses
- TCP connection establishment and teardown
- HTTP request/response metadata
- Packet drops with detailed reasons
- ICMP messages
Initially configured as ClusterIP, the Hubble UI was later exposed via LoadBalancer (see "Exposing Hubble UI" section below).
Bandwidth Manager
Cilium's bandwidth manager uses eBPF to implement efficient traffic shaping with BBR congestion control. This provides better network utilization than traditional tc-based solutions.
Host Firewall
The eBPF-based host firewall runs on each node, providing network filtering without the overhead of iptables.
L7 Proxy
Cilium Envoy pods provide L7 load balancing and policy enforcement for HTTP and gRPC traffic. This enables features like HTTP header-based routing and gRPC method-level policies.
Additional Features Available
BGP Control Plane
For advanced routing scenarios, Cilium's BGP control plane can peer with network equipment:
bgpControlPlane:
enabled: true
This would allow the cluster to advertise Pod CIDRs directly to the network infrastructure.
Challenges Encountered
Dual CNI Period
Having both Flannel and Cilium running simultaneously caused endpoint conflicts. The Kubernetes endpoint controller struggled to update endpoints, resulting in timeout errors:
Failed to update endpoint kube-system/hubble-peer: etcdserver: request timed out
Once Flannel was removed, these issues resolved immediately.
Stale CNI Configuration
Some pods that were created during the Flannel period tried to use the old CNI configuration. The Hubble UI pod, for example, failed with:
plugin type="flannel" failed (add): loadFlannelSubnetEnv failed:
open /run/flannel/subnet.env: no such file or directory
Deleting and recreating these pods resolved the issue.
Flannel Interface Remnants
The flannel.1 interface remains on nodes even after removing Flannel. Cilium notices it and includes it in the host firewall configuration. This is harmless but obviously I'm gonna clean that up.
PodSecurity Policy Blocks
The cilium connectivity test command initially failed because Talos enforces a "baseline" PodSecurity policy by default. The test pods require the NET_RAW capability, which is blocked by this policy:
Error creating: pods "client-64d966fcbd-sd4lw" is forbidden:
violates PodSecurity "baseline:latest": non-default capabilities
(container "client" must not include "NET_RAW" in securityContext.capabilities.add)
The solution is to use the --namespace-labels flag to set the test namespace to "privileged" mode:
cilium connectivity test \
--namespace-labels pod-security.kubernetes.io/enforce=privileged,pod-security.kubernetes.io/audit=privileged,pod-security.kubernetes.io/warn=privileged
Exposing Hubble UI
Rather than requiring port-forwarding to access Hubble UI, the service was configured as a LoadBalancer with External-DNS annotation:
hubble:
ui:
enabled: true
service:
type: LoadBalancer
annotations:
external-dns.alpha.kubernetes.io/hostname: hubble.goldentooth.net
After applying this change via Flux:
- MetalLB assigned an IP from the pool (10.4.11.2)
- External-DNS created a DNS record in Route53
- Hubble UI became accessible at
http://hubble.goldentooth.net
This follows the same pattern as other services in the cluster, maintaining consistency and eliminating manual port-forwarding steps.
Enabling WireGuard Encryption
After confirming Cilium was working correctly, WireGuard encryption was enabled to provide transparent pod-to-pod encryption across nodes:
encryption:
enabled: true
type: wireguard
nodeEncryption: false
The nodeEncryption: false setting means only pod traffic is encrypted, not host-level communication. This is typically the desired behavior for most clusters.
Rollout Process
Enabling encryption triggered a rolling update of all Cilium agents:
$ kubectl rollout status daemonset/cilium -n kube-system
Waiting for daemon set "cilium" rollout to finish: 11 out of 17 new pods have been updated...
Waiting for daemon set "cilium" rollout to finish: 12 out of 17 new pods have been updated...
...
daemon set "cilium" successfully rolled out
The rollout took several minutes as each node's Cilium agent was updated with the new encryption configuration.
Verification
After the rollout completed, verification confirmed WireGuard was active:
$ kubectl exec -n kube-system ds/cilium -- cilium status | grep -i encrypt
Encryption: Wireguard [NodeEncryption: Disabled, cilium_wg0
(Pubkey: DKyUQtNylJpQv6xf9cnbuvcCgCeahumOcOE5cfxt/kk=, Port: 51871, Peers: 16)]
This output shows:
- WireGuard is active on interface
cilium_wg0 - Each node has 16 peers (the other nodes in the cluster)
- The WireGuard tunnel is listening on port 51871
- A unique public key was generated for this node
All pod-to-pod traffic across nodes is now transparently encrypted with WireGuard's ChaCha20-Poly1305 cipher, with zero application changes required.
Step-CA (Again)
After implementing Cilium for networking (see 076_cilium), the cluster needed a proper internal Public Key Infrastructure (PKI) for managing TLS certificates. We'd set this up before, so it was time to get Step-CA working with the Talos cluster.
Why Internal PKI?
An internal PKI provides several advantages for cluster services:
- Automated certificate issuance: Services can request certificates declaratively
- Short-lived certificates: 24-hour lifetimes reduce blast radius of compromised keys
- Centralized trust: Single root CA for all internal services
- GitOps-managed: Entire PKI configuration version-controlled and automated
- No external dependencies: Full control over certificate issuance and revocation
- Learning opportunity: Deep dive into PKI, x.509, and certificate automation
For a learning cluster, building a proper PKI demonstrates production-grade security practices that are often hidden behind managed services in cloud environments.
Architecture Overview
The PKI infrastructure consists of three layers, deployed via Flux with dependency ordering:
Layer 00: Foundations
├── cert-manager (certificate lifecycle management)
├── cert-manager-approver-policy (approval automation)
├── step-ca (Certificate Authority)
└── step-issuer (cert-manager ↔ step-ca bridge)
Layer 01: Issuers
├── StepClusterIssuer (cluster-wide issuer)
├── CertificateRequestPolicy (approval rules)
└── RBAC bindings (allow cert-manager to use policy)
Layer 02: Tests
├── Test certificate (24h lifetime)
└── Canary certificate (2h lifetime, renews hourly)
Each layer depends on the previous layer being healthy before deploying, ensuring correct startup ordering.
Component Details
step-ca: The Certificate Authority
step-ca is Smallstep's open-source CA server. It's designed for automated certificate issuance with:
- JWK provisioners: Authenticate with JSON Web Keys
- Short default lifetimes: Encourages certificate rotation
- REST API: Easy integration with automation tools
- Flexible configuration: Claims, provisioners, and extensions
The deployment uses bootstrap mode to auto-generate a root CA and JWK provisioner on first run:
ca:
name: Goldentooth CA
address: :9000
dns: step-ca.goldentooth.net,step-ca.step-ca.svc.cluster.local
url: https://step-ca.goldentooth.net
db:
enabled: true
persistent: false # emptyDir for homelab
claims:
defaultTLSCertDuration: 24h
maxTLSCertDuration: 24h
minTLSCertDuration: 5m
bootstrap:
enabled: true
configmaps: true # Export CA cert to ConfigMap
secrets: true # Store CA keys in Secrets
The persistent: false setting uses emptyDir storage. While this means the certificate issuance database is lost on pod restart, the root CA itself is preserved in ConfigMaps and Secrets. Certificates simply need to be re-issued after a restart, which happens automatically thanks to cert-manager.
cert-manager: Certificate Lifecycle Management
cert-manager is the de facto standard for Kubernetes certificate automation. It:
- Watches
Certificateresources and creates certificate requests - Coordinates with external CAs to sign requests
- Stores issued certificates in Kubernetes Secrets
- Automatically renews certificates before expiration
The deployment uses the official Helm chart with minimal customization:
values:
crds:
enabled: true
resources:
requests:
cpu: 10m
memory: 64Mi
step-issuer: The Bridge
step-issuer is a custom cert-manager Issuer that speaks step-ca's API. It translates cert-manager's CertificateRequest resources into step-ca API calls using JWK authentication.
The critical configuration challenge was finding the correct chart version. The step-issuer project underwent a major version jump from 0.8.x directly to 1.8.x, skipping the 0.10.x range entirely. Using version: "1.9.x" resolved the "chart not found" errors.
cert-manager-approver-policy: Automated Approval
A subtle but critical component! cert-manager's built-in approver only handles internal issuers (CA, SelfSigned, Venafi). External issuers like step-issuer require explicit approval via policies.
Without approver-policy, certificate requests would sit in "pending approval" state forever:
NAME APPROVED DENIED READY ISSUER
test-certificate-1 step-ca
^-- stuck here
The approver-policy controller watches for CertificateRequestPolicy resources that define approval rules. But here's the catch: policies must be bound via RBAC to the requester!
GitOps Structure
The deployment follows a layered GitOps approach with explicit dependencies:
gitops/infrastructure/pki/
├── kustomization.yaml (orchestrates all layers)
├── 00-foundations/
│ ├── flux-kustomization.yaml
│ ├── cert-manager/
│ │ ├── kustomization.yaml
│ │ ├── namespace.yaml
│ │ ├── release.yaml
│ │ └── repository.yaml
│ ├── cert-manager-approver-policy/
│ │ ├── kustomization.yaml
│ │ └── release.yaml
│ ├── step-ca/
│ │ ├── kustomization.yaml
│ │ ├── namespace.yaml
│ │ ├── release.yaml
│ │ ├── repository.yaml
│ │ └── service-alias.yaml
│ └── step-issuer/
│ ├── kustomization.yaml
│ └── release.yaml
├── 01-issuers/
│ ├── flux-kustomization.yaml (depends on 00-foundations)
│ ├── kustomization.yaml
│ ├── step-cluster-issuer.yaml
│ ├── certificate-request-policy.yaml
│ └── policy-rbac.yaml
└── 02-tests/
├── flux-kustomization.yaml (depends on 01-issuers)
├── kustomization.yaml
├── test-certificate.yaml
└── canary-certificate.yaml
Each Flux Kustomization waits for the previous layer's health checks before proceeding:
# 01-issuers/flux-kustomization.yaml
spec:
dependsOn:
- name: pki-foundations
healthChecks:
- apiVersion: certmanager.step.sm/v1beta1
kind: StepClusterIssuer
name: step-ca
namespace: ""
Deployment Process
The deployment was a journey through several layers of abstraction and error messages:
1. Initial Bootstrap Issues
Early attempts used inject.enabled: true to provide configuration to step-ca. This conflicted with bootstrap.enabled: true, causing the CA to fail initialization. The chart expects either bootstrap (auto-generate config) OR inject (provide pre-existing config), not both.
Solution: Use bootstrap mode exclusively, let step-ca auto-generate its CA and provisioner.
2. Persistence Problems
The default persistence.enabled: true setting tried to create a PersistentVolumeClaim. However, the correct field for disabling persistence in the step-certificates chart is ca.db.persistent: false, not the top-level persistence field.
Solution: Explicitly set ca.db.persistent: false to use emptyDir storage.
3. Service DNS Naming Mismatch
The Helm chart created a service named step-ca-step-ca-step-certificates (following Helm's naming pattern), but the bootstrap process generated a CA certificate with SANs for step-ca.step-ca.svc.cluster.local. The StepClusterIssuer tried to connect to the short name, but TLS verification failed:
certificate is valid for step-ca.goldentooth.net, step-ca.step-ca.svc.cluster.local,
not step-ca-step-ca-step-certificates.step-ca.svc.cluster.local
Solution: Create a Service alias with the short name that matches the certificate SAN:
apiVersion: v1
kind: Service
metadata:
name: step-ca
namespace: step-ca
spec:
type: ClusterIP
ports:
- name: https
port: 443
targetPort: 9000
selector:
app.kubernetes.io/name: step-certificates
app.kubernetes.io/instance: step-ca-step-ca
This provides step-ca.step-ca.svc.cluster.local DNS resolution while preserving the Helm-generated service name.
4. Certificate Request Approval Deadlock
After resolving connectivity, certificate requests were created but never approved:
$ kubectl get certificaterequest -n cert-test
NAME APPROVED DENIED READY ISSUER
test-certificate-1 step-ca
The cert-manager logs showed a helpful message:
Request is not applicable for any policy so ignoring
This revealed two missing pieces:
Missing Component 1: cert-manager-approver-policy
The approver-policy controller wasn't installed. cert-manager's built-in approver only handles internal issuers, so external issuers like step-issuer need the policy controller.
Missing Component 2: RBAC Bindings
Even after creating a CertificateRequestPolicy, requests were still ignored! The policy controller requires RBAC bindings to allow requesters to "use" policies:
apiVersion: rbac.authorization.k8s.io/v1
kind: ClusterRole
metadata:
name: approve-step-ca-requests:use
rules:
- apiGroups: [policy.cert-manager.io]
resources: [certificaterequestpolicies]
verbs: [use]
resourceNames: [approve-step-ca-requests]
---
apiVersion: rbac.authorization.k8s.io/v1
kind: ClusterRoleBinding
metadata:
name: cert-manager:approve-step-ca-requests
roleRef:
apiGroup: rbac.authorization.k8s.io
kind: ClusterRole
name: approve-step-ca-requests:use
subjects:
- kind: ServiceAccount
name: cert-manager-cert-manager
namespace: cert-manager
This pattern follows Kubernetes' principle of explicit authorization: just because a policy exists doesn't mean anyone can use it.
5. Policy Rejection: Missing Organization Field
Once RBAC was in place, certificate requests were finally being evaluated—but denied!
No policy approved this request: [approve-step-ca-requests:
spec.allowed.subject.organizations: Invalid value: []string{"Goldentooth"}: no allowed values]
The test certificate included subject.organizations: ["Goldentooth"], but the policy's allowed section didn't include an organizations field. In cert-manager-approver-policy, the allowed section works as a whitelist: any field in the certificate request must be explicitly allowed, or the request is denied.
Solution: Add organization to the allowed fields:
allowed:
subject:
organizations:
values:
- "Goldentooth"
This security-by-default behavior prevents privilege escalation via unexpected certificate fields.
Security Hardening
After basic functionality was working, several security improvements were implemented:
1. Tighten Approval Policy
The initial policy used wildcards for everything:
# Before: Overly permissive
allowed:
commonName: { value: "*" }
dnsNames: { values: ["*.goldentooth.local", "*.goldentooth.net", "*.svc.cluster.local"] }
ipAddresses: { values: ["*"] }
organizations: { values: ["*"] }
This was refined to actual cluster requirements:
# After: Restricted to actual needs
allowed:
commonName: { value: "*" } # OK for internal CA
dnsNames:
values:
- "*.goldentooth.local"
- "*.goldentooth.net"
- "*.svc.cluster.local"
- "*.*.svc.cluster.local" # Namespaced services
ipAddresses:
values:
- "10.*" # Cluster IP range only
subject:
organizations:
values:
- "Goldentooth" # Specific org only
IP addresses are limited to the internal 10.* range (cluster IPs), excluding the home network 192.168.* range which should never receive cluster-issued certificates.
2. Enforce Certificate Duration Limits
Two layers of duration enforcement provide defense-in-depth:
Policy Layer (primary enforcement):
constraints:
maxDuration: 24h
minDuration: 5m
The policy rejects any certificate request outside these bounds before it reaches the CA.
CA Layer (backup enforcement):
ca:
claims:
defaultTLSCertDuration: 24h
maxTLSCertDuration: 24h
minTLSCertDuration: 5m
While the CA claims are configured in the HelmRelease, they may not apply in bootstrap mode (the ConfigMap shows claims: null). However, step-ca's default claims already enforce 24h maximum, providing a reasonable baseline even without explicit configuration.
The policy layer is the primary defense and is cleanly expressed in GitOps. This follows the principle of enforcing security at the earliest possible point in the request flow.
Continuous Validation with Canary Certificates
To ensure certificate renewal continues working, a canary certificate with aggressive rotation was added:
apiVersion: cert-manager.io/v1
kind: Certificate
metadata:
name: canary-certificate
namespace: cert-test
spec:
secretName: canary-tls-secret
duration: 2h
renewBefore: 1h # Renews when 50% lifetime remains
commonName: canary.goldentooth.local
dnsNames:
- canary.goldentooth.local
issuerRef:
name: step-ca
kind: StepClusterIssuer
group: certmanager.step.sm
This certificate:
- Has a 2-hour lifetime
- Renews when 1 hour remains (50% threshold)
- Therefore renews approximately every hour
If any component of the PKI stack breaks (step-ca unavailable, policy misconfigured, StepClusterIssuer invalid), the canary will fail to renew within 1-2 hours instead of 20+ hours for a normal 24h certificate. This provides early warning of PKI issues.
The canary pattern is purely declarative—just another Certificate resource—requiring no additional infrastructure. It continuously validates the entire certificate request → approval → issuance → renewal path.
I might reduce this to e.g. 15 minutes or something, but this should be fine.
Verification
After all components were deployed, verification confirmed the PKI was fully operational:
$ kubectl get certificate -n cert-test
NAME READY SECRET AGE
canary-certificate True canary-tls-secret 1h
test-certificate True test-tls-secret 5h
Both certificates show READY, meaning they were successfully issued, approved, and stored in Secrets.
Checking the certificate requests:
$ kubectl get certificaterequest -n cert-test
NAME APPROVED DENIED READY ISSUER
canary-certificate-1 True True step-ca
test-certificate-1 True True step-ca
Both show APPROVED=True and READY=True, confirming the approval policy and RBAC bindings are working correctly.
Inspecting the canary certificate shows the short lifetime and renewal timing:
$ kubectl get secret -n cert-test canary-tls-secret -o jsonpath='{.data.tls\.crt}' \
| base64 -d | openssl x509 -noout -text | grep -A 2 "Validity"
Validity
Not Before: Nov 16 03:25:27 2025 GMT
Not After : Nov 16 05:26:27 2025 GMT
The 2-hour validity period is correct (03:25 → 05:26).
Checking the renewal time:
$ kubectl describe certificate -n cert-test canary-certificate | grep "Renewal Time"
Renewal Time: 2025-11-16T04:26:27Z
The certificate will renew at 04:26 (1 hour after issuance), confirming the renewBefore: 1h configuration.
Defense-in-Depth: Multiple Enforcement Layers
The final architecture implements three overlapping security controls:
-
CertificateRequestPolicy constraints (Layer 01)
- Enforces max duration: 24h
- Enforces min duration: 5m
- Restricts DNS names to known patterns
- Restricts IPs to internal cluster range
- Restricts organization field
- Primary enforcement point (cleanest GitOps expression)
-
step-ca claims (Layer 00)
- Configured in HelmRelease values
- May not apply due to bootstrap mode
- Provides backup enforcement if requests bypass policy
- step-ca defaults are reasonable (24h max)
-
Certificate resource defaults (Layer 02)
- Applications request sensible values (24h)
- Well-behaved clients don't try to abuse the system
This layered approach means even if one layer is misconfigured, the others provide protection. The policy layer is the most important because:
- It's declarative and version-controlled in Git
- It catches bad requests before they reach the CA
- It's easy to audit and modify via pull requests
- It follows the Kubernetes admission controller pattern
Similar to how Pod Security admission controls prevent privileged pods, CertificateRequestPolicy prevents unauthorized certificates.
Lessons Learned
1. Bootstrap vs Inject Modes Are Mutually Exclusive
step-ca's Helm chart supports either auto-generating configuration (bootstrap) or injecting pre-existing configuration (inject), but not both. For a new deployment, bootstrap mode is simpler and more GitOps-friendly.
2. External Issuers Need Explicit Approval Infrastructure
cert-manager's built-in approver only handles cert-manager's own issuers. External issuers require:
- The approver-policy controller installed
- A CertificateRequestPolicy defining rules
- RBAC bindings allowing requesters to use the policy
This three-part requirement isn't obvious from documentation and was discovered through error messages.
3. Approval Policies Are Whitelists, Not Filters
Any field in a certificate request must be explicitly allowed in the policy's allowed section. Missing fields result in denial, not omission. This security-by-default behavior prevents privilege escalation but requires careful policy authoring.
4. Service Naming Matters for TLS Verification
When the Helm chart's service name doesn't match the CA's certificate SANs, TLS verification fails. Creating a service alias that matches the expected DNS name solves this without modifying chart defaults.
5. Canary Certificates Provide Continuous Validation
Rather than waiting for the first production certificate renewal to discover issues, a short-lived canary certificate provides hourly validation of the entire PKI stack. This is a pure GitOps pattern requiring no additional tooling.
6. Policy Enforcement > CA Enforcement for GitOps
While configuring step-ca's claims seems like the "right" place for enforcement, policies provide better GitOps expressiveness, earlier validation, and easier auditability. The CA provides defense-in-depth, but the policy is the primary control.
KubeVirt: Virtual Machines in Kubernetes
I've been wanting to run VMs on the cluster for a while now. Not because I have any immediate need for them, but because KubeVirt is one of those technologies that's just... cool? The idea of managing virtual machines as Kubernetes resources, using the same GitOps workflows, the same kubectl commands – it's elegant in a way that appeals to the part of my brain that got me into infrastructure in the first place.
Plus, having the ability to spin up VMs on demand could be useful for testing OS-level stuff, running workloads that don't containerize well, or just experimenting with things that need a full VM environment.
The Problem: Stuck Kustomizations
I added KubeVirt to my Flux setup and pushed the changes. After a few minutes, I checked on things:
$ flux get kustomizations -w
NAME REVISION SUSPENDED READY MESSAGE
apps main@sha1:e98a5de0 False False dependency 'flux-system/infrastructure' is not ready
flux-system main@sha1:e98a5de0 False True Applied revision: main@sha1:e98a5de0
httpbin main@sha1:e98a5de0 False True Applied revision: main@sha1:e98a5de0
infrastructure main@sha1:e98a5de0 False Unknown Reconciliation in progress
kubevirt-cdi main@sha1:e98a5de0 False Unknown Reconciliation in progress
kubevirt-instance main@sha1:e98a5de0 False False dependency 'flux-system/kubevirt-cdi' is not ready
kubevirt-operator main@sha1:e98a5de0 False True Applied revision: main@sha1:e98a5de0
Not great. kubevirt-cdi was stuck in "Reconciliation in progress" with an "Unknown" ready status. This caused a cascade of failures – kubevirt-instance couldn't start because it depends on kubevirt-cdi, and apps couldn't start because it depends on infrastructure.
The Debugging Journey
Time to dig in. First, I checked Flux events to see what was actually happening:
$ flux events
...
3m21s Warning HealthCheckFailed Kustomization/kubevirt-cdi health check failed after 9m30s: timeout waiting for: [Deployment/cdi/cdi-operator status: 'InProgress']
Ah! So the cdi-operator Deployment in the cdi namespace was stuck. The health check was timing out because the deployment never became healthy.
Let's look at the deployment itself:
$ kubectl -n cdi get deployments
NAME READY UP-TO-DATE AVAILABLE AGE
cdi-operator 0/1 1 0 28m
0/1 ready. Not good. What about the pods?
$ kubectl -n cdi get all
NAME READY STATUS RESTARTS AGE
pod/cdi-operator-797944b474-ql7fz 0/1 CrashLoopBackOff 10 (2m22s ago) 29m
CrashLoopBackOff! Now we're getting somewhere. Let me describe the pod to see what's going on:
$ kubectl -n cdi describe pod cdi-operator-797944b474-ql7fz
...
State: Waiting
Reason: CrashLoopBackOff
Last State: Terminated
Reason: Error
Exit Code: 255
...
Events:
Warning BackOff 4m4s (x115 over 29m) kubelet Back-off restarting failed container
Exit code 255, constantly restarting. The pod events show it's been failing for 29 minutes. Let's check the logs:
$ kubectl -n cdi logs cdi-operator-797944b474-ql7fz
exec /usr/bin/cdi-operator: exec format error
There it is. "exec format error" – that's the kernel telling me it can't execute the binary because it was compiled for a different CPU architecture.
The pod was scheduled on jast, one of my Raspberry Pi 4B nodes running ARM64. The container image must be built for AMD64/x86_64, not ARM64.
Understanding the Architecture Mismatch
Of course, container images are architecture-specific unless they're built as multi-arch images with manifest lists. When you pull an image, the container runtime tries to find a manifest for your architecture. If it doesn't exist, you might get the wrong architecture anyway, and then... exec format error.
KubeVirt CDI does publish ARM64 images, but they're tagged differently. Instead of using manifest lists where the same tag works for all architectures, they use separate tags like v1.63.1-arm64. Not a big deal.
The Solution: Two Problems, Two Fixes
I had attempted to override the images:
images:
- name: quay.io/kubevirt/cdi-operator
newTag: v1.63.1-arm64
- name: quay.io/kubevirt/cdi-controller
newTag: v1.63.1-arm64
# ... etc
But that didn't work. Turns out I missed something - my upstream kustomization at gitops/infrastructure/kubevirt/upstream-cdi/kustomization.yaml was still pulling the v1.61.1 manifest:
resources:
- https://github.com/kubevirt/containerized-data-importer/releases/download/v1.61.1/cdi-operator.yaml
Even with image overrides, that manifest had environment variables hardcoded to v1.61.1 images, and v1.61.1-arm64 tags don't exist in the registry.
Committed, pushed, and forced a reconciliation:
flux reconcile kustomization kubevirt-cdi --with-source
Does It Work?
A minute later:
$ flux get kustomizations
NAME REVISION SUSPENDED READY MESSAGE
apps main@sha1:773fbac5 False True Applied revision: main@sha1:773fbac5
flux-system main@sha1:773fbac5 False True Applied revision: main@sha1:773fbac5
httpbin main@sha1:773fbac5 False True Applied revision: main@sha1:773fbac5
infrastructure main@sha1:773fbac5 False True Applied revision: main@sha1:773fbac5
kubevirt-cdi main@sha1:773fbac5 False True Applied revision: main@sha1:773fbac5
kubevirt-instance main@sha1:773fbac5 False True Applied revision: main@sha1:773fbac5
kubevirt-operator main@sha1:773fbac5 False True Applied revision: main@sha1:773fbac5
All green! Everything reconciled successfully. The cascade of dependencies resolved – kubevirt-cdi became ready, which unblocked kubevirt-instance, which unblocked infrastructure, which unblocked apps.
SeaweedFS: Distributed Object Storage (Take Two)
I needed distributed object storage for the cluster. Harbor needs an S3-compatible backend, and I'd rather not rely on external cloud storage for a local cluster. SeaweedFS is perfect for this – it's lightweight, designed for ARM, and provides S3-compatible APIs out of the box.
I've deployed SeaweedFS before (chapter 63), but that was ages ago, before the Talos migration. Time to do it properly with the operator pattern and USB SSD storage.
The Architecture
SeaweedFS has three main components:
- Masters (3 replicas): Handle metadata and coordination using Raft consensus
- Volume Servers (6 replicas): Store the actual data, each on a dedicated USB SSD
- Filer (1 replica): Provides the S3-compatible API gateway
The plan: deploy everything via the SeaweedFS Operator, using local-path-usb-provisioner to provision storage on USB SSDs attached to 6 specific nodes.
The Deployment
I reorganized the SeaweedFS directory structure into operator and cluster subdirectories, then deployed:
# Master configuration (Raft HA)
master:
replicas: 3
config: |
raftHashicorp = true
defaultReplication = "001" # 2 total copies
# Volume servers on USB SSDs
volume:
replicas: 6
nodeSelector:
storage.seaweedfs/volume: "true"
requests:
storage: 100Gi
storageClassName: local-path-usb
# Filer with S3 API
filer:
replicas: 1
s3:
enabled: true
Flux picked it up, the operator deployed, masters came up, filer started... and then 4 of 6 volume servers were stuck Pending.
The Problem: Inchfield's Corrupt Partition Table
Checking the pending volumes:
$ kubectl get pods -n seaweedfs | grep volume
goldentooth-storage-volume-0 0/1 Pending 0 2m
goldentooth-storage-volume-1 1/1 Running 0 2m
goldentooth-storage-volume-2 1/1 Running 0 2m
goldentooth-storage-volume-3 1/1 Running 0 2m
goldentooth-storage-volume-4 0/1 Pending 0 2m
goldentooth-storage-volume-5 1/1 Running 0 2m
Both pending volumes were scheduled to inchfield. The PVCs were bound, but the helper pods that format the volumes were failing:
$ kubectl logs helper-pod-create-pvc-... -n local-path-usb-provisioner
mkdir: can't create directory '/var/mnt/usb/...': Read-only file system
Read-only filesystem? That's weird. The Talos volume manager should have mounted /var/mnt/usb from the USB disk. Let me check:
$ talosctl -n inchfield get volumestatuses
NAMESPACE TYPE ID VERSION PHASE LOCATION
runtime VolumeStatus u-usb 3 failed /dev/sda1
$ talosctl -n inchfield get volumestatuses u-usb -o yaml
spec:
phase: failed
error: "error probing disk: open /dev/sda1: no such file or directory"
The volume manager sees the partition in its discovery scan, but /dev/sda1 doesn't exist as a device node. That's a partition table problem.
Looking at the kernel's view:
$ talosctl -n inchfield read /proc/partitions | grep sda
8 0 976762584 sda
No sda1 partition! Compare with a working node:
$ talosctl -n gardener read /proc/partitions | grep sda
8 0 117220824 sda
8 1 117219328 sda1
The kernel can't see any partitions on inchfield's disk. The GPT partition table is corrupt or missing.
The Fix: Nuke It From Orbit
Time to rebuild the disk. I created a privileged pod on inchfield to partition and format the disk:
apiVersion: v1
kind: Pod
metadata:
name: disk-formatter-inchfield
namespace: local-path-usb-provisioner
spec:
nodeSelector:
kubernetes.io/hostname: inchfield
restartPolicy: Never
hostNetwork: true
hostPID: true
securityContext:
privileged: true
containers:
- name: formatter
image: ubuntu:22.04
command: ["/bin/bash", "-c"]
args: ["apt-get update && apt-get install -y gdisk xfsprogs && sleep 3600"]
volumeMounts:
- name: dev
mountPath: /dev
volumes:
- name: dev
hostPath:
path: /dev
But when I tried to format, Talos Volume Manager had the device locked. Even after wiping the partition table, the kernel kept using the GPT backup table at the end of the disk.
Attempt 1: Wipe just the beginning
$ kubectl exec disk-formatter-inchfield -- dd if=/dev/zero of=/dev/sda bs=1M count=100
Nope. Partition still there (restored from backup GPT).
Attempt 2: Properly zap both GPT tables
$ kubectl exec disk-formatter-inchfield -- sgdisk --zap-all /dev/sda
GPT data structures destroyed!
Warning: The kernel is still using the old partition table.
Closer, but the kernel and Talos still had locks on the device.
Attempt 3: Reboot the node
$ talosctl -n inchfield reboot
After the reboot, I checked the disk:
$ talosctl -n inchfield get discoveredvolumes | grep usb
inchfield runtime DiscoveredVolume sda1 2 partition 1.0 TB xfs u-usb
Wait, what? It's already XFS with the u-usb label?
Turns out there was an old XFS filesystem on the disk from a previous setup. The corrupt GPT was just hiding it. The reboot cleared Talos' locks and allowed it to discover the filesystem properly.
The Second Problem: Permission Denied
With the disk working, the volume pods started... and immediately crashed:
$ kubectl logs goldentooth-storage-volume-0 -n seaweedfs
Folder /data0 Permission: -rwxr-xr-x
F1118 03:27:47 cannot generate uuid of dir /data0: failed to write uuid
to /data0/vol_dir.uuid: open /data0/vol_dir.uuid: permission denied
The helper pod created the directory as root with 755 permissions, but SeaweedFS runs as uid 1000 (non-root). Checking a working volume:
$ kubectl exec goldentooth-storage-volume-1 -n seaweedfs -- ls -ld /data0
drwxrwxrwx 2 root root 143 Nov 18 03:05 /data0
777 permissions on working volumes, 755 on inchfield's. The helper pod on inchfield must have created it with restrictive permissions.
Quick fix with another privileged pod:
$ kubectl run permission-fixer --rm -i --restart=Never \
--overrides='{"spec":{"nodeSelector":{"kubernetes.io/hostname":"inchfield"},"hostNetwork":true,"containers":[{"name":"fixer","image":"busybox","command":["sh","-c","chmod -R 777 /var/mnt/usb"],"securityContext":{"privileged":true},"volumeMounts":[{"name":"usb","mountPath":"/var/mnt/usb"}]}],"volumes":[{"name":"usb","hostPath":{"path":"/var/mnt/usb"}}]}}' \
--image=busybox -n local-path-usb-provisioner
Permissions fixed!
$ kubectl delete pods goldentooth-storage-volume-0 goldentooth-storage-volume-4 -n seaweedfs
Success
A minute later:
$ kubectl get pods -n seaweedfs
NAME READY STATUS RESTARTS AGE
goldentooth-storage-filer-0 1/1 Running 0 36m
goldentooth-storage-master-0 1/1 Running 1 (36m ago) 36m
goldentooth-storage-master-1 1/1 Running 1 (36m ago) 36m
goldentooth-storage-master-2 1/1 Running 1 (36m ago) 36m
goldentooth-storage-volume-0 1/1 Running 1 2m
goldentooth-storage-volume-1 1/1 Running 1 29m
goldentooth-storage-volume-2 1/1 Running 1 29m
goldentooth-storage-volume-3 1/1 Running 1 29m
goldentooth-storage-volume-4 1/1 Running 1 2m
goldentooth-storage-volume-5 1/1 Running 1 29m
All green! The cluster now has:
- 600GB of distributed object storage across 6 nodes
- S3-compatible API ready for Harbor
- Automatic replication (2 copies of each object)
- Fault tolerance via Raft consensus
I need to get Longhorn or smth else running so I can have an RWM volume and HA for the Filer. Probably. IDK.
Key Learnings
-
GPT has backup tables – Wiping just the beginning of a disk isn't enough. GPT keeps a backup partition table at the end, and the kernel will restore from it. Use
sgdisk --zap-all. -
Talos Volume Manager is persistent – Even after wiping partition data, Talos caches volume information. A reboot was needed to fully release locks.
-
local-path provisioner permission issues – Helper pods run as root and create directories with restrictive permissions. Applications running as non-root need 777 permissions on the mount point.
-
Partition table corruption is sneaky – Talos' DiscoveredVolumes controller scans for filesystem UUIDs directly, so it can "see" filesystems even when the partition table is corrupt. But without valid partition entries, the kernel won't create device nodes, preventing actual mounts.
SeaweedFS S3 Authentication
With SeaweedFS deployed and running, I needed to secure the S3 API before using it for Packer image storage. Running an unauthenticated S3 endpoint on the network is asking for trouble.
The Authentication Landscape
SeaweedFS offers several authentication methods with a clear priority hierarchy:
- Config File (highest priority) - Static JSON file with credentials
- Filer Storage (medium) - Dynamic credentials via
weed shellor Admin UI - Environment Variables (lowest) - Fallback only
For a GitOps-managed cluster, the config file approach makes the most sense. Credentials live in SOPS-encrypted Secrets, get decrypted by Flux, and mounted into the Filer automatically.
The Implementation
Step 1: Create the Credentials Config
I created a JSON config defining two users:
{
"identities": [
{
"name": "packer",
"credentials": [
{
"accessKey": "packer",
"secretKey": "<generated-secret>"
}
],
"actions": ["Admin", "Read", "Write", "List"]
},
{
"name": "admin",
"credentials": [
{
"accessKey": "admin",
"secretKey": "<generated-secret>"
}
],
"actions": ["Admin"]
}
]
}
Step 2: SOPS Encryption
Initially, SOPS encrypted the entire Secret (every field), making git diffs useless. The solution: use encrypted_regex to only encrypt sensitive data:
# .sops.yaml
creation_rules:
- path_regex: \.?secrets?\.ya?ml$
encrypted_regex: ^(data|stringData)$
age: age179hfp...
Now the Secret structure is visible in git, but data fields are encrypted:
apiVersion: v1
kind: Secret
metadata:
name: seaweedfs-s3-credentials
namespace: seaweedfs
data:
config.json: ENC[AES256_GCM,data:pXWU...]
Step 3: Configure the Operator
The SeaweedFS Operator has built-in support for config-based authentication via s3.configSecret:
filer:
replicas: 1
s3:
enabled: true
configSecret:
name: seaweedfs-s3-credentials
key: config.json
iam: true # Enable embedded IAM
The operator automatically:
- Mounts the Secret as
/etc/seaweedfs/config.json - Passes
-config=/etc/seaweedfs/config.jsonto the S3 component - Starts the IAM service on port 8111
Step 4: Flux Decryption
Flux needed to know to decrypt the SOPS-encrypted Secret:
# flux-kustomization.yaml
spec:
decryption:
provider: sops
secretRef:
name: sops-age
Without this, Flux tries to apply the encrypted blob directly to Kubernetes, which fails spectacularly.
Testing
Unauthenticated requests now fail:
$ curl http://10.4.11.4:8333/
HTTP/1.1 403 Forbidden
Server: SeaweedFS 30GB 4.00
Authenticated requests work:
$ AWS_ACCESS_KEY_ID=packer \
AWS_SECRET_ACCESS_KEY=... \
aws s3 ls --endpoint-url http://s3.goldentooth.net:8333
$ AWS_ACCESS_KEY_ID=packer \
AWS_SECRET_ACCESS_KEY=... \
aws s3 mb s3://test-bucket --endpoint-url http://s3.goldentooth.net:8333
make_bucket: test-bucket
What I Learned
SOPS Encryption Modes: SOPS has two modes - structured (encrypts individual YAML values) and binary (encrypts entire file). When piping through stdin, SOPS doesn't know the file type and defaults to binary. Using --encrypt --in-place after creating the file ensures structured encryption.
encrypted_regex is Essential: Without it, SOPS encrypts everything in Secrets, making git diffs show only that "something changed" without any context about what. With encrypted_regex: ^(data|stringData)$, you get clean diffs showing which keys changed while keeping values encrypted.
Operator Config Mounting: The SeaweedFS Operator's s3.configSecret abstraction is excellent. It handles all the volume mounting and argument passing automatically. Much cleaner than manually configuring volumes and args in a Deployment.
IAM vs S3 Config Priority: When using config file authentication (highest priority), it completely overrides filer-based configuration. There's no merging - it's an all-or-nothing hierarchy.
Tekton Operator: A Journey Through CRD Management Hell
I decided to set up Tekton for CI/CD pipelines. The immediate use case is building KubeVirt VM images, but Tekton's a general-purpose pipeline system that could handle all sorts of infrastructure automation. Maybe eventually I'll run a local Git server like Forgejo and have proper push-triggered builds, but for now I just want the pipeline infrastructure in place.
The Operator Approach
Tekton consists of multiple components: Pipelines (the core), Triggers (event handling), Dashboard (UI), CLI, etc. You can install each component separately, but Tekton recommends using their Operator for production setups. The operator provides a unified management plane - you install the operator once, then create a TektonConfig custom resource that declares what components you want, and the operator handles installation and lifecycle management.
This fits perfectly with the GitOps model: the operator is Layer 1, the TektonConfig is Layer 2, and actual pipeline definitions are Layer 3+.
Initial Setup: Following the Pattern
I set up the standard Flux structure I've been using for operators:
infrastructure/tekton/
├── operator/
│ ├── repository.yaml # GitRepository pointing to tektoncd/operator
│ ├── release.yaml # HelmRelease
│ ├── kustomization.yaml # Kustomize wrapper
│ └── flux-kustomization.yaml # Flux Kustomization
└── kustomization.yaml # Top-level includes
The GitRepository points to https://github.com/tektoncd/operator at tag v0.77.0. The chart exists in the repo at ./charts/tekton-operator but isn't published to a Helm repository yet, so I use a GitRepository as the source for the HelmRelease - Flux supports this natively.
The CRD Question: Skip or Create?
Initially, I set install.crds: Skip in the HelmRelease, following the "best practice" of separating CRD lifecycle from operator lifecycle. The theory is: if CRDs are tied to a Helm release and you uninstall it, the CRDs get deleted, which cascades to deleting all custom resources (via Kubernetes garbage collection). For a CI/CD system with potentially hundreds of user-created Pipelines and TaskRuns, this would be catastrophic.
So the "proper" approach is:
- Layer 0: Install CRDs separately
- Layer 1: Install operator (depends on Layer 0)
- Layer 2: Create TektonConfig (depends on Layer 1)
But this adds complexity - another layer to manage, another dependency chain.
First Crash: Missing CRDs
Pushed the config, Flux reconciled, and... the webhook pod immediately crashed:
{"level":"fatal","msg":"error deleting webhook installerset",
"error":"the server could not find the requested resource (get tektoninstallersets.operator.tekton.dev)"}
The operator's webhook needs TektonInstallerSet CRD to exist at startup. These are the operator's management CRDs (TektonConfig, TektonPipeline, TektonInstallerSet, etc.) - the resources you use to tell the operator what to install. They're different from the workload CRDs (Task, Pipeline, TaskRun, etc.) that you use to actually run pipelines.
The operator can't function without its management CRDs. They're not optional.
Attempt 1: Change to crds: Create
Found Tekton's documentation:
The Tekton operator components (especially the webhook) require the CRDs to be present during startup. If you set installCRDs=false, you MUST install the CRDs manually BEFORE installing the operator.
In a GitOps environment where all TektonConfigs and Pipelines are declared in Git, is the separate CRD management really necessary? If I uninstall and the CRDs get nuked, Flux will just recreate everything from Git.
For MetalLB, Cilium, etc., I use crds: Create or crds: CreateReplace without issues because all the custom resources (IPAddressPools, CiliumNetworkPolicies) are in Git. Same logic should apply here.
Changed to crds: Create, pushed, reconciled. Deleted the crashing webhook pod to force a fresh start.
Still crashed with the same error. WTF?
Attempt 2: Full Reconciliation
Maybe the CRDs were installed but the old pod was still stuck? Forced a full HelmRelease reconciliation:
flux reconcile helmrelease -n flux-system tekton-operator --force
Webhook pod restarted. Still crashed. Same error.
Checked if CRDs exist:
kubectl get crds | grep tekton
Nothing. No Tekton CRDs at all, despite crds: Create.
The Real Problem: Two CRD Installation Mechanisms
Turns out there are TWO different ways to install CRDs with Helm:
1. Helm's built-in CRD directory
- Charts can have a
crds/directory with CRD YAML files - Helm installs these when you install the chart
- Flux's
install.crds: Createcontrols this behavior - This is the "standard" Helm approach
2. Chart-specific value flags
- Some charts template CRD resources like any other resource
- They use a value flag (like
installCRDs: true) to control whether CRD templates are rendered - This gives the chart more control but doesn't use Helm's standard mechanism
Checked the Tekton operator chart structure:
charts/tekton-operator/
├── Chart.yaml
├── values.yaml
├── templates/
└── .helmignore
No crds/ directory! So install.crds: Create does absolutely nothing - there are no CRDs for Helm to install via its built-in mechanism.
Checked values.yaml:
## If the Tekton-operator CRDs should automatically be installed and upgraded
## Setting this to true will cause a cascade deletion of all Tekton resources when you uninstall
installCRDs: false
There it is. The chart has installCRDs as a template value that controls whether CRD resources are generated in the templates. Defaults to false.
The Fix
Added to the HelmRelease values:
values:
installCRDs: true
resources:
limits:
cpu: 200m
memory: 256Mi
requests:
cpu: 100m
memory: 128Mi
Pushed, reconciled. Checked CRDs:
kubectl get crds | grep tekton
manualapprovalgates.operator.tekton.dev
tektonchains.operator.tekton.dev
tektonconfigs.operator.tekton.dev
tektondashboards.operator.tekton.dev
tektonhubs.operator.tekton.dev
tektoninstallersets.operator.tekton.dev
tektonpipelines.operator.tekton.dev
tektonpruners.operator.tekton.dev
tektonresults.operator.tekton.dev
tektontriggers.operator.tekton.dev
There they are! Webhook pod restarted and came up clean:
kubectl get pods -n tekton-operator
NAME READY STATUS RESTARTS AGE
tekton-operator-tekton-operator-79df9897cd-7mf2f 2/2 Running 0 16m
tekton-operator-tekton-operator-webhook-5c455997df-2qvzp 1/1 Running 7 (11m ago) 16m
Both pods happy. Operator ready.
About That Cascade Deletion Warning
The chart's values.yaml has a scary warning:
Setting this to true will cause a cascade deletion of all Tekton resources when you uninstall the chart - danger!
This is true, but in a GitOps environment it's less catastrophic than it sounds. If I uninstall the operator:
- Helm deletes the operator Deployment
- Helm deletes the CRDs (because
installCRDs: truemeans the chart owns them) - Kubernetes garbage-collects all CRs (TektonConfig, etc.)
- The operator (now deleted) would have deleted Pipelines/Tasks, but it's gone
- Flux sees the TektonConfig is missing and recreates it from Git
- Wait, the CRDs are gone, so the TektonConfig can't be created
- Chicken-egg problem during recovery
So there IS a risk during operator reinstallation. But:
- I'm not planning to uninstall the operator regularly
- If I do need to reinstall, I can just wait for the operator to come back up, then Flux recreates everything
- The alternative (Layer 0 CRD management) adds ongoing complexity for every upgrade
For this cluster's scale and use case, the tradeoff is worth it. If I were running a multi-tenant CI/CD platform with hundreds of users creating thousands of pipelines, I'd separate the CRD lifecycle. But for infrastructure automation and VM builds? The simpler approach wins.
Part Two: The Helm Chart Was a Lie
A few days later, I tried to actually configure Tekton with a TektonConfig. This is where things went sideways. Spectacularly.
The Webhook Naming Bug
When I created the TektonConfig, Flux reported:
TektonConfig/config dry-run failed: admission webhook "webhook.operator.tekton.dev" denied the request
Dug into it - the webhook was looking for a service named tekton-operator-webhook, but the Helm chart created a service named tekton-operator-tekton-operator-webhook. Classic Helm double-naming bug where the release name (tekton-operator) gets concatenated with the chart's internal naming (tekton-operator-webhook). I considered a few options for dealing with this, and none of them seemed particularly appealing.
Ditching Helm for Raw Manifests
The official Tekton installation docs don't even use Helm. They just do:
kubectl apply -f https://storage.googleapis.com/tekton-releases/operator/latest/release.yaml
Fine. Let's use the official manifests. The tektoncd/operator repo at v0.77.0 has a nice Kustomize structure, so I updated my Flux Kustomization to point to the tekton-operator GitRepository at that path.
The ko:// Nightmare
Pods started spinning up, but:
State: Waiting
Reason: InvalidImageName
Events:
Warning InspectFailed kubelet Failed to apply default image tag
"ko://github.com/tektoncd/operator/cmd/kubernetes/webhook":
couldn't parse image name: invalid reference format
The image field was literally ko://github.com/tektoncd/operator/cmd/kubernetes/webhook.
What. The. Fuck.
Turns out the repo source manifests are meant to be processed by ko, a tool that builds Go containers and replaces these placeholder URLs with actual container image references. The "release" artifacts on GCS have real images like gcr.io/tekton-releases/..., but the repo source files are just templates.
I grabbed the wrong thing. The repo isn't what you deploy. The repo is what you build to create what you deploy.
Vendoring the Release Manifest
Fine. Downloaded the actual release manifest:
curl -sL "https://storage.googleapis.com/tekton-releases/operator/previous/v0.77.0/release.yaml" \
-o infrastructure/tekton/operator/manifests/release.yaml
Updated the Flux structure to vendor the manifest:
infrastructure/tekton/operator/
├── flux-kustomization.yaml
├── kustomization.yaml
├── operator-install.yaml # Points to manifests/
└── manifests/
├── kustomization.yaml
└── release.yaml # Vendored v0.77.0 release
Pushed. Reconciled. Operator finally deployed with real container images.
Stuck CRDs During Reinstall
Of course it wasn't that simple. The old Helm installation left behind CRDs with finalizers. One CRD (tektoninstallersets.operator.tekton.dev) was stuck in Terminating state, blocking the new installation.
The culprit: an orphaned TektonInstallerSet resource with its own finalizer that was blocking the CRD from being deleted, which was blocking Flux from applying the new manifests.
# Nuclear option: remove the finalizer
kubectl patch tektoninstallerset validating-mutating-webhook-pknjj \
-p '{"metadata":{"finalizers":[]}}' --type=merge
CRD finished deleting. New installation proceeded.
TektonConfig Schema Fun
Now I needed to actually configure Tekton with a TektonConfig. Tried to be clever with settings like disable-creds-init and replica counts. Webhook rejected it:
unknown field "disable-creds-init"
kubectl explain tektonconfig.spec returned nothing useful because the CRD uses x-kubernetes-preserve-unknown-fields: true. Had to look at the actual example in the repo:
apiVersion: operator.tekton.dev/v1alpha1
kind: TektonConfig
metadata:
name: config
spec:
profile: all
targetNamespace: tekton-pipelines
That's it. The minimal config is very minimal. My elaborate config with custom options was using fields that don't exist in v0.77.0.
Profile: all Means ALL
Used profile: all. Seemed reasonable. But "all" includes TektonResult, which needs a PostgreSQL database I don't have. Components kept failing because Result couldn't reconcile.
The fix was disabling the components I don't want:
spec:
profile: all
targetNamespace: tekton-pipelines
result:
disabled: true # Needs PostgreSQL
chain:
disabled: true # Needs signing infrastructure
Finally. TektonConfig applied. Components deployed. Dashboard running.
Exposing the Dashboard
The operator manages the Dashboard service, so I can't just change it to a LoadBalancer (it would get reverted). Created a separate LoadBalancer service:
apiVersion: v1
kind: Service
metadata:
name: tekton-dashboard-lb
namespace: tekton-pipelines
annotations:
external-dns.alpha.kubernetes.io/hostname: tekton-dashboard.goldentooth.net
spec:
type: LoadBalancer
selector:
app.kubernetes.io/name: dashboard
app.kubernetes.io/component: dashboard
ports:
- name: http
port: 80
targetPort: 9097
Dashboard is now accessible at http://tekton-dashboard.goldentooth.net.
JupyterLab with GPU: The ML Workbench
After getting Velaryon's GPU working in Talos (see 075_velaryon_gpu_talos), I had the hardware foundation for machine learning workloads. But running nvidia-smi in a test pod is a far cry from actually doing ML work. I wanted a proper development environment—something where I could fire up a notebook, import PyTorch, and start experimenting with neural networks.
The goal: JupyterLab running on Kubernetes with full GPU access, persistent storage for notebooks, and authentication that doesn't change every time the pod restarts.
The Architecture
The ML workbench needed several pieces working together:
┌─────────────────────────────────────────────────────────────────┐
│ JupyterLab Pod │
│ ┌─────────────────────────────────────────────────────────┐ │
│ │ cschranz/gpu-jupyter:v1.5_cuda-12.0_ubuntu-22.04 │ │
│ │ - PyTorch 2.1.2 + CUDA │ │
│ │ - TensorFlow │ │
│ │ - JupyterLab server │ │
│ └─────────────────────────────────────────────────────────┘ │
│ │ │ │
│ ▼ ▼ │
│ ┌────────────────┐ ┌─────────────────┐ │
│ │ nvidia.com/gpu │ │ PVC (local-path)│ │
│ │ = 1 │ │ 50Gi NVMe │ │
│ └────────────────┘ └─────────────────┘ │
└─────────────────────────────────────────────────────────────────┘
│
▼
┌───────────────────────┐
│ NVIDIA Device Plugin │
│ (advertises GPU to │
│ K8s scheduler) │
└───────────────────────┘
Missing Piece #1: NVIDIA Device Plugin
Velaryon had the GPU drivers and the RuntimeClass configured, but Kubernetes didn't actually know a GPU existed. Running kubectl get node velaryon -o jsonpath='{.status.capacity}' showed CPU and memory, but no nvidia.com/gpu resource.
The NVIDIA Device Plugin is a DaemonSet that discovers GPUs on nodes and advertises them to the Kubernetes scheduler. Without it, you can't request nvidia.com/gpu: 1 in your pod spec — Kubernetes has no idea what that means.
I deployed it via Helm in the GitOps repo:
# gitops/infrastructure/nvidia/release.yaml
apiVersion: helm.toolkit.fluxcd.io/v2beta1
kind: HelmRelease
metadata:
name: nvidia-device-plugin
namespace: flux-system
spec:
chart:
spec:
chart: nvidia-device-plugin
version: "0.18.0"
sourceRef:
kind: HelmRepository
name: nvidia-device-plugin
values:
runtimeClassName: nvidia
nodeSelector:
role: gpu
tolerations:
- key: gpu
operator: Equal
value: "true"
effect: NoSchedule
The chart has a default affinity that looks for nodes with NVIDIA hardware via the nvidia.com/gpu.present label. Since I was using a custom role: gpu label, I had to add the expected label to Velaryon's Talos config:
# cluster/talconfig.yaml
- hostname: velaryon
nodeLabels:
role: 'gpu'
nvidia.com/gpu.present: 'true'
After applying the config with talosctl apply-config, the Device Plugin scheduled and suddenly:
{
"cpu": "24",
"memory": "32786032Ki",
"nvidia.com/gpu": "1"
}
The GPU exists to Kubernetes now.
Missing Piece #2: SeaweedFS CSI Driver
I wanted notebooks to persist across pod restarts. SeaweedFS was already running in the cluster, but there was no CSI driver to provision PersistentVolumeClaims from it.
The SeaweedFS CSI driver translates Kubernetes storage concepts (PVC, StorageClass) into SeaweedFS Filer operations:
# gitops/infrastructure/seaweedfs/csi/release.yaml
apiVersion: helm.toolkit.fluxcd.io/v2beta1
kind: HelmRelease
metadata:
name: seaweedfs-csi-driver
spec:
chart:
spec:
chart: seaweedfs-csi-driver
version: "0.2.3" # Note: Chart version, not app version!
values:
seaweedfsFiler: "goldentooth-storage-filer.seaweedfs:8888"
storageClassName: seaweedfs
isDefaultStorageClass: false
The RBAC Rabbit Hole
When I tried to provision a PVC using local-path storage (for faster NVMe access), the provisioner failed with:
nodes "velaryon" is forbidden: User "system:serviceaccount:local-path-storage:local-path-provisioner-service-account" cannot get resource "nodes"
Turns out I had two local-path provisioners—one for regular storage and one for USB SSDs—and they were fighting over the same ClusterRoleBinding. The USB provisioner deployed second and overwrote the binding with its own namespace.
The fix was giving each provisioner its own explicitly-named ClusterRoleBinding:
# local-path-provisioner/rbac-fix.yaml
apiVersion: rbac.authorization.k8s.io/v1
kind: ClusterRoleBinding
metadata:
name: local-path-provisioner-bind-storage
roleRef:
kind: ClusterRole
name: local-path-provisioner-role
subjects:
- kind: ServiceAccount
name: local-path-provisioner-service-account
namespace: local-path-storage
Same for the USB provisioner with -bind-usb. Both bind to the same ClusterRole (the permissions are identical), they just don't clobber each other's bindings anymore.
JupyterLab Deployment
With GPU and storage sorted, the JupyterLab deployment itself was straightforward:
# gitops/apps/jupyterlab/deployment.yaml
spec:
template:
spec:
runtimeClassName: nvidia
nodeSelector:
role: gpu
tolerations:
- key: gpu
operator: Equal
value: "true"
effect: NoSchedule
containers:
- name: jupyterlab
image: cschranz/gpu-jupyter:v1.5_cuda-12.0_ubuntu-22.04
env:
- name: JUPYTER_TOKEN
valueFrom:
secretKeyRef:
name: jupyterlab-auth
key: token
resources:
limits:
nvidia.com/gpu: "1"
volumeMounts:
- name: workspace
mountPath: /home/jovyan/work
volumes:
- name: workspace
persistentVolumeClaim:
claimName: jupyterlab-workspace
The key pieces:
runtimeClassName: nvidia— Uses Talos's NVIDIA container runtimenodeSelectorandtolerations— Ensures scheduling on Velaryonnvidia.com/gpu: 1— Requests the GPU from the Device Plugin- SOPS-encrypted secret for the authentication token
The cschranz/gpu-jupyter image is a community project that combines Jupyter Docker Stacks with CUDA support. It comes with PyTorch, TensorFlow, and common ML libraries pre-installed. The image is ~8GB, so first pull takes a while.
The Moment of Truth
After pushing all the configs and waiting for Flux to reconcile (and the massive image to pull), I opened http://10.4.11.6 in my browser, entered my password, and ran:
import torch
print(f"PyTorch version: {torch.__version__}")
print(f"CUDA available: {torch.cuda.is_available()}")
print(f"GPU: {torch.cuda.get_device_name(0)}")
Output:
PyTorch version: 2.1.2+cu121
CUDA available: True
GPU: NVIDIA GeForce RTX 2070 SUPER
And a quick matrix multiply to prove it actually works:
x = torch.randn(1000, 1000, device='cuda')
y = torch.randn(1000, 1000, device='cuda')
z = torch.matmul(x, y)
print(f"Matrix multiply on GPU: {z.shape}")

8.4GB of VRAM ready for neural network experiments. Not bad for a Raspberry Pi cluster's sidekick.
Time-Slicing: Sharing the GPU
There was one problem with this setup: while JupyterLab was running (even idle), it held the GPU exclusively. Requesting nvidia.com/gpu: 1 means "give me sole access to one GPU." With only one GPU on Velaryon, I couldn't run any other GPU workloads without scaling JupyterLab to zero first.
The fix is time-slicing, a feature of the NVIDIA Device Plugin that advertises a single physical GPU as multiple virtual GPUs. Pods take turns via context-switching—like how an OS schedules multiple processes on a single CPU.
# gitops/infrastructure/nvidia/time-slicing-config.yaml
apiVersion: v1
kind: ConfigMap
metadata:
name: nvidia-device-plugin-config
namespace: nvidia
data:
config.yaml: |
version: v1
sharing:
timeSlicing:
resources:
- name: nvidia.com/gpu
replicas: 4
With this config, Velaryon advertises nvidia.com/gpu: 4 instead of 1. JupyterLab can keep running with its GPU request, and I can still launch 3 more GPU pods for training jobs or inference.
The caveat: time-slicing doesn't partition memory. All pods see the full 8GB VRAM. If multiple pods try to allocate more than 8GB combined, you get CUDA OOM errors. For learning and experimentation where I'm not running multiple heavy jobs simultaneously, this is rarely an issue.
The infrastructure is ready for Karpathy's nanoGPT and similar educational ML projects. The RTX 2070 Super's 8GB VRAM can handle GPT-2 sized models comfortably—plenty for learning transformer architectures from scratch.
First Real Test: minGPT
To prove this wasn't all just infrastructure theater, I cloned Karpathy's minGPT directly in JupyterLab's terminal:
cd /home/jovyan/work
git clone https://github.com/karpathy/minGPT.git
cd minGPT
pip install -e .
The generate.ipynb notebook loads a pretrained GPT-2 and generates text completions. One small hiccup: the container's PyTorch 2.1.2 didn't play nice with the latest transformers library (4.57.1). The register_pytree_node API changed between versions, causing import failures. The fix was pinning to a contemporary version:
pip install transformers==4.35.2
After a kernel restart to clear Python's module cache, everything worked. GPT-2 had some interesting things to say about me:
generate(prompt='Nathan Douglas, the undisputed', num_samples=10, steps=20)
---
Nathan Douglas, the undisputed number two on the Eagles' 2015 draft board, announced his retirement on Monday.
Nathan Douglas, the undisputed champion of the British-Canadian soccer circuit, is a former student of the sport.
Nathan Douglas, the undisputed best QB in the league, did go to the same AAU program, but he didn't even
Nathan Douglas, the undisputed king of the world, is one of only two kings known to have ever held the throne of England
The "undisputed king of the world" and "champion of the British-Canadian soccer circuit" — GPT-2 is nothing if not flattering.
Time to train some tiny language models.
GPU Gaming Containers: The Quest Begins
After getting JupyterLab working with GPU support (see 082_jupyterlab_gpu), I had a taste of what GPU workloads could do in Kubernetes. Neural networks are cool, but you know what would be cooler? Playing Baldur's Gate 3 streamed from a containerized Steam instance running on my cluster.
The plan: Use Packer to build a gaming container image with Steam and Proton, run it on velaryon's RTX 2070 Super, and stream games via Steam Remote Play. This is definitely overkill for playing video games, but that's never stopped me before.
The Architecture: CUDA vs OpenGL
Before diving in, I needed to understand what makes gaming different from machine learning workloads. JupyterLab uses CUDA—NVIDIA's framework for general-purpose parallel computing. You write kernels that run math operations across thousands of GPU cores. Matrix multiplication, neural network training, that sort of thing.
Gaming uses OpenGL (or Vulkan), which is specifically designed for 3D graphics rendering. It's a fixed pipeline:
Vertices → Vertex Shader → Rasterization → Fragment Shader → Pixels
Both use the same GPU hardware, but they're different programming models. CUDA is "here's data and a function, run it everywhere." OpenGL is "here's a 3D scene, transform and render it through these specific stages."
The RTX 2070 Super has both capabilities. JupyterLab already proved CUDA works. Now I needed to verify the graphics path worked too.
Stage 1: Verifying the Foundation
First, I checked that the NVIDIA device plugin was still running:
$ kubectl get pods -n nvidia
NAME READY STATUS RESTARTS AGE
nvidia-nvidia-device-plugin-wflzh 2/2 Running 0 3d23h
Good. The device plugin is what advertises GPU resources to Kubernetes. Without it, you can't request nvidia.com/gpu: 1 in your pod spec.
Next, I verified velaryon was advertising GPU capacity:
$ kubectl get node velaryon -o jsonpath='{.status.capacity}' | jq
{
"cpu": "24",
"memory": "32786032Ki",
"nvidia.com/gpu": "4",
...
}
Four GPUs! Well, one physical GPU time-sliced into four virtual ones. The time-slicing config from the JupyterLab setup advertises 1 physical RTX 2070 Super as 4 resources via context-switching. JupyterLab is using one slot, leaving three free.
Testing CUDA Access
I created a simple test pod to verify CUDA still worked:
# gpu-test-pod.yaml
apiVersion: v1
kind: Pod
metadata:
name: gpu-test
spec:
runtimeClassName: nvidia # Use NVIDIA container runtime
nodeSelector:
role: gpu
tolerations:
- key: gpu
operator: Equal
value: "true"
effect: NoSchedule
containers:
- name: gpu-test
image: nvidia/cuda:12.0.0-base-ubuntu22.04
command: ["nvidia-smi"]
resources:
limits:
nvidia.com/gpu: "1"
The key pieces:
runtimeClassName: nvidia- Tells Kubernetes to use Talos's NVIDIA container runtime (which mounts GPU device files and driver libraries)resources.limits.nvidia.com/gpu: 1- Requests one GPU from the device pluginnodeSelectorandtolerations- Ensures it schedules on velaryon
$ kubectl apply -f gpu-test-pod.yaml
$ kubectl logs gpu-test
Thu Nov 27 16:58:24 2025
+---------------------------------------------------------------------------------------+
| NVIDIA-SMI 535.247.01 Driver Version: 535.247.01 CUDA Version: 12.2 |
|-----------------------------------------+----------------------+----------------------+
| GPU Name Persistence-M | Bus-Id Disp.A | Volatile Uncorr. ECC |
| Fan Temp Perf Pwr:Usage/Cap | Memory-Usage | GPU-Util Compute M. |
|=========================================+======================+======================|
| 0 NVIDIA GeForce RTX 2070 ... On | 00000000:2D:00.0 Off | N/A |
| 0% 46C P8 19W / 215W | 749MiB / 8192MiB | 0% Default |
+---------------------------------------------------------------------------------------+
Perfect. CUDA access works. The container sees the GPU, the driver, everything. The 749MiB of used VRAM is JupyterLab sitting idle.
Testing OpenGL: The llvmpipe Problem
CUDA working doesn't guarantee OpenGL works. Time to test graphics rendering. I created a test that runs glxgears (a simple OpenGL demo) in a container:
# gpu-opengl-test-pod.yaml (first attempt)
apiVersion: v1
kind: Pod
metadata:
name: gpu-opengl-test
spec:
runtimeClassName: nvidia
nodeSelector:
role: gpu
tolerations:
- key: gpu
operator: Equal
value: "true"
effect: NoSchedule
containers:
- name: opengl-test
image: nvidia/opengl:1.2-glvnd-runtime-ubuntu22.04
command:
- /bin/bash
- -c
- |
apt-get update -qq
apt-get install -y -qq mesa-utils xvfb
Xvfb :99 -screen 0 1024x768x24 &
export DISPLAY=:99
sleep 2
glxinfo | grep -E "OpenGL renderer|OpenGL version"
timeout 5s glxgears -info
resources:
limits:
nvidia.com/gpu: "1"
env:
- name: NVIDIA_VISIBLE_DEVICES
value: "all"
- name: NVIDIA_DRIVER_CAPABILITIES
value: "all"
The script:
- Installs
mesa-utils(OpenGL testing tools) andxvfb(virtual X server) - Starts Xvfb on display :99 (OpenGL needs an X server to create a rendering context)
- Runs
glxinfoto see what OpenGL renderer is being used
The result:
OpenGL renderer string: llvmpipe (LLVM 15.0.7, 256 bits)
OpenGL version string: 4.5 (Compatibility Profile) Mesa 23.2.1
llvmpipe. That's Mesa's CPU-based software renderer. OpenGL was rendering on the CPU, not the GPU. Games would run at maybe 2 FPS with this.
The Debugging Journey
This was frustrating. nvidia-smi worked perfectly, proving the GPU was accessible. But OpenGL couldn't see it. Something was broken in the graphics path specifically.
I deployed a long-running debug pod to investigate:
apiVersion: v1
kind: Pod
metadata:
name: gpu-debug
spec:
runtimeClassName: nvidia
nodeSelector:
role: gpu
tolerations:
- key: gpu
operator: Equal
value: "true"
effect: NoSchedule
containers:
- name: debug
image: nvidia/opengl:1.2-glvnd-runtime-ubuntu22.04
command: ["sleep", "infinity"]
resources:
limits:
nvidia.com/gpu: "1"
env:
- name: NVIDIA_VISIBLE_DEVICES
value: "all"
- name: NVIDIA_DRIVER_CAPABILITIES
value: "all"
Then I exec'd in and started poking around:
$ kubectl exec -it gpu-debug -- bash
# Check if NVIDIA libraries are mounted
root@gpu-debug:/# ls -la /usr/lib/x86_64-linux-gnu/libnvidia* | head -20
lrwxrwxrwx. 1 root root 33 Nov 27 17:28 /usr/lib/x86_64-linux-gnu/libnvidia-allocator.so.1 -> libnvidia-allocator.so.535.247.01
-rwxr-xr-x. 1 root root 160552 Jun 1 2019 /usr/lib/x86_64-linux-gnu/libnvidia-allocator.so.535.247.01
...
-rwxr-xr-x. 1 root root 45959040 Jun 1 2019 /usr/lib/x86_64-linux-gnu/libnvidia-glcore.so.535.247.01
-rwxr-xr-x. 1 root root 656472 Jun 1 2019 /usr/lib/x86_64-linux-gnu/libnvidia-glsi.so.535.247.01
The NVIDIA graphics libraries were there! libnvidia-glcore, libnvidia-glsi, all the OpenGL stuff. The NVIDIA runtime was doing its job and mounting the driver libraries.
# Check GLX libraries
root@gpu-debug:/# ls -la /usr/lib/x86_64-linux-gnu/libGL*
lrwxrwxrwx. 1 root root 14 Jan 4 2022 /usr/lib/x86_64-linux-gnu/libGL.so.1 -> libGL.so.1.7.0
-rw-r--r--. 1 root root 543056 Jan 4 2022 /usr/lib/x86_64-linux-gnu/libGL.so.1.7.0
...
lrwxrwxrwx. 1 root root 27 Nov 27 17:28 /usr/lib/x86_64-linux-gnu/libGLX_nvidia.so.0 -> libGLX_nvidia.so.535.247.01
-rwxr-xr-x. 1 root root 1195552 Jun 1 2019 /usr/lib/x86_64-linux-gnu/libGLX_nvidia.so.535.247.01
lrwxrwxrwx. 1 root root 20 Dec 15 2022 /usr/lib/x86_64-linux-gnu/libGLX_mesa.so.0 -> libGLX_mesa.so.0.0.0
-rw-r--r--. 1 root root 459672 Dec 15 2022 /usr/lib/x86_64-linux-gnu/libGLX_mesa.so.0.0.0
Interesting. Both NVIDIA and Mesa GLX libraries existed. libGLX_nvidia.so was the NVIDIA implementation, libGLX_mesa.so was the software renderer. OpenGL was choosing Mesa.
# Check ICD (Installable Client Driver) configs
root@gpu-debug:/# ls -la /usr/share/glvnd/egl_vendor.d/
total 5
drwxr-xr-x. 1 root root 28 May 17 2023 .
drwxr-xr-x. 1 root root 26 May 17 2023 ..
-rw-r--r--. 1 root root 107 Jun 1 2019 10_nvidia.json
-rw-r--r--. 1 root root 105 Dec 15 2022 50_mesa.json
ICD config files tell GLVND (the OpenGL loader) which vendor libraries to use. The files are numbered—lower numbers have higher priority. 10_nvidia.json should be preferred over 50_mesa.json.
root@gpu-debug:/# cat /usr/share/glvnd/egl_vendor.d/10_nvidia.json
{
"file_format_version" : "1.0.0",
"ICD" : {
"library_path" : "libEGL_nvidia.so.0"
}
}
Wait. This ICD config is for EGL (libEGL_nvidia.so.0), not GLX.
EGL vs GLX: The Missing Link
EGL and GLX are two different OpenGL windowing systems:
- GLX (GL + X11): Traditional Linux OpenGL, works with X11 servers like Xvfb
- EGL (Embedded GL): Modern, platform-agnostic OpenGL for Wayland or headless contexts
When I ran glxinfo, I was testing GLX. But the NVIDIA ICD config only told GLVND about EGL libraries. There was no /usr/share/glvnd/glx_vendor.d/ directory with GLX configs.
I tried setting an environment variable that explicitly tells GLVND to use NVIDIA for GLX:
root@gpu-debug:/# export __GLX_VENDOR_LIBRARY_NAME=nvidia
root@gpu-debug:/# glxinfo | grep "OpenGL renderer"
OpenGL renderer string: NVIDIA GeForce RTX 2070 SUPER/PCIe/SSE2
There it is. With __GLX_VENDOR_LIBRARY_NAME=nvidia, GLVND used the NVIDIA libraries instead of Mesa. GPU-accelerated rendering worked.
The Fix
The solution was adding that environment variable to the pod spec:
env:
- name: NVIDIA_VISIBLE_DEVICES
value: "all"
- name: NVIDIA_DRIVER_CAPABILITIES
value: "all"
# Tell GLVND to use NVIDIA for GLX (not Mesa)
- name: __GLX_VENDOR_LIBRARY_NAME
value: "nvidia"
After updating the test pod and rerunning:
OpenGL renderer string: NVIDIA GeForce RTX 2070 SUPER/PCIe/SSE2
OpenGL version string: 4.6.0 NVIDIA 535.247.01
GL_VENDOR = NVIDIA Corporation
Perfect. OpenGL 4.6 support with full GPU acceleration. More than enough for modern games.
What I Learned
CUDA vs OpenGL: CUDA is for general parallel compute (neural networks, matrix math). OpenGL is for 3D graphics rendering (games, visualization). Both use the same GPU hardware but through different programming models.
Container Runtime Classes: The runtimeClassName: nvidia tells Kubernetes to use Talos's NVIDIA container runtime, which mounts GPU device files (/dev/nvidia*) and driver libraries into the container. Without this, containers can't access the GPU even if the device plugin allocated a GPU resource.
NVIDIA Environment Variables:
NVIDIA_VISIBLE_DEVICES=all- Makes all GPUs visible to the containerNVIDIA_DRIVER_CAPABILITIES=all- Enables graphics, compute, video encoding/decoding, etc.__GLX_VENDOR_LIBRARY_NAME=nvidia- Tells GLVND to use NVIDIA's GLX implementation instead of Mesa
GLVND Vendor Dispatch: GLVND (GL Vendor Neutral Dispatch) is the modern OpenGL loader that supports multiple GPU vendors on the same system. It uses ICD config files to discover which vendor libraries to load. In containers, the EGL configs are present but the GLX configs are missing, so you need the __GLX_VENDOR_LIBRARY_NAME env var for explicit vendor selection.
The Debugging Process: When something doesn't work, trace the path systematically:
- Verify the hardware is accessible (nvidia-smi)
- Check if libraries are mounted (
ls /usr/lib/.../libnvidia*) - Check ICD loader configs (
/usr/share/glvnd/) - Use environment variables to force specific behavior
- Test in an interactive shell (
kubectl exec -it) before building automated solutions
Next Steps
Stage 1 is complete: GPU-accelerated OpenGL rendering works in containers. The foundation is solid.
Stage 2 will be building a full GUI container with VNC so I can actually see and interact with applications. That means:
- Setting up a proper X server (not just Xvfb)
- Installing a lightweight window manager
- Configuring TigerVNC for remote access
- Making it accessible via Kubernetes Service/Ingress
Then Stage 3: Getting Steam and Proton running in that container.
This is going to be fun. Or frustrating. Probably both.
Docker Registry: Because Harbor is Too Good for ARM64
I needed a container registry for the cluster. Something to push my own images to, especially for KubeVirt VM disk images. Harbor seemed like the obvious choice – it's the industry standard, has a nice UI, vulnerability scanning, the works.
Except Harbor doesn't officially support ARM64 yet. There are community builds and some PRs in flight for v2.14, but I'm running a Raspberry Pi cluster. I don't have time to debug multi-arch manifest issues for a registry that's basically 7+ components just to store some container images.
So: Docker Registry v2. The reference implementation. One container. Works on ARM64. Done.
What is Docker Registry v2?
Docker Registry v2 is the OCI Distribution spec reference implementation. It's what Harbor uses internally for the actual registry component. Everything else Harbor provides (web UI, RBAC, scanning, replication) is management layer on top.
For a single-user homelab, I don't need any of that. I just need:
- Push images (
docker push registry.goldentooth.net/myapp:v1) - Pull images (
docker pull registry.goldentooth.net/myapp:v1) - Store everything in SeaweedFS S3
- TLS via cert-manager
Registry v2 does all of this in ~50MB of RAM.
The Architecture
Client (docker/skopeo)
↓ HTTPS (TLS via cert-manager)
LoadBalancer Service (10.4.11.8)
↓
Registry Pod (single container)
├── Config: /etc/docker/registry/config.yml
├── Certs: /certs/tls.{crt,key} (from cert-manager)
└── S3 Backend → SeaweedFS Filer
↓
Volume Servers (USB SSDs)
The registry is stateless – all image data lives in SeaweedFS S3 (harbor-registry bucket), and the registry just coordinates uploads/downloads.
The Deployment
I created the Flux structure under gitops/infrastructure/docker-registry/:
Namespace and Certificate
---
apiVersion: v1
kind: Namespace
metadata:
name: docker-registry
---
apiVersion: cert-manager.io/v1
kind: Certificate
metadata:
name: registry-tls
namespace: docker-registry
spec:
secretName: registry-tls
duration: 24h
renewBefore: 8h
commonName: registry.goldentooth.net
dnsNames:
- registry.goldentooth.net
issuerRef:
name: step-ca
kind: StepClusterIssuer
group: certmanager.step.sm
cert-manager + Step-CA handles TLS automatically with 24-hour certificate rotation.
Registry Configuration
The registry uses a YAML config mounted from a ConfigMap:
storage:
redirect:
disable: true # Important! Explained later.
s3:
region: us-east-1
regionendpoint: http://goldentooth-storage-filer.seaweedfs.svc.cluster.local:8333
bucket: harbor-registry
secure: false
v4auth: true
delete:
enabled: true
cache:
blobdescriptor: inmemory
http:
addr: :5000
tls:
certificate: /certs/tls.crt
key: /certs/tls.key
S3 credentials come from environment variables (REGISTRY_STORAGE_S3_ACCESSKEY / REGISTRY_STORAGE_S3_SECRETKEY) loaded from a SOPS-encrypted Secret.
Deployment and Service
Single-pod Deployment with aggressive resource limits (0.25 CPU, 256MB RAM – this is a homelab):
apiVersion: apps/v1
kind: Deployment
metadata:
name: docker-registry
namespace: docker-registry
spec:
replicas: 1
template:
spec:
containers:
- name: registry
image: registry:2
env:
- name: REGISTRY_STORAGE_S3_ACCESSKEY
valueFrom:
secretKeyRef:
name: registry-s3-secret
key: accesskey
- name: REGISTRY_STORAGE_S3_SECRETKEY
valueFrom:
secretKeyRef:
name: registry-s3-secret
key: secretkey
volumeMounts:
- name: config
mountPath: /etc/docker/registry
- name: certs
mountPath: /certs
LoadBalancer Service with external-dns annotation:
apiVersion: v1
kind: Service
metadata:
name: docker-registry
annotations:
external-dns.alpha.kubernetes.io/hostname: registry.goldentooth.net
spec:
type: LoadBalancer
ports:
- port: 443
targetPort: 5000
MetalLB assigns an IP, external-dns creates the DNS record, cert-manager provides the cert. Everything automatic.
The Problems: A TLS Odyssey
I deployed everything. Flux reconciled. The registry pod started. The LoadBalancer got an IP. DNS resolved. The certificate was issued.
Time to test:
$ docker push registry.goldentooth.net/test/busybox:latest
denied:
Problem 1: Certificate Chain Issues
The error was actually a TLS verification failure, but Docker just said "denied" with no details. Helpful.
The issue: Docker wasn't trusting the Step-CA certificate. I added the root CA to the macOS system keychain:
$ kubectl get configmap -n step-ca step-ca-step-ca-step-certificates-certs \
-o jsonpath='{.data.root_ca\.crt}' > /tmp/goldentooth-ca.crt
$ sudo security add-trusted-cert -d -r trustRoot \
-k /Library/Keychains/System.keychain /tmp/goldentooth-ca.crt
Docker still failed. Turns out Docker Desktop on macOS doesn't use the system keychain – it has its own certificate store at ~/.docker/certs.d/<hostname>/ca.crt.
I copied the certificate there:
$ mkdir -p ~/.docker/certs.d/registry.goldentooth.net
$ cp /tmp/goldentooth-ca.crt ~/.docker/certs.d/registry.goldentooth.net/ca.crt
Restarted Docker Desktop. Still failed.
Turns out the registry was serving a certificate signed by an intermediate CA, not the root. I needed the full chain:
$ openssl s_client -connect registry.goldentooth.net:443 -showcerts 2>/dev/null </dev/null | \
sed -n '/BEGIN CERTIFICATE/,/END CERTIFICATE/p' > \
~/.docker/certs.d/registry.goldentooth.net/ca.crt
Still failed.
Problem 2: The Docker Desktop Bug
After a few more minutes of TLS debugging, I found the real issue: Docker Desktop 4.32+ (including my version 28.0.1) has a broken insecure-registries implementation on macOS.
There's a confirmed bug where the setting is completely ignored. This started in mid-2024 and affects all recent versions. Docker uploads blobs successfully, then refuses to push the manifest with "denied" – but the registry logs show Docker never even tried to push the manifest.
The registry was working fine. Docker blobs were uploading to S3. Docker was just... giving up before pushing the final manifest for no clear reason.
Solution: Use Skopeo
Skopeo is a Docker alternative that doesn't require a daemon and doesn't have Docker Desktop's bugs. Installed it:
$ brew install skopeo
Pushed the image:
$ skopeo copy --dest-tls-verify=false \
docker-daemon:alpine:latest \
docker://registry.goldentooth.net/test/alpine:v1
Getting image source signatures
Copying blob sha256:0e64f2360a44...
Copying config sha256:171e65262c80...
Writing manifest to image destination
It worked. First try. Blobs, config, and manifest all pushed successfully.
Verified with Docker pull:
$ docker pull registry.goldentooth.net/test/alpine:v1
v1: Pulling from test/alpine
Digest: sha256:6ecfe31476d1...
Status: Downloaded newer image
Perfect. The registry works. Docker Desktop is just broken.
Problem 3: The S3 Redirect Issue
I tested pulling with skopeo:
$ skopeo copy docker://registry.goldentooth.net/test/alpine:v1 docker-daemon:test:latest
time="2025-11-29T14:04:05-05:00" level=fatal msg="reading blob: Get \"http://goldentooth-storage-filer.seaweedfs.svc.cluster.local:8333/...\": no such host"
The registry was sending skopeo a 307 redirect to the internal SeaweedFS S3 endpoint (.svc.cluster.local), which isn't resolvable from outside the cluster.
What's Happening
By default, Docker Registry sends HTTP 307 redirects for blob downloads. Instead of proxying the image layer data through itself, it tells clients: "go fetch this blob directly from S3 at this URL."
This is efficient for large registries (saves bandwidth on the registry pod), but only works if clients can reach the S3 endpoint. My S3 endpoint was cluster-internal.
The Fix: Disable Redirects
Added one line to the registry config:
storage:
redirect:
disable: true # Registry proxies all blob data
s3:
# ... rest of config
This makes the registry proxy all blob downloads instead of redirecting clients to S3. Uses more bandwidth on the registry pod, but for a homelab with minimal usage, it's fine.
Applied the change:
$ kubectl apply -f config.yaml
$ kubectl rollout restart deployment -n docker-registry docker-registry
Tested again:
$ skopeo copy docker://registry.goldentooth.net/test/alpine:v1 docker-daemon:test:latest
Getting image source signatures
Copying blob sha256:5096682701dd...
Copying config sha256:171e65262c80...
Writing manifest to image destination
Success. Skopeo can now both push and pull.
Litmus: ARM64, MongoDB Hell, and Learning to Love Heterogeneous Clusters
I decided it was time to install Litmus in the cluster. Why? Because things breaking (and the learning that follows) is the entire point of this homelab. It's not homeprod, after all.
Litmus provides this capability with a nice UI (ChaosCenter) for designing chaos experiments and tracking their results. So I set out to install it.
What followed was a multi-hour journey through ARM64 CPU microarchitecture incompatibilities, Bitnami image repository changes, heterogeneous cluster workload placement strategies, and Kubernetes node taints. By the end, I had learned way more about MongoDB's ARM support (or lack thereof) than I ever wanted to know.
What is Litmus?
Litmus is a CNCF chaos engineering platform for Kubernetes. It has two main deployment modes:
- Operator-only mode: Just the chaos-operator and CRDs for defining chaos experiments. No UI, no persistence—just raw experiment execution via YAML.
- ChaosCenter mode: Full deployment with a web UI, MongoDB for storing experiment history, and a GraphQL API server for managing experiments through a nice interface.
The ChaosCenter includes:
- Frontend: React web UI for designing and visualizing chaos experiments
- GraphQL Server: Backend API for experiment orchestration
- Auth Server: Authentication/authorization service
- MongoDB: Persistence layer for experiment definitions, execution history, and user data
- Chaos Operator: The actual executor that runs chaos experiments
I wanted the full ChaosCenter experience because (1) I'm here to learn new tools, and (2) a UI makes it easier to explore what chaos experiments are available and visualize their impact.
Initial Deployment
I created the standard Flux resources in gitops/infrastructure/litmus/:
# namespace.yaml
---
apiVersion: v1
kind: Namespace
metadata:
name: litmus
labels:
pod-security.kubernetes.io/enforce: baseline
pod-security.kubernetes.io/audit: baseline
pod-security.kubernetes.io/warn: baseline
# release.yaml - initial attempt
---
apiVersion: source.toolkit.fluxcd.io/v1
kind: HelmRepository
metadata:
name: litmuschaos
namespace: flux-system
spec:
interval: 24h
url: https://litmuschaos.github.io/litmus-helm/
---
apiVersion: helm.toolkit.fluxcd.io/v2beta1
kind: HelmRelease
metadata:
name: litmus
namespace: litmus
spec:
interval: 30m
chart:
spec:
chart: litmus
version: ">=3.20.0 <4.0.0"
sourceRef:
kind: HelmRepository
name: litmuschaos
namespace: flux-system
interval: 12h
values:
portal:
frontend:
service:
type: LoadBalancer
annotations:
metallb.io/address-pool: default
external-dns.alpha.kubernetes.io/hostname: chaos-center.goldentooth.net
external-dns.alpha.kubernetes.io/ttl: "60"
mongodb:
enabled: true
persistence:
enabled: true
size: 5Gi
This looked straightforward. MongoDB enabled, persistence configured, LoadBalancer service with external-dns annotation. What could go wrong?
Everything. Everything could go wrong.
Problem 1: MongoDB Hates ARM64 (Or At Least ARM64 Hates MongoDB)
The MongoDB pod immediately started crashing with this delightful message:
WARNING: MongoDB requires ARMv8.2-A or higher, and your current system does not appear to implement any of the common features for that!
Illegal instruction (core dumped)
Okay. My Raspberry Pi 4 nodes have Cortex-A72 cores, which are ARMv8.0-A. They're missing the atomic instructions and other features that MongoDB 5.0+ depends on.
Attempt 1: Try MongoDB 4.4
Fine, I thought. I'll just use an older MongoDB version that doesn't have these requirements:
mongodb:
image:
tag: "4.4"
Nope. The image pulled was 4.4.19 or later, and MongoDB 4.4.19+ ALSO requires ARMv8.2-A. Same illegal instruction errors.
I needed MongoDB 4.4.18 or earlier specifically. But wait, there's more bad news...
Attempt 2: Official Mongo Image Structure
I tried using the official mongo:4.4.18 image:
mongodb:
image:
registry: docker.io
repository: mongo
tag: "4.4.18"
This pulled fine, but then the pod failed with:
Attempted to create a lock file on a read-only directory: /data/db
Why? Because the official mongo image uses /data/db for data paths, while the Bitnami MongoDB chart expects /bitnami/mongodb paths. The volume mounts were all wrong. The official image and Bitnami chart are structurally incompatible.
Attempt 3: Community ARM64 Bitnami-Compatible Image
I found a community-maintained ARM64 MongoDB image that's Bitnami-compatible: dlavrenuek/bitnami-mongodb-arm:7.0
mongodb:
image:
registry: docker.io
repository: dlavrenuek/bitnami-mongodb-arm
tag: "7.0"
This looked promising! The image pulled successfully, the paths matched, and...
WARNING: MongoDB requires ARMv8.2-A or higher
Illegal instruction (core dumped)
FML. This was MongoDB 7.0, so of course it still had the ARMv8.2-A requirement. Same problem, just with more steps.
Attempt 4: Bitnami Image Repository Changes (August 2025)
At this point I tried to go back to official Bitnami images with specific version tags:
mongodb:
image:
registry: docker.io
repository: bitnami/mongodb
tag: "7.0"
This failed with ImagePullBackOff and "not found" errors. After some investigation, I discovered that Bitnami changed their free tier in August 2025. They now only offer latest tags for free users—version-specific tags like 7.0, 8.0, etc. require their paid legacy repository.
Great. Just great.
So I was stuck:
- ARM64 MongoDB images need ARMv8.2-A (which my Pi 4s don't have)
- Official mongo images are incompatible with Bitnami charts
- Bitnami free tier doesn't offer version pinning
- Community images still run into ARMv8.2-A issues
The Plot Twist: Raspberry Pi 5 to the Rescue
Just as I was about to resign myself to running MongoDB on Velaryon (the x86 GPU node), I Googled, and much to my surprise, Pi 5s support ARMv8.2-A.
My cluster has 4 Pi 5 nodes (manderly, norcross, oakheart, payne) that can run MongoDB and its tools just fine. No need to waste the x86 node on this!
CPU Architecture Labels
To properly select Pi 5 nodes (and avoid Pi 4 nodes), I added CPU architecture labels to all nodes in cluster/talconfig.yaml:
- Pi 4 nodes (12 nodes):
cpu.arch: armv8.0-a - Pi 5 nodes (4 nodes):
cpu.arch: armv8.2-a - Velaryon (x86):
cpu.arch: x86-64
This makes workload requirements explicit and self-documenting. When you see nodeSelector: cpu.arch: armv8.2-a, you immediately understand why - it needs ARMv8.2-A instructions that older ARM cores don't have.
After regenerating and applying the Talos configs, I could use this label to pin MongoDB and the Litmus application pods to Pi 5 nodes.
Problem 2: Replica Set vs Standalone
I initially deployed MongoDB in standalone mode, but discovered that Litmus init containers are hardcoded to check rs.status() - a replica set status command. On standalone MongoDB, this command fails because there's no replica set configured.
The init container script:
until [[ $(mongosh -u ${DB_USER} -p ${DB_PASSWORD} ${DB_SERVER} --eval 'rs.status()' | grep 'ok' | wc -l) -eq 1 ]]; do
sleep 5;
echo 'Waiting for the MongoDB to be ready...';
done
The solution: use a single-member replica set instead of standalone. A replica set with one member is still a valid replica set (so rs.status() works), but without the overhead of replication.
Problem 3: The Helm Chart Template Mystery
Even after switching to a single-member replica set and adding cpu.arch labels, the pods still weren't scheduling on Pi 5 nodes. I had configured nodeSelectors in the values:
portal:
server:
authServer:
nodeSelector:
cpu.arch: armv8.2-a # ❌ Not used by templates!
graphqlServer:
nodeSelector:
cpu.arch: armv8.2-a # ❌ Not used by templates!
The HelmRelease showed these values, but the Deployment didn't have nodeSelector at all. Why?
I checked the Helm chart templates and found:
{{- with .Values.portal.server.nodeSelector }}
The template looks for portal.server.nodeSelector at the parent level, not at the individual authServer/graphqlServer sublevels!
This is a discrepancy between the chart's values.yaml (which defines child-level nodeSelectors) and the templates (which only use the parent-level one). The values suggest per-component control, but the templates don't implement it.
The Final Working Configuration
After all that, here's what actually works in gitops/infrastructure/litmus/release.yaml:
portal:
server:
# NodeSelector at PARENT level (not child level!)
nodeSelector:
cpu.arch: armv8.2-a
graphqlServer:
resources: { ... }
authServer:
resources: { ... }
mongodb:
enabled: true
architecture: replicaset # Not standalone!
replicaCount: 1 # Single-member replica set
arbiter:
enabled: false # No arbiter needed for single member
nodeSelector:
cpu.arch: armv8.2-a # Pin to Pi 5 nodes
image:
registry: docker.io
repository: bitnami/mongodb
tag: "latest"
persistence:
enabled: true
size: 5Gi
storageClass: "local-path"
resources:
requests:
memory: "512Mi"
cpu: "250m"
limits:
memory: "1Gi"
cpu: "500m"
MongoDB pod started successfully on a Pi 5 node! Finally!
NAME READY STATUS RESTARTS AGE
litmus-mongodb-0 1/1 Running 0 2m NODE: norcross (Pi 5)
Problem 4: Local Path Provisioner and PodSecurity
The MongoDB PVC tried to provision on a Pi 5 node (good!), but failed:
failed to provision volume: pods "helper-pod-create-pvc-..." is forbidden:
violates PodSecurity "baseline:latest": hostPath volumes
The local-path-provisioner creates helper pods in the target namespace to set up volumes. Those helper pods need hostPath mounts, which violate baseline PodSecurity.
The fix: change the litmus namespace to privileged PodSecurity. This makes sense anyway - chaos experiments will likely need elevated privileges to inject failures.
After this change, the PVC provisioned successfully and MongoDB started on a Pi 5 node.
Loki and Alloy: Log Aggregation for the Bramble
I've had Prometheus and Grafana running for a while now, happily scraping metrics from everything. But metrics only tell part of the story. When something breaks, I want to see the actual log output – not just a spike on a graph.
Time to add centralized logging. The obvious choice in the Grafana ecosystem: Loki.
Why Loki Instead of ELK?
Elasticsearch is powerful but expensive. It indexes every word in every log line, which means:
- Massive CPU to build indexes
- Massive storage (indexes can be 2-3x the raw log size)
- Massive memory to keep queries fast
For a Raspberry Pi cluster? That would melt my little bramble.
Loki takes a radically different approach: index nothing. Well, almost nothing. Loki only indexes labels (key-value pairs like namespace=monitoring, pod=grafana), not log content. The actual log text just gets compressed and stored.
When you query, Loki:
- Uses labels to narrow down which "chunks" of logs to look at (fast label lookups)
- Decompresses and greps through those chunks
The tradeoff: searching for specific text across huge time ranges is slower. But filtering by labels is instant, and for structured logging that's usually what you want anyway.
The other big advantage: Loki uses the same label model as Prometheus. The labels you use to identify services in Prometheus (app=grafana, namespace=monitoring) work identically in Loki. Same queries, same mental model, same Grafana dashboards can show metrics and logs side by side.
Architecture Decisions
Loki can run in several modes:
- Monolithic – everything in one binary
- Simple Scalable – read and write paths separated
- Microservices – every component separate
For a homelab? Monolithic. I don't need to be a Loki SME, I just need logs.
For storage, I initially considered using SeaweedFS S3 (already running), but decided on local filesystem instead. If the Loki pod dies, I lose recent logs – but for debugging current issues, I don't need months of historical data. Simple wins.
The Log Shipper: Alloy
Loki doesn't collect logs itself – it just receives them. You need a shipper. The old-school choice was Promtail, but Grafana replaced it with Alloy – a unified observability agent that can collect logs, metrics, and traces.
Alloy uses a pipeline configuration language called River:
discovery.kubernetes "pods" { role = "pod" }
loki.source.kubernetes "pods" {
targets = discovery.kubernetes.pods.targets
forward_to = [loki.write.default.receiver]
}
loki.write "default" {
endpoint { url = "http://loki:3100/loki/api/v1/push" }
}
Components connect together like building blocks. Discover pods → collect their logs → ship to Loki.
The Deployment
Created the GitOps structure:
gitops/infrastructure/
├── loki/
│ ├── kustomization.yaml
│ ├── repository.yaml # HelmRepository for Grafana charts
│ ├── release.yaml # Loki HelmRelease
│ └── datasource.yaml # Grafana datasource ConfigMap
└── alloy/
├── kustomization.yaml
└── release.yaml # Alloy HelmRelease
The Grafana datasource uses a neat trick: Grafana's sidecar watches for ConfigMaps with the label grafana_datasource: "1" and auto-provisions them. No need to modify the prometheus-stack values.
The Problems: A Debugging Odyssey
Problem 1: Chart Values Structure Changed in 6.x
Deployed Loki. Got way more pods than expected:
monitoring-loki-0 2/2 Running
loki-canary-xxxxx 1/1 Running (x17!)
monitoring-loki-chunks-cache-0 2/2 Running
monitoring-loki-results-cache-0 2/2 Running
I had disabled the canary and caches in my values:
monitoring:
lokiCanary:
enabled: false
But the Loki chart 6.x moved lokiCanary to the root level, and enabled memcached caches by default. My config was under the deprecated monitoring section, so it was ignored.
The fix:
# Root level, not under monitoring!
lokiCanary:
enabled: false
chunksCache:
enabled: false
resultsCache:
enabled: false
Problem 2: The File Path Construction Nightmare
My initial Alloy config used loki.source.file to read log files from disk. This requires building the correct path to each container's logs:
/var/log/pods/{namespace}_{pod-name}_{pod-uid}/{container}/*.log
Four pieces of information, concatenated with underscores and slashes. I tried using Prometheus-style relabeling:
rule {
source_labels = ["__meta_kubernetes_namespace", "__meta_kubernetes_pod_name",
"__meta_kubernetes_pod_uid", "__meta_kubernetes_pod_container_name"]
separator = "/"
regex = "(.*)/(.*)/(.*)/(.*)"
replacement = "/var/log/pods/$1_$2_$3/$4/*.log"
}
First attempt: paths came out as /var/log/pods/*abc123/container/*.log. The asterisk was being interpreted literally.
Second attempt: paths missing namespace and pod name. Greedy regex (.*) was eating too much.
Third attempt: used [^/]* instead of .* to match "anything except slashes":
regex = "([^/]*)/([^/]*)/([^/]*)/([^/]*)"
Paths finally looked correct! But still no logs flowing.
Problem 3: PodSecurity Strikes Again
Error creating: pods "monitoring-alloy-xxx" is forbidden:
violates PodSecurity "baseline:latest": hostPath volumes (volume "varlog")
The monitoring namespace has PodSecurity set to baseline, which blocks hostPath volume mounts. Alloy needed to mount /var/log from the host to read log files.
Options:
- Label the namespace as
privileged(YOLO) - Use the Kubernetes API instead of file access
Option 1 would work but feels wrong – the whole monitoring namespace would lose security restrictions just for log collection.
The Solution: Kubernetes API Method
Turns out Alloy has loki.source.kubernetes which streams logs directly from the Kubernetes API instead of reading files. No hostPath needed, works with any PodSecurity policy.
discovery.kubernetes "pods" {
role = "pod"
}
discovery.relabel "pods" {
targets = discovery.kubernetes.pods.targets
// ... label extraction rules ...
}
loki.source.kubernetes "pods" {
targets = discovery.relabel.pods.output
forward_to = [loki.process.pods.receiver]
}
Bonus: no need for a DaemonSet! Since we're reading from the API (not local files), a Deployment with 2 replicas + clustering works fine. Fewer pods, simpler setup.
Problem 4: Service Name Mismatch
Logs still not flowing. Checked Alloy logs:
error="Post \"http://loki.monitoring.svc.cluster.local:3100/...\":
lookup loki.monitoring.svc.cluster.local: no such host"
Checked the actual service:
$ kubectl -n monitoring get svc | grep loki
monitoring-loki ClusterIP 10.106.228.167 <none> 3100/TCP
The Helm chart names the service {release-name}-{chart-name}. My release was loki in namespace monitoring, so Helm created monitoring-loki. Not loki.
Fixed the Alloy config and Grafana datasource to use monitoring-loki.monitoring.svc.cluster.local.
The Final Setup
┌─────────────────┐ ┌──────────────┐ ┌─────────────┐
│ Kubernetes │ │ Alloy │ │ Loki │
│ API │────▶│ (2 replicas │────▶│ (monolithic)│
│ (pod logs) │ │ clustered) │ │ │
└─────────────────┘ └──────────────┘ └──────┬──────┘
│
▼
┌─────────────┐
│ Grafana │
│ (Explore) │
└─────────────┘
Verified logs are flowing:
$ curl -s "http://localhost:3100/loki/api/v1/labels"
{"status":"success","data":["app","container","instance","job","namespace","node","pod","service_name"]}
In Grafana Explore, {job="kubernetes-pods"} returns logs from across the cluster.
Prometheus Blackbox Exporter 2
Way back in entry 053, I set up Blackbox Exporter via Ansible on bare metal. That was a different era – before Talos, before FluxCD, before I nuked everything and rebuilt it properly. Time to bring synthetic monitoring back, but this time the Kubernetes way.
Why Blackbox Monitoring?
I've got whitebox monitoring covered: Prometheus scrapes node-exporter, kube-state-metrics, application /metrics endpoints. I can see if pods are running, if CPU is spiking, if memory is tight.
But none of that tells me: can I actually reach my websites?
Enter blackbox monitoring. Instead of asking "is the service running?", we ask "does it work from the outside?" – like an actual user would. Blackbox Exporter makes HTTP requests to URLs and reports whether they succeeded, how long they took, what status code came back.
The Targets: External GitHub Pages Sites
This isn't about monitoring cluster services (though I could). I want to monitor two external sites:
https://goldentooth.net/– the main sitehttps://clog.goldentooth.net/– this very journal you're reading
Both are hosted on GitHub Pages. I don't control their infrastructure. GitHub handles the TLS certs, the CDN, all of it. But I still want to know when they're down – partly for awareness, partly so I can feel smug when GitHub has issues instead of wondering if I broke something.
The GitOps Structure
Created a new infrastructure component:
gitops/infrastructure/prometheus-blackbox-exporter/
├── kustomization.yaml
├── release.yaml # HelmRelease
├── probes.yaml # Probe CRD (what to monitor)
└── alerts.yaml # PrometheusRule (when to alert)
The HelmRelease
Pretty minimal. The key piece is the module configuration – this defines how to probe:
config:
modules:
http_2xx:
prober: http
timeout: 10s
http:
valid_http_versions: ["HTTP/1.1", "HTTP/2.0"]
valid_status_codes: [200, 201, 202, 203, 204, 301, 302]
method: GET
follow_redirects: true
preferred_ip_protocol: ip4
The http_2xx module says: make an HTTP GET, follow redirects, accept any 2xx or redirect status as success. Simple.
The Probe CRD
This is where Prometheus Operator shines. Instead of manually configuring Prometheus with relabeling rules, I just declare what I want:
apiVersion: monitoring.coreos.com/v1
kind: Probe
metadata:
name: external-websites
namespace: monitoring
spec:
interval: 60s
module: http_2xx
prober:
url: prometheus-blackbox-exporter.monitoring.svc.cluster.local:9115
targets:
staticConfig:
static:
- https://goldentooth.net/
- https://clog.goldentooth.net/
labels:
environment: external
probe_type: website
Every 60 seconds, Prometheus will ask Blackbox to probe both URLs. The Operator handles all the plumbing.
Alerting Rules
Since these are GitHub Pages sites, I don't need certificate expiry warnings (GitHub handles that). Just two alerts:
- alert: WebsiteDown
expr: probe_success == 0
for: 5m
labels:
severity: critical
annotations:
summary: "Website {{ $labels.instance }} is down"
- alert: WebsiteSlow
expr: probe_duration_seconds > 10
for: 5m
labels:
severity: warning
annotations:
summary: "Website {{ $labels.instance }} is slow"
The for: 5m clause is the Prometheus equivalent of "X failures before alerting" – with a 60-second probe interval, 5 minutes means roughly 5 consecutive failures. No flapping alerts from transient network blips.
Also added a meta-alert for when the blackbox exporter itself is broken:
- alert: BlackboxProbeFailed
expr: up{job="probe"} == 0
for: 5m
Because what good is monitoring if you don't monitor your monitoring?
Bonus: Exposing Prometheus UI
While I was in there, I realized I'd never exposed the Prometheus UI itself. Grafana was accessible via LoadBalancer, but Prometheus wasn't. Added the service config:
prometheus:
service:
type: LoadBalancer
annotations:
metallb.io/address-pool: default
external-dns.alpha.kubernetes.io/hostname: prometheus.goldentooth.net
Now I can poke around at prometheus.goldentooth.net to see raw metrics, check which alerts are registered, debug scrape targets. Much nicer than port-forwarding every time.
Verification
After Flux reconciled everything:
$ kubectl get pods -n monitoring | grep blackbox
prometheus-blackbox-exporter-xxx 1/1 Running
$ kubectl get probes -n monitoring
NAME AGE
external-websites 5m
In Prometheus UI → Status → Rules, the blackbox-exporter group shows up with all three alerts.
Query probe_success and both URLs show 1. Query probe_duration_seconds and GitHub Pages responds in ~200ms. Not bad.
OpenTelemetry and Tempo: Distributed Tracing for the Bramble
I have metrics (Prometheus) and logs (Loki). But there's a third pillar of observability I've been ignoring: traces.
When a request flows through multiple services, metrics tell me something is slow, and logs tell me something errored. But neither tells me the full story of what happened to that specific request as it bounced between services. That's what distributed tracing does.
Time to complete the observability trifecta.
The OpenTelemetry Landscape
OpenTelemetry (OTel) is a CNCF project that standardizes how telemetry data (traces, metrics, logs) is collected and transmitted. Before OTel, every vendor had their own instrumentation libraries and protocols – Jaeger, Zipkin, Datadog, New Relic, all incompatible. OTel unifies this mess.
The key components:
- OTLP (OpenTelemetry Protocol): The wire format for telemetry. Can run over gRPC (port 4317) or HTTP (port 4318).
- SDKs: Libraries you add to your code to generate telemetry
- Collector: A pipeline for receiving, processing, and exporting telemetry
- Backends: Where telemetry gets stored and queried (Jaeger, Tempo, Datadog, etc.)
The architecture follows a pipeline model:
┌────────────┐ ┌────────────┐ ┌────────────┐
│ Receivers │ -> │ Processors │ -> │ Exporters │
└────────────┘ └────────────┘ └────────────┘
Receivers ingest data (OTLP, Jaeger, Zipkin formats). Processors transform it (batching, filtering, sampling). Exporters send it to backends.
The Missing Piece: Tempo
I already have Alloy running as my telemetry agent – it's collecting logs and shipping them to Loki. The beautiful thing about Alloy is it speaks OTel natively. It can be an OTLP receiver and exporter with a few lines of config.
But where do traces go? Loki stores logs, Prometheus stores metrics. I need a trace backend.
Enter Grafana Tempo. It's to traces what Loki is to logs:
- Accepts OTLP (and Jaeger, Zipkin) for ingestion
- Stores traces efficiently in a columnar format
- Queryable via TraceQL (similar to LogQL)
- Native Grafana integration
The full stack becomes LGTP: Loki, Grafana, Tempo, Prometheus.
Protocol Decision: gRPC vs HTTP
OTLP supports two transports:
gRPC (port 4317):
- Binary protocol, more efficient
- HTTP/2 streaming
- ~30-40% better throughput
HTTP (port 4318):
- JSON payloads, human-readable
- Works through any proxy
- Debug with curl
For a learning cluster, HTTP wins. I can test the endpoint with:
curl -X POST http://alloy:4318/v1/traces \
-H "Content-Type: application/json" \
-d '{"resourceSpans": [...]}'
Try doing that with gRPC. You'd need grpcurl or similar tooling.
The Implementation
Tempo Deployment
Created a new directory gitops/infrastructure/tempo/ following the same pattern as Loki:
# release.yaml
apiVersion: helm.toolkit.fluxcd.io/v2beta1
kind: HelmRelease
metadata:
name: tempo
namespace: flux-system
spec:
chart:
spec:
chart: tempo
version: '>=1.10.0 <2.0.0'
sourceRef:
kind: HelmRepository
name: grafana
namespace: flux-system
values:
tempo:
storage:
trace:
backend: local
local:
path: /var/tempo/traces
retention: 72h
receivers:
otlp:
protocols:
grpc:
endpoint: "0.0.0.0:4317"
http:
endpoint: "0.0.0.0:4318"
persistence:
enabled: true
storageClassName: local-path
size: 10Gi
Using local filesystem storage because traces are typically shorter-lived than logs – 72 hours is plenty for debugging recent issues.
Alloy OTLP Pipeline
Added a second pipeline to Alloy alongside the existing log collection:
// OTLP Receiver - accepts traces from instrumented applications
otelcol.receiver.otlp "default" {
grpc {
endpoint = "0.0.0.0:4317"
}
http {
endpoint = "0.0.0.0:4318"
}
output {
traces = [otelcol.processor.batch.default.input]
}
}
// Batch Processor - groups traces before sending
otelcol.processor.batch "default" {
send_batch_size = 8192
timeout = "200ms"
output {
traces = [otelcol.exporter.otlp.tempo.input]
}
}
// OTLP Exporter - sends to Tempo
otelcol.exporter.otlp "tempo" {
client {
endpoint = "monitoring-tempo.monitoring.svc.cluster.local:4317"
tls {
insecure = true
}
}
}
The batch processor is important – instead of sending each span immediately, it groups them and sends batches every 200ms or 8KB, whichever comes first. This dramatically reduces network overhead.
Also had to expose the OTLP ports on Alloy's service so applications can reach it:
alloy:
extraPorts:
- name: otlp-grpc
port: 4317
targetPort: 4317
protocol: TCP
- name: otlp-http
port: 4318
targetPort: 4318
protocol: TCP
Grafana Datasource with Correlations
The datasource config is where things get interesting:
datasources:
- name: Tempo
type: tempo
uid: tempo
url: http://monitoring-tempo.monitoring.svc.cluster.local:3200
jsonData:
tracesToLogsV2:
datasourceUid: loki
tags:
- key: "namespace"
value: "namespace"
- key: "pod"
value: "pod"
tracesToMetrics:
datasourceUid: prometheus
tags:
- key: "service.name"
value: "service"
serviceMap:
datasourceUid: prometheus
This enables correlations between traces and other signals:
tracesToLogsV2: Click a trace span, see logs from that pod during that time windowtracesToMetrics: Jump from a trace to the service's Prometheus metricsserviceMap: Visualize service dependencies from trace data
The tag mappings tell Grafana how to translate between Tempo's attributes and Loki/Prometheus labels. When viewing a span with namespace=monitoring, clicking "logs" builds the query {namespace="monitoring"}.
RED Metrics Generation
Enabled one of Tempo's killer features – automatic metrics generation from traces:
metricsGenerator:
enabled: true
remoteWriteUrl: "http://monitoring-kube-prometheus-prometheus.monitoring.svc.cluster.local:9090/api/v1/write"
processors:
- service-graphs
- span-metrics
This creates RED metrics (Rate, Errors, Duration) from trace data and writes them to Prometheus. The beauty: your dashboard showing "p99 latency = 250ms" uses the exact same data as the trace you'll click to investigate why it's 250ms.
Also means you can sample traces (keep 10% to save storage) while still having 100% accurate metrics.
The Bug: YAML Duplicate Keys
First deployment failed with:
yaml: unmarshal errors: line 229: mapping key "alloy" already defined
I had defined alloy: twice in the Helm values – once for the configMap content, once for extraPorts:
values:
alloy:
configMap:
content: |
// ... river config ...
# ... other stuff ...
alloy: # OOPS - duplicate key!
extraPorts:
- name: otlp-grpc
...
YAML parsers either error (good) or silently use only one of the values (bad). Fixed by merging extraPorts into the first alloy: block.
The Final Architecture
┌─────────────┐
│ Grafana │ <- Query all three!
└──────┬──────┘
┌───────────────┼─────────────┐
v v v
┌──────────┐ ┌──────────┐ ┌──────────┐
│Prometheus│ │ Loki │ │ Tempo │
│ (metrics)│ │ (logs) │ │ (traces) │
└──────────┘ └────^─────┘ └────^─────┘
│ │
┌────┴───────────────┴────┐
│ Alloy │
│ (logs pipeline) │
│ (traces pipeline) │
└────────────^────────────┘
│ OTLP
┌────────────┴────────────┐
│ Instrumented Apps │
└─────────────────────────┘
Applications send traces via OTLP to Alloy, which batches them and forwards to Tempo. Grafana can query Tempo with TraceQL and correlate with logs and metrics.
Testing
Port-forward to Alloy and send a test trace:
kubectl port-forward -n monitoring svc/monitoring-alloy 4318:4318
curl -X POST http://localhost:4318/v1/traces \
-H "Content-Type: application/json" \
-d '{
"resourceSpans": [{
"resource": {"attributes": [{"key": "service.name", "value": {"stringValue": "test-service"}}]},
"scopeSpans": [{
"spans": [{
"traceId": "'$(openssl rand -hex 16)'",
"spanId": "'$(openssl rand -hex 8)'",
"name": "test-span",
"kind": 1,
"startTimeUnixNano": "'$(date +%s)000000000'",
"endTimeUnixNano": "'$(( $(date +%s) + 1 ))000000000'"
}]
}]
}]
}'
Then in Grafana: Explore -> Tempo -> Search for service.name = "test-service".
Network Booting the Bramble
SD cards are the single point of failure in a Raspberry Pi cluster. They wear out, they corrupt, and when one goes bad you're physically pulling it out, reflashing it at your desk, and walking it back to the rack like some kind of IT serf in the year 2026. I know this because Bettley died exactly this way — XFS corruption on the SD card, node goes NotReady, etcd starts complaining, and I'm standing there with a USB card reader wondering why I signed up for this.
So: network boot. The idea is simple. The Pis boot from the network, pull their OS image from a TFTP server, install to the local SD card, and join the cluster. If the SD card dies, the node just PXE boots again on the next power cycle and reinstalls itself. No human intervention, no pilgrimage to the rack.
The reality of getting there was considerably less simple.
The Architecture
The boot infrastructure runs on Velaryon, the x86 GPU node (10.4.0.30), because it's always on and doesn't need to bootstrap itself:
- dnsmasq — Proxy DHCP (doesn't replace the existing DHCP server) + TFTP server. Tells PXE clients where to find boot files.
- Matchbox — HTTP configuration server from CoreOS/Poseidon. Serves per-node Talos machine configs based on MAC address.
- TFTP tree — VideoCore firmware, UEFI firmware, GRUB, kernel, initramfs, and per-node directories.
Both dnsmasq and Matchbox run with hostNetwork: true on Velaryon. This is important — nodes in PXE boot (maintenance mode) can't reach MetalLB VIPs because BGP routes don't exist before Kubernetes is running. They need a real IP on the real network.
The full boot chain, which took an absurd amount of trial and error to arrive at:
VideoCore (ROM) → start4.elf → RPI_EFI.fd (EDK2 UEFI) → PXE DHCP →
pxelinux.0 (GRUB EFI) → grub.cfg → vmlinuz + initramfs → Talos →
fetch config from Matchbox → install to SD card → reboot → join cluster
EEPROM: Teaching Pis to Look at the Network
Raspberry Pi 4B nodes have a boot EEPROM that controls boot order. By default it's BOOT_ORDER=0xf41 — SD card first, USB second, retry. I needed to add network boot to the sequence.
I wrote a Kubernetes Job that runs rpi-eeprom-config on each node via Talos's etcd mount:
BOOT_ORDER=0xf21 # SD card (1) → network (2) → retry (f)
SD-first means nodes that already have a working Talos installation just boot from the SD card normally. Network is the fallback — only kicks in if the SD card is dead or empty. This rolled out to all 12 Pi 4B nodes without incident.
Attempt 1: U-Boot PXE (Failure)
The Talos factory SBC image ships with U-Boot as the bootloader. My first approach was obvious: use U-Boot's PXE boot support via pxe_get and pxe_boot.
I set up TFTP, wrote PXE configs in pxelinux.cfg/ with MAC-based filenames, pointed them at the kernel and initramfs. U-Boot fetched the PXE config, parsed it, found the linux and initrd directives...
...and then tried to bootefi the kernel.
That's the problem with U-Boot's PXE implementation: the label_boot() function in U-Boot's PXE code only calls bootefi. If the kernel is a raw Image (not an EFI stub), it just fails. If you want booti, you need a boot script (boot.scr). But boot scripts don't support per-MAC configuration the way PXE configs do, so you lose the ability to serve different configs to different nodes.
I tried about ten different approaches with U-Boot:
- Boot scripts with
tftpbootcommands - Placing
boot.scr.uimgin the TFTP root - Loading the kernel at different addresses to avoid overlap with initramfs
- Using
bootiwith explicit FDT address
Every single one either hanged, failed to load, or had some other creative way of not working. U-Boot's network boot support on ARM64 is best described as "technically present."
Attempt 2: EDK2 UEFI (Success, Eventually)
I pivoted to EDK2 UEFI firmware from the pftf/RPi4 project. This replaces U-Boot entirely with a full UEFI implementation that provides proper PXE network boot — the kind that x86 servers have had since the '90s.
The firmware (RPI_EFI.fd) gets loaded as an ARM stub in config.txt:
arm_64bit=1
arm_boost=1
armstub=RPI_EFI.fd
disable_commandline_tags=1
device_tree_address=0x3e0000
device_tree_end=0x400000
dtoverlay=miniuart-bt
dtoverlay=upstream-pi4
VideoCore loads start4.elf, which loads RPI_EFI.fd as the ARM stub, which gives you a full UEFI environment. From there, PXE boot works like any normal UEFI system: DHCP Option 67 points to a Network Boot Program (NBP), the firmware downloads and executes it.
The GRUB Problem
The NBP is GRUB, built for arm64-efi with PXE modules. But there's a catch: the dnsmasq DaemonSet runs on Velaryon, which is x86. The init container that sets up the TFTP tree is an Alpine container on an x86 node. grub-mkimage -O arm64-efi doesn't produce a working binary when run on x86 — you get a 0-byte output and a dead stare from the abyss.
The fix: build the GRUB binary on an arm64 node, then ship it as a ConfigMap:
# On an arm64 builder pod:
grub-mkimage -O arm64-efi -p "(tftp)" \
--config=<(echo 'configfile (tftp)/grub.cfg') \
efinet net tftp linux normal configfile echo test search \
gzio part_gpt fat fdt
This produces a 628K binary with an embedded config that tells GRUB to load grub.cfg from TFTP. The binary is stored in a ConfigMap (grub-arm64-efi-configmap.yaml, 857K thanks to base64 encoding) and mounted into the init container.
GRUB Config
GRUB serves a single menu entry that boots Talos. The key trick is ${net_default_mac} — GRUB exposes this variable when PXE-booted, so Matchbox gets the MAC address and can serve the right node-specific config:
menuentry "Talos Linux" {
linux /vmlinuz talos.platform=metal talos.halt_if_installed \
console=tty0 console=ttyAMA0,115200 \
talos.config=http://10.4.0.30:8080/generic?mac=${net_default_mac} \
init_on_alloc=1 slab_nomerge pti=on consoleblank=0 ...
initrd /initramfs-arm64.xz
}
talos.halt_if_installed is important — it means if Talos is already installed on the SD card, the PXE-booted kernel detects this and kexecs into the installed version instead of reinstalling. Net boot becomes a fallback, not a forced wipe.
The SD Card Mystery
With UEFI PXE working and Talos booting from the network, I hit the next wall: Talos tried to install to /dev/mmcblk0 and got "no such file or directory." The SD card was invisible.
This is because EDK2 UEFI defaults to ACPI mode. In ACPI mode, it generates ACPI tables for the hardware it knows about. The BCM2711's SD/SDHOST controller is not one of those things. The device tree that VideoCore prepares — the one that describes ALL the hardware, including the SD controller — gets thrown away.
I tried several approaches:
- GRUB
devicetreecommand with UEFI DTB: ADMA timeout errors. The UEFI-bundled DTB doesn't have the right SD controller configuration. - GRUB
devicetreewith runtime DTB from a working node: Display garbled. Hangs. sdhci.debug_quirks=0x20000000: Still ADMA errors.
None of these worked because the fundamental problem was that the UEFI firmware itself was discarding the VideoCore device tree before the kernel ever saw it.
The NVRAM Patch
The solution: patch the UEFI firmware to use DeviceTree mode instead of ACPI mode. EDK2's ConfigDxe driver has a SystemTableMode setting stored in NVRAM:
| Value | Mode |
|---|---|
| 0 | ACPI (default) |
| 1 | Both |
| 2 | DeviceTree |
In DT mode, the UEFI firmware passes the VideoCore-prepared device tree through to the OS via the EFI system table. The kernel gets a proper device tree with the SD controller node, the driver loads, /dev/mmcblk0 appears, and Talos can install.
I wrote a Python script to analyze the firmware binary, find the NVRAM variable store, and write the correct variable entry. Then I translated the patch into shell for the init container. The variable store uses gEfiAuthenticatedVariableGuid (the authenticated format), which adds 28 bytes of header fields compared to the simple format:
StartId (2) + State (1) + Reserved (1) + Attributes (4) +
MonotonicCount (8) + TimeStamp (16) + PubKeyIndex (4) +
NameSize (4) + DataSize (4) + GUID (16) +
Name ("SystemTableMode" UCS-2, 32 bytes) +
Value (UINT32 = 2)
Total: 96 bytes written at offset 0x3B0064 in the firmware image. Getting this wrong means the firmware boots with default settings (ACPI mode) and you get to enjoy the "no SD card" experience again.
First Boot: Dalt
With the patched UEFI firmware deployed, I PXE-booted Dalt (serial d32a9346, 10.4.0.13) as the test node. The sequence:
- VideoCore loads firmware from TFTP (
/d32a9346/start4.elf) config.txttells it to loadRPI_EFI.fdas ARM stub- EDK2 UEFI initializes, DT mode passes device tree through
- PXE DHCP gets pxelinux.0 address from dnsmasq
- GRUB loads, fetches grub.cfg from TFTP
- GRUB boots vmlinuz + initramfs-arm64.xz
- Talos boots, fetches machine config from Matchbox at
http://10.4.0.30:8080/generic?mac=d8:3a:dd:8a:7e:9a - Talos installs to
/dev/mmcblk0(256GB SD card) - Talos kexecs into the installed system, prints "Bye!", power cycles
- Node boots from SD card, joins the cluster
$ kubectl get node dalt
NAME STATUS ROLES AGE VERSION
dalt Ready <none> 2m v1.34.0
I may have made an undignified sound.
The first boot had one hiccup: kubelet showed exec format error because there was stale containerd state from a previous Talos installation on the SD card. A talosctl reset --graceful=false --reboot wiped the ephemeral data, and on the second PXE boot it came up clean.
The Init Script
The whole boot infrastructure is driven by a single init container script that runs when the dnsmasq pod starts. It:
- Downloads the Talos factory SBC image (~140MB), extracts the EFI boot partition (firmware, DTBs, overlays)
- Downloads EDK2 UEFI firmware, overlays it onto the extracted files
- Patches the UEFI NVRAM for DeviceTree mode
- Copies the pre-built GRUB binary from the mounted ConfigMap
- Downloads the Talos kernel and initramfs
- Writes
grub.cfgto multiple paths (GRUB searches several locations) - Creates per-node TFTP directories from the node inventory ConfigMap
On subsequent restarts, it skips the downloads if files already exist and only refreshes the per-node directory structure. To force a fresh download (e.g. after a Talos version bump), delete _shared/ on the host and restart the DaemonSet.
Initially the script was brittle — it tried to run grub-mkimage on x86 (producing 0-byte binaries), used the wrong NVRAM variable format (simple instead of authenticated), and only cleaned specific known filenames on restart. I hardened it to:
- Use the pre-built GRUB from the ConfigMap
- Write the correct authenticated NVRAM variable format (with the 28-byte auth header)
- Aggressively clean per-node directories (delete ALL regular files, then recreate) to prevent stale artifacts from previous approaches
The GitOps Manifest Zoo
The final set of files in gitops/infrastructure/netboot/:
| File | Purpose |
|---|---|
namespace.yaml | The netboot namespace |
node-inventory.yaml | ConfigMap mapping Pi serials → hostnames, MACs, IPs |
dnsmasq-configmap.yaml | Proxy DHCP + TFTP configuration |
dnsmasq-daemonset.yaml | DaemonSet pinned to Velaryon, hostNetwork |
setup-boot-assets-script.yaml | The init container script |
grub-arm64-efi-configmap.yaml | Pre-built arm64-efi GRUB binary (628K) |
matchbox-deployment.yaml | Matchbox HTTP server for Talos configs |
matchbox-service.yaml | (Mostly vestigial, since we use hostNetwork) |
matchbox-groups.yaml | Matchbox group definitions |
matchbox-profiles.yaml | Matchbox profile definitions |
eeprom-update-job.yaml | Job to set BOOT_ORDER on all Pi 4B nodes |
kustomization.yaml | Ties it all together |
Per-Node TFTP Structure
The VideoCore bootloader on Pi 4B fetches files from /<serial>/ on the TFTP server. The init script creates:
/var/lib/tftpboot/
├── pxelinux.0 # GRUB EFI binary (NBP)
├── grub.cfg # GRUB config (+ copies in grub/, boot/grub/, EFI/BOOT/)
├── vmlinuz # Talos kernel
├── initramfs-arm64.xz # Talos initramfs
├── _shared/ # Common firmware files
│ ├── RPI_EFI.fd # Patched UEFI firmware (3.8MB)
│ ├── grub-arm64.efi # Pre-built GRUB (628K)
│ ├── start4.elf # VideoCore firmware
│ ├── fixup4.dat # VideoCore fixup
│ ├── bcm2711-rpi-4-b.dtb # Device tree
│ └── overlays/ # DT overlays
├── d32a9346/ # Dalt
│ ├── config.txt # UEFI boot config
│ ├── RPI_EFI.fd → ../_shared/RPI_EFI.fd
│ ├── start4.elf → ../_shared/start4.elf
│ └── (etc, all symlinks to _shared/)
├── f2c62f60/ # Allyrion
├── 4cd9693a/ # Bettley
└── ... (one per node)
What's Left
The 12 Pi 4B nodes all have the right EEPROM settings and the TFTP server has their directories ready. If any of their SD cards die, they'll PXE boot on the next power cycle and reinstall automatically.
The 4 Pi 5 nodes (Manderly, Norcross, Oakheart, Payne) need different firmware — the Pi 5 has a completely different boot architecture. That's a problem for future me. I'm sure he'll enjoy it.
ntfy, Gateway API, and the Three-Day Cert Outage
I started this session with a vague "how's everything going?" and ended up deploying a push notification server, building an HTTPS gateway for the entire cluster, and discovering that certificate issuance had been silently broken for three days. The usual.
Push Notifications with ntfy
The cluster had Prometheus, Grafana, Loki, Alloy, Tempo — basically the entire CNCF observability buffet. What it didn't have was any way to tell me when something was wrong. Alertmanager was running but had no receivers configured. Just collecting alerts and holding them, like a jar of screams on a shelf.
I deployed ntfy, a lightweight HTTP-based pub/sub notification server. It's beautifully simple: POST to a topic, subscribers get notified. No OAuth dance, no webhook signing secrets, no "please configure your SMTP relay." Just HTTP.
The deployment:
apiVersion: apps/v1
kind: Deployment
metadata:
name: ntfy
namespace: ntfy
spec:
replicas: 1
template:
spec:
containers:
- name: ntfy
image: binwiederhier/ntfy:v2.11.0
args: ["serve"]
resources:
requests:
cpu: 50m
memory: 64Mi
limits:
cpu: 100m
memory: 128Mi
Tiny. Runs on practically nothing. The config is a ConfigMap with server.yml:
base-url: "https://ntfy.goldentooth.net"
cache-file: "/var/cache/ntfy/cache.db"
cache-duration: "12h"
behind-proxy: true
Then I wired Alertmanager to POST to ntfy:
alertmanager:
config:
route:
receiver: ntfy
group_by: ['alertname', 'namespace']
group_wait: 30s
group_interval: 5m
repeat_interval: 4h
receivers:
- name: ntfy
webhook_configs:
- url: 'http://ntfy.ntfy.svc.cluster.local/cluster-alerts'
send_resolved: true
PrometheusRules: Things Worth Screaming About
With the notification pipe in place, I needed alerts. I created 11 rules across three groups:
Node health: NodeDown (5m), NodeHighCPU (>90%, 10m), NodeHighMemory (>90%, 10m), NodeDiskPressure (>85%, 5m), NodeDiskCritical (>95%, 5m), NodeNotReady (5m).
Kubernetes workloads: PodCrashLooping (>5 restarts in 15m), PodNotReady (10m), DeploymentReplicasMismatch (10m), PVCAlmostFull (>85%).
Observability health: PrometheusStorageFilling (>80%), LokiStorageFilling (>80%).
All labeled release: kube-prometheus-stack so the operator picks them up. I also enabled Hubble's ServiceMonitor and Grafana dashboards in Cilium's HelmRelease — the metrics were being generated but nobody was scraping them. Free observability, just sitting on the floor.
The HTTPS Problem
ntfy was up, alerts were flowing, everything was great. Then I tried to enable browser notifications and discovered that the Push API requires HTTPS. And our services were all plain HTTP behind MetalLB LoadBalancers. Each service had its own IP address from the MetalLB pool — functional, but unencrypted and burning through IPs.
I decided to fix this properly: a single HTTPS gateway with TLS termination, hostname-based routing, and cert-manager integration with our existing Step-CA PKI.
Cilium Gateway API
Cilium 1.16 has built-in Gateway API support. One Gateway resource, multiple HTTPRoutes, TLS termination, the works. No need for nginx-ingress or Traefik or any of the other usual suspects.
First, I enabled it in the Cilium HelmRelease:
gatewayAPI:
enabled: true
Then created the Gateway:
apiVersion: gateway.networking.k8s.io/v1
kind: Gateway
metadata:
name: goldentooth
namespace: gateway
spec:
gatewayClassName: cilium
listeners:
- name: http
port: 80
protocol: HTTP
- name: https
port: 443
protocol: HTTPS
tls:
mode: Terminate
certificateRefs:
- name: gateway-tls
Each service gets an HTTPRoute:
apiVersion: gateway.networking.k8s.io/v1
kind: HTTPRoute
metadata:
name: ntfy
namespace: ntfy
spec:
parentRefs:
- name: goldentooth
namespace: gateway
sectionName: https
hostnames:
- ntfy.goldentooth.net
rules:
- backendRefs:
- name: ntfy
port: 80
Plus a global HTTP→HTTPS redirect on the http listener. I switched eight services from LoadBalancer to ClusterIP: ntfy, grafana, prometheus, hubble-ui, httpbin, jupyterlab, litmus frontend, and tekton-dashboard. The long-term services (step-ca, seaweedfs, docker-registry, netboot) keep their dedicated IPs since they're accessed by non-HTTP clients or pre-boot infrastructure.
A ReferenceGrant allows HTTPRoutes in other namespaces to reference the Gateway:
apiVersion: gateway.networking.k8s.io/v1beta1
kind: ReferenceGrant
metadata:
name: allow-routes-to-gateway
namespace: gateway
spec:
from:
- group: gateway.networking.k8s.io
kind: HTTPRoute
namespace: ntfy
- group: gateway.networking.k8s.io
kind: HTTPRoute
namespace: monitoring
# ... etc
to:
- group: gateway.networking.k8s.io
kind: Gateway
Three Bugs In a Trenchcoat
None of this worked on the first try. Or the second. There were three separate issues, stacked on top of each other like a debugging matryoshka.
Bug 1: The Missing GRPCRoute CRD
After enabling Gateway API and restarting the Cilium operator, the GatewayClass showed Pending: Waiting for controller. The operator logs revealed:
level=error msg="Required GatewayAPI resources are not found"
error="customresourcedefinitions.apiextensions.k8s.io
\"grpcroutes.gateway.networking.k8s.io\" not found"
Cilium 1.16 requires the experimental channel Gateway API CRDs, not just the standard ones. The standard install gives you GatewayClass, Gateway, HTTPRoute, and ReferenceGrant. Cilium also demands GRPCRoute and TLSRoute, which live in the experimental channel. I'd already installed TLSRoute but missed GRPCRoute.
kubectl apply -f https://raw.githubusercontent.com/kubernetes-sigs/gateway-api/v1.2.0/\
config/crd/experimental/gateway.networking.k8s.io_grpcroutes.yaml
Then another operator restart. This time: Gateway Accepted, Gateway Programmed, IP assigned. 10.4.11.1. Beautiful.
Bug 2: cert-manager-approver-policy and the Phantom CA
The Gateway had an IP but no TLS cert. The Certificate resource was stuck — the CertificateRequest gateway-tls-1 had been created but showed no conditions at all. Not approved, not denied. Just... nothing.
The cert-manager-approver-policy pod had been crash-looping for ten days (2,069 restarts). The error:
"Failed to generate serving certificate"
err="failed verifying CA keypair: tls: failed to find any PEM data in certificate input"
The TLS secret for the approver's webhook (cert-manager-approver-policy-tls) was present with valid-looking data: ca.crt, tls.crt, tls.key. The CA cert decoded fine with openssl. So what's the problem?
I deleted the pod. The new one came up 1/1 Running. Checked the logs — same error on startup, but the controller started anyway. Workers running, CertificateRequestPolicy approve-step-ca-requests showing Ready. But still not processing any CertificateRequests. Zero. Not a single one.
Then I deleted the TLS secret and restarted the pod. And the real error appeared:
"error ensuring CA"
err="secrets is forbidden: User
\"system:serviceaccount:cert-manager:cert-manager-approver-policy\"
cannot create resource \"secrets\" in API group \"\" in the namespace \"cert-manager\""
The RBAC Role had create permission on secrets, but scoped to resourceNames: [cert-manager-approver-policy-tls]. Here's the thing about Kubernetes RBAC: resourceNames restrictions don't work with create because the resource doesn't exist yet at authorization time. There's nothing to match the name against. The original secret was created by the Helm install, and after that the controller only needed update. But once the secret was gone, the controller couldn't recreate it.
The fix was dumb and effective: create an empty stub secret, then restart the pod:
kubectl create secret generic cert-manager-approver-policy-tls -n cert-manager
kubectl delete pod -n cert-manager cert-manager-approver-policy-d8df87467-s24fm
The controller came up, found the empty secret, and updated it with a fresh CA keypair — which it had permission to do. New CA cert, valid for a year. Then I had to update the webhook's caBundle to match the new CA:
NEW_CA=$(kubectl get secret -n cert-manager cert-manager-approver-policy-tls \
-o jsonpath='{.data.ca\.crt}')
kubectl get validatingwebhookconfiguration cert-manager-approver-policy -o json \
| jq --arg ca "$NEW_CA" '.webhooks[0].clientConfig.caBundle = $ca' \
| kubectl apply -f -
But the approver still wasn't auto-approving CertificateRequests. The controller started, declared itself ready, started workers with "worker count"=1 — and then sat there doing nothing. I installed cmctl and manually approved the stuck requests:
cmctl approve -n gateway gateway-tls-1
cmctl approve -n cert-test canary-certificate-2483
cmctl approve -n docker-registry registry-tls-139
cmctl approve -n cert-test test-certificate-160
All four immediately went to Approved + Ready. The certificate pipeline was working — it was just the approval step that was stuck. Looking at the timeline, the last successful auto-approval was ~7 days ago. Every CR created after that was silently dropped. The canary cert (which renews every few hours) had been quietly failing for days and nobody knew because... we didn't have alerting. Which is what started this whole session.
The cert-manager-approver-policy pod is now healthy and running with a fresh TLS keypair. Whether it'll auto-approve future CRs remains to be seen — the canary cert expires in about two hours, so that'll be the test.
Bug 3: External-DNS and the Service Annotation Gap
Gateway programmed. Certs issued. HTTPS working via curl --resolve. But DNS wasn't resolving. The Gateway had external-dns.alpha.kubernetes.io/hostname annotations with all eight hostnames. So why wasn't External-DNS picking them up?
Because External-DNS was configured with --source=service only. It watches Services, not Gateway resources. And Cilium, while it helpfully auto-creates a cilium-gateway-goldentooth LoadBalancer Service for the Gateway, does not propagate annotations from the Gateway to the Service.
The annotation was on the Gateway. External-DNS was watching Services. The auto-created Service had no hostname annotation. Three things that individually made perfect sense and collectively produced silence.
Quick fix — annotate the auto-created Service directly:
kubectl annotate svc -n gateway cilium-gateway-goldentooth \
"external-dns.alpha.kubernetes.io/hostname=grafana.goldentooth.net,..." \
"external-dns.alpha.kubernetes.io/ttl=60"
That got DNS working immediately, but listing every hostname in an annotation on one resource is obviously not going to scale. Every time I add a service, I'd have to go touch the Gateway annotation. Nope.
The real fix: add --source=gateway-httproute to External-DNS. With this source, External-DNS watches HTTPRoute resources and reads the hostnames field from each one. Since every HTTPRoute already declares its hostname, DNS records appear automatically when routes are added. No annotation maintenance anywhere.
The deployment change:
args:
- --source=service
- --source=gateway-httproute
But External-DNS also needs RBAC to read Gateway API resources, which it obviously didn't have:
- apiGroups: ["gateway.networking.k8s.io"]
resources: ["gateways", "httproutes"]
verbs: ["get", "list", "watch"]
With both changes applied, I removed the manual annotations from the Gateway and the auto-created Service:
kubectl annotate svc -n gateway cilium-gateway-goldentooth \
external-dns.alpha.kubernetes.io/hostname- \
external-dns.alpha.kubernetes.io/ttl-
Within 60 seconds, External-DNS was discovering endpoints from each HTTPRoute and confirming A records in Route 53:
Desired change: CREATE grafana.goldentooth.net A
Desired change: CREATE prometheus.goldentooth.net A
Desired change: CREATE ntfy.goldentooth.net A
Desired change: CREATE hubble.goldentooth.net A
Desired change: CREATE httpbin.goldentooth.net A
Desired change: CREATE jupyterlab.goldentooth.net A
Desired change: CREATE chaos-center.goldentooth.net A
Desired change: CREATE tekton-dashboard.goldentooth.net A
All pointing at 10.4.11.1.
The Final State
Verified with curl:
| Service | Status | Notes |
|---|---|---|
| ntfy.goldentooth.net | 200 | Push notifications |
| grafana.goldentooth.net | 302 | Redirects to /login |
| prometheus.goldentooth.net | 302 | Normal |
| hubble.goldentooth.net | 200 | Network observability |
| httpbin.goldentooth.net | 200 | HTTP testing |
| jupyterlab.goldentooth.net | — | GPU workbench |
| chaos-center.goldentooth.net | — | Litmus chaos |
| tekton-dashboard.goldentooth.net | — | CI/CD |
HTTP requests to port 80 return a 301 redirect to HTTPS. The Gateway has a single MetalLB IP (10.4.11.1) instead of eight separate LoadBalancer IPs. TLS terminates at the gateway with certs from Step-CA, renewed every 24 hours by cert-manager.
What I Learned
-
Cilium's Gateway API support requires experimental CRDs (GRPCRoute, TLSRoute) — this isn't documented prominently. The error message is clear once you see it, but you have to restart the operator to see it.
-
Kubernetes RBAC
resourceNamesrestrictions oncreateverbs are silently useless. The authorization check passes because there's no name to match against, but the intent — "only allow creating this specific named resource" — is a lie. If the thing gets deleted, you can't recreate it. -
External-DNS with
--source=servicedoesn't see Gateway resources, and Cilium doesn't propagate annotations from Gateway to the auto-created Service. The right fix is--source=gateway-httproute, which reads hostnames directly from each HTTPRoute — new routes get DNS records automatically with zero annotation management. -
The cluster had been silently failing cert renewals for three days and nothing noticed because the alerting pipeline didn't exist yet. The very thing I was deploying (ntfy + PrometheusRules) would have caught this immediately. There's a metaphor in there about infrastructure bootstrapping and chickens and eggs but I'm too tired to articulate it.
Joining Pi 5 Nodes: The Manual Bootstrap
The last entry about netboot (089) ended with a cheerful "The 4 Pi 5 nodes need different firmware — the Pi 5 has a completely different boot architecture. That's a problem for future me." Well, future me showed up, looked at the problem, and decided to go a completely different direction.
The plan was always to run Talos on the Pi 5s, same as the rest of the bramble. The Pi 5 has NVMe storage, newer silicon, more RAM — it would be the storage tier, running Longhorn on those 932GB NVMe SSDs. Beautiful plan. One problem: it doesn't work.
The Kernel Bug
Siderolabs ships an SBC overlay for the Raspberry Pi that includes kernel patches and device tree modifications for Talos compatibility. On the Pi 5, there's a bug where the Ethernet interface fails to initialize. The NIC just... doesn't come up. No link, no DHCP, nothing. The node boots into Talos and sits there uselessly.
I burned more time than I'd like to admit trying workarounds — different Talos versions, different overlay builds, netboot with custom kernel parameters. The bug is in the kernel's BCM2712 Ethernet driver as built for the SBC overlay, and nothing short of a kernel fix is going to help.
The Pivot: Ubuntu Server
Fine. If Talos won't run on the Pi 5, Ubuntu will. Ubuntu 25.10 has working arm64 support for the Pi 5, including the Ethernet driver (because of course it does — it's not trying to be special). I flashed SD cards with the preinstalled server image, configured cloud-init for static IPs and SSH keys, and after some fiddling with XFS formatting on the NVMe drives, had four healthy Ubuntu nodes:
| Node | IP | NVMe |
|---|---|---|
| manderly | 10.4.0.22 | 932GB |
| norcross | 10.4.0.23 | 932GB |
| oakheart | 10.4.0.24 | 932GB |
| payne | 10.4.0.25 | 932GB |
Each with containerd, kubelet, and kubeadm installed from the Kubernetes apt repo. NVMe drives formatted XFS and mounted at /var/lib/longhorn. Ready to join the cluster.
Attempt 1: kubeadm join (Three Flavors of Failure)
The obvious approach: kubeadm join. That's what it's for. You give it a token, a CA hash, and a control plane endpoint, and it handles the TLS bootstrap dance.
kubeadm join cp.k8s.goldentooth.net:6443 \
--token pi5wrk.abcdef1234567890 \
--discovery-token-ca-cert-hash sha256:0e7e249a...
This failed immediately. The token-based discovery mechanism expects to read the cluster-info ConfigMap from the kube-public namespace using anonymous authentication. Talos disables anonymous auth to the API server. No anonymous access means no reading kube-public, which means the discovery phase can't obtain the cluster CA to verify the API server's identity. Chicken, meet egg.
Attempt 1b: File-based discovery. kubeadm supports --discovery-file where you provide a kubeconfig with the CA already embedded, skipping the anonymous kube-public lookup:
kubeadm join cp.k8s.goldentooth.net:6443 \
--discovery-file /etc/kubernetes/discovery.yaml
This got further — the TLS handshake succeeded, the bootstrap token authenticated — and then kubeadm tried to read the kubeadm-config ConfigMap from kube-system. Talos doesn't create this ConfigMap. It's a kubeadm-specific artifact that contains the ClusterConfiguration — things like the API server address, networking CIDRs, certificate SANs. Talos manages all of that through its own machine config and doesn't need kubeadm's opinion about it.
The error was a clean Forbidden — the bootstrap token doesn't have RBAC access to read arbitrary ConfigMaps in kube-system, and even if it did, the ConfigMap doesn't exist.
I briefly considered creating a fake kubeadm-config ConfigMap with the right fields to satisfy kubeadm's checks. Then I had a better idea.
The Manual Bootstrap
kubeadm is, at its core, a convenience wrapper around the kubelet's TLS bootstrap protocol. The kubelet has built-in support for bootstrapping itself into a cluster using a bootstrap token. kubeadm just automates the config file generation and CSR approval setup. But you can do all of that by hand.
The protocol is:
- kubelet starts with a bootstrap kubeconfig (token-based auth)
- kubelet generates a client key pair and submits a CertificateSigningRequest
- The CSR gets auto-approved (if RBAC is set up for it)
- kubelet receives a signed client certificate, writes a permanent kubeconfig
- kubelet is now a full cluster member
I needed four files on each node:
1. CA Certificate
This one's easy — it's in the kube-root-ca.crt ConfigMap that every namespace gets automatically:
kubectl get configmap kube-root-ca.crt -n default -o jsonpath='{.data.ca\.crt}'
Goes to /etc/kubernetes/pki/ca.crt. The cluster CA is an EC key (P-256, ecdsa-with-SHA256), which I discovered the hard way when openssl rsa -pubin refused to parse it. openssl pkey -pubin works for any key type. Filed that one away.
2. Bootstrap Kubeconfig
A kubeconfig that authenticates with the bootstrap token:
apiVersion: v1
kind: Config
clusters:
- cluster:
certificate-authority-data: <base64 CA cert>
server: https://cp.k8s.goldentooth.net:6443
name: goldentooth
contexts:
- context:
cluster: goldentooth
user: kubelet-bootstrap
name: bootstrap
current-context: bootstrap
users:
- name: kubelet-bootstrap
user:
token: pi5wrk.abcdef1234567890
Goes to /etc/kubernetes/bootstrap-kubelet.conf. The bootstrap token was already created and patched to the system:bootstrappers:nodes group, with RBAC allowing that group to create CSRs and auto-approve node client certificates.
3. Kubelet Configuration
This one took some archaeology. I needed a KubeletConfiguration that matched what the rest of the cluster expected. The Talos nodes don't have a file you can just cat — Talos generates the kubelet config on the fly from its machine config. But kubelet exposes its running config via the node proxy API:
kubectl get --raw /api/v1/nodes/dalt/proxy/configz
This returns the live KubeletConfiguration from a running Talos worker. I used it as a reference and adapted for Ubuntu:
cgroupDriver: systemdinstead ofcgroupfs— Ubuntu uses systemd cgroups, Talos uses its own cgroup managementprotectKernelDefaults: false— Talos setstruebecause it controls all kernel parameters. Ubuntu's defaults don't satisfy the kubelet's kernel parameter checks- Standard resolv.conf — Talos uses
/system/resolved/resolv.conf, Ubuntu uses/run/systemd/resolve/resolv.conf - No custom cgroup paths — Talos sets
kubeletCgroupsandsystemCgroupsexplicitly, Ubuntu lets systemd handle it
The rest carried over: clusterDNS: [10.96.0.10], clusterDomain: cluster.local, rotateCertificates: true, tlsMinVersion: VersionTLS13, seccompDefault: true, pod CIDR 10.244.0.0/16, service CIDR 10.96.0.0/12, max pods 110.
Goes to /var/lib/kubelet/config.yaml.
4. Systemd Drop-in
The kubelet package from the Kubernetes apt repo ships a bare systemd unit — just ExecStart=/usr/bin/kubelet with no arguments. It expects a drop-in to provide the actual flags:
[Service]
ExecStart=
ExecStart=/usr/bin/kubelet \
--bootstrap-kubeconfig=/etc/kubernetes/bootstrap-kubelet.conf \
--kubeconfig=/etc/kubernetes/kubelet.conf \
--config=/var/lib/kubelet/config.yaml \
--container-runtime-endpoint=unix:///run/containerd/containerd.sock \
--node-labels=node.kubernetes.io/disk-type=nvme
The ExecStart= (blank) line is important — systemd requires you to clear the directive before overriding it in a drop-in. Without that, you get both ExecStart lines and systemd refuses to start the unit.
The kubeadm apt package also ships its own drop-in at /usr/lib/systemd/system/kubelet.service.d/10-kubeadm.conf that references $KUBELET_KUBEADM_ARGS and other environment variables that don't exist in our setup. That file had to be removed before the kubelet would start cleanly.
First Blood: Manderly
With all four files in place, I started kubelet on Manderly and watched the logs. The TLS bootstrap worked on the first try:
I0312 kubelet_certificate_manager.go:263] "Certificate rotation is enabled"
I0312 certificate_manager.go:454] "Rotating certificates"
I0312 certificate_manager.go:497] "Certificate approved, waiting to be issued"
The bootstrap token authenticated, the CSR was submitted and auto-approved, and kubelet received a signed client certificate. Node appeared in the cluster as NotReady:
$ kubectl get node manderly
NAME STATUS ROLES AGE VERSION
manderly NotReady <none> 12s v1.34.5
NotReady because the CNI wasn't running yet. Cilium is a DaemonSet — it should schedule automatically on any new node. And it did schedule. It just didn't start.
The localhost:7445 Problem
Cilium's init containers were stuck at Init:0/5. The logs revealed the issue:
level=info msg="Establishing connection to apiserver" host="https://localhost:7445"
The Cilium DaemonSet has hardcoded environment variables:
env:
- name: KUBERNETES_SERVICE_HOST
value: "localhost"
- name: KUBERNETES_SERVICE_PORT
value: "7445"
This is a Talos-ism. Talos runs KubePrism, a local API server proxy on every node at localhost:7445 that forwards to the actual control plane. This means pods don't need to know the real API server address — they just talk to localhost. It's clever and it works great on Talos.
Ubuntu doesn't have KubePrism. There's nothing listening on localhost:7445. Cilium starts, tries to connect to the API server, gets connection refused, and sits in init forever.
I considered modifying the Cilium DaemonSet to use the real API server address, but that would break every Talos node. I considered running a separate Cilium DaemonSet for Ubuntu nodes with a different config, but that's a maintenance nightmare.
The simplest solution: give Ubuntu nodes their own localhost:7445 proxy.
apt-get install -y socat
Then a systemd service:
[Unit]
Description=Kubernetes API Server Proxy (socat)
After=network.target
[Service]
Type=simple
ExecStart=/usr/bin/socat TCP-LISTEN:7445,bind=127.0.0.1,reuseaddr,fork TCP:10.4.0.9:6443
Restart=always
RestartSec=5
[Install]
WantedBy=multi-user.target
socat listens on localhost:7445 and forwards every connection to the real control plane VIP at 10.4.0.9:6443. It's not as sophisticated as KubePrism (no health checking, no endpoint rotation), but the VIP handles failover at the MetalLB level, so it doesn't need to be.
After enabling the proxy service, I deleted the stuck Cilium pods. The DaemonSet scheduled new ones, they connected through the socat proxy, and Cilium initialized:
$ kubectl get node manderly
NAME STATUS ROLES AGE VERSION
manderly Ready <none> 4m33s v1.34.5
Ready. First Pi 5 in the cluster.
Rolling Out to the Fleet
With the process proven on manderly, the remaining three nodes were mechanical. The exact same files — CA cert, bootstrap kubeconfig, kubelet config, systemd drop-in — apply to all nodes because the bootstrap token is shared and the kubelet config is node-agnostic. Each node generates its own client certificate during TLS bootstrap.
For each of norcross, oakheart, and payne:
- SCP the four config files
- Install socat, place files in the right paths
- Remove the kubeadm drop-in
- Create and enable the API proxy service
- Start kubelet
- Delete the stuck Cilium pods (they always get stuck on first schedule before the proxy is up)
- Wait for Cilium to initialize
The whole thing was scriptable. Within a couple of minutes, all three nodes were Ready:
$ kubectl get nodes -o wide | grep -E 'manderly|norcross|oakheart|payne'
manderly Ready <none> 10m v1.34.5 10.4.0.22 Ubuntu 25.10
norcross Ready <none> 2m47s v1.34.5 10.4.0.23 Ubuntu 25.10
oakheart Ready <none> 2m24s v1.34.5 10.4.0.24 Ubuntu 25.10
payne Ready <none> 118s v1.34.5 10.4.0.25 Ubuntu 25.10
The Full Bramble
Seventeen nodes, all Ready:
NAME STATUS ROLES VERSION OS IP
allyrion Ready control-plane v1.34.0 Talos (v1.12.5) 10.4.0.10
bettley Ready control-plane v1.34.0 Talos (v1.12.5) 10.4.0.11
cargyll Ready control-plane v1.34.0 Talos (v1.12.5) 10.4.0.12
dalt Ready <none> v1.34.0 Talos (v1.12.5) 10.4.0.13
erenford Ready <none> v1.34.0 Talos (v1.12.5) 10.4.0.14
fenn Ready <none> v1.34.0 Talos (v1.12.5) 10.4.0.15
gardener Ready <none> v1.34.0 Talos (v1.12.5) 10.4.0.16
harlton Ready <none> v1.34.0 Talos (v1.12.5) 10.4.0.17
inchfield Ready <none> v1.34.0 Talos (v1.12.5) 10.4.0.18
jast Ready <none> v1.34.0 Talos (v1.12.5) 10.4.0.19
karstark Ready <none> v1.34.0 Talos (v1.12.5) 10.4.0.20
lipps Ready <none> v1.34.0 Talos (v1.12.5) 10.4.0.21
manderly Ready <none> v1.34.5 Ubuntu 25.10 10.4.0.22
norcross Ready <none> v1.34.5 Ubuntu 25.10 10.4.0.23
oakheart Ready <none> v1.34.5 Ubuntu 25.10 10.4.0.24
payne Ready <none> v1.34.5 Ubuntu 25.10 10.4.0.25
velaryon Ready <none> v1.34.0 Talos (v1.12.5) 10.4.0.30
Three control plane nodes, twelve Pi 4B workers on Talos, four Pi 5 workers on Ubuntu with 932GB NVMe each, and one x86 GPU node. A mixed-OS Kubernetes cluster held together by a shared bootstrap token, a socat proxy, and a refusal to let a kernel bug win.
Longhorn: Distributed Storage on NVMe
The whole point of those Pi 5 nodes was storage. Four 932GB NVMe SSDs sitting in the cluster, waiting for a distributed storage system to give them purpose. The previous occupant of that role, SeaweedFS, was torn down a few days ago after a long slide into irrelevance — it was an object store bolted onto USB SSDs with an operator that fought me at every turn. The docker registry it backed had been in CrashLoopBackOff since the teardown. Time for something better.
Why Longhorn
Longhorn is a distributed block storage system for Kubernetes. Unlike SeaweedFS (object storage, S3 API, filer abstraction, operator complexity), Longhorn provides plain old PersistentVolumes. You create a PVC, Longhorn allocates space on the NVMe drives, replicates the data across nodes, and serves it over iSCSI. No S3 buckets, no filer processes, no operator CRDs that refuse to delete cleanly. Just block storage.
The architecture:
- Longhorn Manager: DaemonSet on every worker node. Creates node resources, manages replicas, orchestrates volume operations.
- Engine + Instance Manager: Per-node processes that handle the actual iSCSI target serving and data replication.
- CSI Plugin: DaemonSet on every node. Handles volume attach/detach/mount so any pod on any node can consume Longhorn volumes.
- UI: Optional web dashboard. Handy for seeing disk utilization at a glance.
Data lives on the 4 Pi 5 NVMe nodes. Any pod on any worker node can mount a Longhorn volume — the CSI plugin attaches it over iSCSI from whichever storage node holds the replica.
The Prerequisites
The Pi 5 nodes were already mostly ready from the Ubuntu setup work:
- NVMe SSDs: 932GB each, formatted XFS, mounted at
/var/lib/longhorn - open-iscsi: Installed,
iscsidenabled and running - nfs-common: Installed (for RWX support later)
One thing missing: the iscsi_tcp kernel module wasn't set to load at boot on three of the four nodes (manderly had it from testing). Quick fix:
for ip in 10.4.0.22 10.4.0.23 10.4.0.24 10.4.0.25; do
ssh nathan@$ip 'echo iscsi_tcp | sudo tee /etc/modules-load.d/iscsi.conf'
done
The Talos worker nodes (Pi 4B) already had the iscsi-tools and util-linux-tools extensions configured in talconfig.yaml, plus a /var/lib/longhorn bind mount in the kubelet extra mounts. Past me actually planned ahead for once.
The GitOps Manifests
Following the existing Flux CD pattern — same structure as Cilium, Prometheus, everything else:
gitops/infrastructure/longhorn/
├── kustomization.yaml
├── namespace.yaml # longhorn-system, privileged PSA
├── repository.yaml # HelmRepository → charts.longhorn.io
└── release.yaml # HelmRelease with all the values
Added - longhorn to the infrastructure kustomization, committed, pushed, waited for Flux.
Key Helm Values
The important decisions:
defaultSettings:
createDefaultDiskLabeledNodes: true
defaultDataPath: /var/lib/longhorn
defaultReplicaCount: 2
storageMinimalAvailablePercentage: 15
nodeDownPodDeletionPolicy: delete-both-statefulset-and-deployment-pod
persistence:
defaultClassReplicaCount: 2
defaultClass: true
createDefaultDiskLabeledNodes: true is the key one. Longhorn only creates storage disks on nodes that have the label node.longhorn.io/create-default-disk=true. This means the 12 Pi 4B nodes and the GPU node don't accidentally become storage backends — only the 4 Pi 5 nodes with their NVMe drives.
Replica count 2: With 4 storage nodes, 3 replicas would mean 75% of nodes hold every volume. That's a lot of cross-node replication traffic for marginal benefit. 2 replicas survives a single node failure, which is the realistic failure mode for a home cluster.
Default StorageClass: Longhorn becomes the cluster default. New PVCs that don't specify a class get Longhorn automatically. The old local-path (SD card) and local-path-usb classes still exist for workloads that want them.
The Three Mistakes
Mistake 1: systemManagedComponentsNodeSelector
My first attempt restricted Longhorn system components to NVMe nodes only:
defaultSettings:
systemManagedComponentsNodeSelector: "node.kubernetes.io/disk-type:nvme"
This seemed logical — keep Longhorn's manager, engine images, and CSI plugin on the storage nodes. The problem: the CSI plugin must run on every node, not just storage nodes. Without the CSI plugin, a node can't mount Longhorn volumes. A pod scheduled on inchfield (a Pi 4B) tried to mount a Longhorn PVC and got:
CSINode inchfield does not contain driver driver.longhorn.io
Fix: removed systemManagedComponentsNodeSelector entirely and cleared the persisted Longhorn setting:
kubectl patch settings.longhorn.io system-managed-components-node-selector \
-n longhorn-system --type merge -p '{"value": ""}'
The setting persists in the CRD even after removing it from Helm values. You have to explicitly clear it.
Mistake 2: Longhorn Manager on Control Plane Nodes
With the global node selector removed, the Longhorn Manager DaemonSet happily scheduled on all 16 nodes — including the 3 control plane nodes. Those promptly crashed:
level=fatal msg="Error starting manager: failed to check environment, please make
sure you have iscsiadm/open-iscsi installed on the host"
Talos control plane nodes don't have the iscsi-tools extension. Only workers do. And the control plane nodes had no taint to prevent the DaemonSet from scheduling there.
Wait. No taint? Aren't control plane nodes supposed to have node-role.kubernetes.io/control-plane:NoSchedule?
Mistake 3: allowSchedulingOnControlPlanes Was True
Turns out talconfig.yaml had allowSchedulingOnControlPlanes: true — an explicit opt-in that tells Talos to remove the standard NoSchedule taint from control plane nodes. I'm not sure why I did this; perhaps I was concerned about nodes "only" being control plane, but really, the control plane nodes have enough to worry about with etcd.
So I set allowSchedulingOnControlPlanes: false in talconfig, regenerated configs, and applied.
# talconfig.yaml
allowSchedulingOnControlPlanes: false
talhelper genconfig
talosctl apply-config --nodes 10.4.0.10 --file clusterconfig/goldentooth-allyrion.yaml --mode no-reboot
talosctl apply-config --nodes 10.4.0.11 --file clusterconfig/goldentooth-bettley.yaml --mode no-reboot
talosctl apply-config --nodes 10.4.0.12 --file clusterconfig/goldentooth-cargyll.yaml --mode no-reboot
Applied without reboot. Taints appeared immediately:
$ kubectl get nodes allyrion bettley cargyll -o custom-columns='NAME:.metadata.name,TAINTS:.spec.taints'
NAME TAINTS
allyrion [map[effect:NoSchedule key:node-role.kubernetes.io/control-plane]]
bettley [map[effect:NoSchedule key:node-role.kubernetes.io/control-plane]]
cargyll [map[effect:NoSchedule key:node-role.kubernetes.io/control-plane]]
With the taints in place, the node.longhorn.io/worker label workaround was no longer needed. The Longhorn manager's nodeSelector went back to empty — the taint does the exclusion automatically.
Existing pods on CP nodes (external-dns, metallb controller, kubevirt, etc.) aren't evicted — NoSchedule only prevents new scheduling. They'll migrate naturally when they restart. If we wanted force, it'd be NoExecute, but that's aggressive for a running cluster.
The Final State
After the dust settled:
$ kubectl get ds -n longhorn-system
NAME DESIRED READY NODE SELECTOR
engine-image-ei-d91f5974 16 16 <none>
longhorn-csi-plugin 16 16 <none>
longhorn-manager 14 14 <none>
- Longhorn Manager: 14 pods — all worker nodes (CP excluded by taint)
- CSI Plugin: 16 pods — every node in the cluster (so any pod can mount volumes)
- Engine Images: 16 pods — every node
Storage:
$ kubectl get sc
NAME PROVISIONER RECLAIMPOLICY ALLOWVOLUMEEXPANSION
local-path rancher.io/local-path Delete false
local-path-usb rancher.io/local-path Delete true
longhorn (default) driver.longhorn.io Delete true
Four Pi 5 NVMe nodes, each with ~931GB available, all schedulable in Longhorn. ~3.7TB raw, ~1.86TB usable with 2x replication. ServiceMonitor wired into prometheus-stack for metrics.
Docker Registry: Back from the Dead
The docker registry had been in CrashLoopBackOff since SeaweedFS was torn down — it was configured to use S3 storage at goldentooth-storage-filer.seaweedfs.svc.cluster.local:8333, a service that no longer existed.
The fix was straightforward: switch from S3 to filesystem storage on a Longhorn PVC.
Before (S3/SeaweedFS):
storage:
s3:
region: us-east-1
regionendpoint: http://goldentooth-storage-filer.seaweedfs.svc.cluster.local:8333
bucket: harbor-registry
After (filesystem/Longhorn):
storage:
filesystem:
rootdirectory: /var/lib/registry
Added a 50Gi PVC, mounted it in the deployment, removed the S3 secret dependency. Flux reconciled, the PVC bound to a Longhorn volume, and the registry came back:
$ kubectl get pods -n docker-registry
NAME READY STATUS RESTARTS AGE
docker-registry-74bd5d47b9-6hmzn 1/1 Running 0 12m
Sixteen hours of CrashLoopBackOff, resolved by swapping 10 lines of YAML. The registry now has replicated NVMe storage!
Garage: S3 Storage for a Post-MinIO World
The Death of MinIO
MinIO is dead.
Not "deprecated" dead, not "we're pivoting" dead. Dead dead. The GitHub repo was archived on February 13, 2026. Read-only. The once-ubiquitous open source S3-compatible object store — the thing everybody used, the thing half the self-hosted world depended on — is gone.
The timeline is a masterclass in how to destroy community trust:
- May 2025: MinIO quietly removes admin features from the web UI. Then OIDC login. Then stops publishing free Docker images. The community notices but hopes it's a phase.
- October 2025: MinIO declares the open source edition "maintenance mode." No new features, no bug fixes, no security patches. All development has moved to AIStor, their proprietary fork. They publish a smug blog post bragging about "13,061 commits separating AIStor from unmaintained OSS." CVEs are left unfixed.
- February 2026: The repo is archived. Fin.
The Reddit thread titles tell the story: "Avoid MinIO: developers introduce trojan horse update stripping community edition of most features" (1.9K upvotes). "MinIO is in maintenance mode and is no longer accepting new changes" (321 upvotes). One paying customer nailed it: "We paid for support to encourage a great open source project and this is what comes of it." Someone else called it "pulling a Broadcom," which... yeah.
I'd already torn down SeaweedFS (our previous object store) days earlier. MinIO was the obvious replacement candidate. Nope.
Enter Garage
Garage is an S3-compatible object storage system built by Deuxfleurs, a French non-profit hosting collective. It's written in Rust, which is fun, and it's designed from the ground up for exactly the kind of deployment I have: small nodes, multiple sites, unreliable networks, minimal resources.
Key properties:
- Lightweight: Single static binary, ~19MB Docker image. Runs happily on a Raspberry Pi.
- Distributed: Built-in replication with configurable factor. Nodes discover each other via Kubernetes CRDs, Consul, or static bootstrap.
- S3-compatible: Implements enough of the S3 API that Docker registry, Loki, backup tools, etc. all work fine.
- Simple: No operator, no Raft consensus, no filer abstraction. Just nodes that store data and talk to each other.
- arm64 native: First-class aarch64 builds. Important when your cluster is 16 Raspberry Pis.
- AGPL-3.0: Properly open source, backed by a non-profit. No rug-pull risk.
The architecture is pleasantly straightforward compared to SeaweedFS (masters + volume servers + filer + operator) or MinIO (erasure coding, complex quorum rules, enterprise feature gates). Garage nodes are all equal. Each node stores metadata (LMDB) and data blocks. Objects are split into blocks, replicated across nodes, and a partition-based routing table determines which nodes hold which data. That's it.
The Deployment
Four Garage nodes, one per Pi 5, running as a StatefulSet with Longhorn PVCs. Following the same raw-manifest pattern as the Docker registry — no Helm chart involved.
Manifests
gitops/infrastructure/garage/
├── kustomization.yaml
├── namespace.yaml
├── rbac.yaml # ServiceAccount + ClusterRole for K8s discovery CRD
├── secret.yaml # SOPS-encrypted: RPC secret, admin token, metrics token
├── configmap.yaml # garage.toml
├── statefulset.yaml # 4 replicas on Pi 5 nodes
└── service.yaml # Headless (RPC) + ClusterIP (S3 API)
Configuration
The garage.toml is mercifully short:
replication_factor = 2
consistency_mode = "consistent"
metadata_dir = "/var/lib/garage/meta"
data_dir = "/var/lib/garage/data"
db_engine = "lmdb"
compression_level = 1
[kubernetes_discovery]
namespace = "garage"
service_name = "garage"
skip_crd = false
[s3_api]
api_bind_addr = "[::]:3900"
s3_region = "garage"
[admin]
api_bind_addr = "[::]:3903"
Kubernetes discovery means Garage manages its own CRD (garagenodes.deuxfleurs.fr) to find peers. No bootstrap peers to configure, no Consul dependency. The RBAC gives it permission to create and manage the CRD, and nodes find each other automatically.
Secrets (RPC secret, admin token, metrics token) are injected via environment variables from a SOPS-encrypted Secret. Garage reads GARAGE_RPC_SECRET, GARAGE_ADMIN_TOKEN, and GARAGE_METRICS_TOKEN from the environment, which is cleaner than templating them into the TOML.
StatefulSet
The StatefulSet runs 4 replicas pinned to Pi 5 nodes (node.kubernetes.io/disk-type: nvme) with Parallel pod management. Each pod gets:
- 1Gi meta PVC (Longhorn): LMDB metadata database
- 100Gi data PVC (Longhorn): Actual object data blocks
So Garage sits on top of Longhorn, which sits on top of the physical NVMe SSDs. Longhorn handles the block replication at the storage layer, Garage handles object replication at the S3 layer. It's replication all the way down, which is maybe excessive for a single-site cluster, but at least nothing's getting lost.
Deployment
Pushed the manifests, Flux reconciled, all 4 pods came up Running within seconds. The nodes found each other immediately via Kubernetes discovery:
==== HEALTHY NODES ====
ID Hostname Address Tags Zone Capacity DataAvail
3aba977fad6d667b garage-3 10.244.1.77:3901 [] dc1 100.0 GB 105.1 GB
62b886fd3a97a860 garage-2 10.244.3.193:3901 [] dc1 100.0 GB 105.1 GB
a3357ec9deb02542 garage-1 10.244.2.67:3901 [] dc1 100.0 GB 105.1 GB
a74d59c28f665708 garage-0 10.244.0.32:3901 [] dc1 100.0 GB 105.1 GB
But the pods weren't Ready — health checks returned 503. This is because Garage requires a cluster layout to be configured before it considers itself healthy. Fair enough.
Cluster Layout
The layout assigns capacity and zone information to each node. Since we're single-site:
garage layout assign -z dc1 -c 100G a74d
garage layout assign -z dc1 -c 100G a335
garage layout assign -z dc1 -c 100G 62b8
garage layout assign -z dc1 -c 100G 3aba
garage layout apply --version 1
Output:
Partitions are replicated 2 times on at least 1 distinct zones.
Optimal partition size: 781.2 MB
Usable capacity / total cluster capacity: 400.0 GB / 400.0 GB (100.0 %)
Effective capacity (replication factor 2): 200.0 GB
200GB effective capacity with replication factor 2. Once the layout was applied, health checks immediately started passing and all 4 pods went Ready.
Proof of Concept: Docker Registry on Garage
The whole reason for deploying Garage was to give the Docker registry a proper S3 backend again. It had been on a filesystem PVC on Longhorn since the SeaweedFS teardown — functional but not what we want long-term.
Bucket and Key Setup
garage bucket create docker-registry
garage key create docker-registry-key
garage bucket allow --read --write docker-registry --key docker-registry-key
Registry Configuration Changes
Switched the Docker registry config from filesystem to S3:
# Before (filesystem on Longhorn PVC)
storage:
filesystem:
rootdirectory: /var/lib/registry
# After (Garage S3)
storage:
s3:
region: garage
bucket: docker-registry
regionendpoint: http://garage-s3.garage.svc.cluster.local:3900
Updated the Deployment to inject REGISTRY_STORAGE_S3_ACCESSKEY and REGISTRY_STORAGE_S3_SECRETKEY from a SOPS-encrypted Secret, removed the PVC volume mount, and swapped pvc.yaml for registry-s3-secret.yaml in the kustomization.
Pushed, Flux reconciled, the registry came up Running immediately. Checked the logs — no S3 errors, health checks passing, TLS working.
End-to-End Test
Pushed alpine:latest (all architectures) into the registry using crane:
crane copy alpine:latest registry.goldentooth.net/test/alpine:latest --insecure
All blobs pushed, all manifests stored:
$ curl -sk https://registry.goldentooth.net/v2/_catalog
{"repositories":["test/alpine"]}
$ curl -sk https://registry.goldentooth.net/v2/test/alpine/tags/list
{"name":"test/alpine","tags":["latest"]}
Pulled the manifest back — full OCI image index with amd64, arm64, armv6, armv7, i386, ppc64le, riscv64, s390x variants. Everything round-tripped cleanly through Garage.
The bucket ended up with 114 objects, 29 MiB. Not bad for a multi-arch alpine image with attestation manifests.
PVC Cleanup
The old 50Gi Longhorn PVC (registry-data) was automatically cleaned up by Flux when we removed pvc.yaml from the kustomization. One less thing to worry about.
Current State
The bramble now has a proper S3 object store again:
- Garage v2.2.0: 4 nodes on Pi 5s, 200GB effective capacity, replication factor 2
- Docker registry: Running on Garage S3 backend, push/pull verified
- Storage stack: NVMe SSDs → Longhorn (block) → Garage (object) → Applications
Next up: probably migrating Loki's storage to Garage as well. And maybe writing a more scathing obituary for MinIO.
Storage Benchmarks: SD Cards, USB Sticks, and the NVMe Promise
I now have three very different storage layers in the cluster: SD cards in every node, Longhorn on the Pi 5 NVMe drives, and Garage S3 on top of Longhorn. I've been assuming the NVMe setup is dramatically better than the SD cards, and assuming Garage adds acceptable overhead. Time to stop assuming and start measuring.
Also I found a random USB flash drive in a drawer and stuck it in Erenford. For science.
The Benchmark Script
I wrote a Python script (tools/storage-benchmark.py) that orchestrates the whole thing from my laptop. It creates a benchmark namespace with privileged pod security, deploys test Jobs, collects results, and cleans up after itself.
Three types of benchmarks:
- SD Card:
fioin an Alpine container, writing to/var/tmpvia hostPath on a Pi 4B (Talos) node. The/varpartition lives on the SD card. - USB Flash Drive:
fioin a privileged Alpine container, writing directly to the raw block device (/dev/sda). No filesystem overhead. Destructive, obviously. - Longhorn:
fioin an Alpine container, writing to a freshly provisioned 5Gi Longhorn PVC on a Pi 5 node. - Garage S3: A
boto3script running PUT/GET operations against Garage's S3 API with various object sizes (1KB to 10MB).
The fio tests cover sequential read/write (1MB blocks, iodepth=32) and random read/write (4K blocks, iodepth=16), each running for 30 seconds. direct=1 to bypass the page cache.
Container Image Fun
First attempt used ljishen/fio:latest. Immediate exec format error — no arm64 support. Tried xridge/fio:latest. Same thing. Turns out the standard fio container images are all amd64-only. The fix: just use alpine:latest and apk add fio at runtime. Alpine has fio 3.41 in its repos with proper arm64 builds. Adds maybe 3 seconds to job startup. Fine.
USB: Raw Block Device
The USB flash drive situation was more interesting. The stick shows up as /dev/sda (with two partitions from a previous life), but Talos doesn't auto-mount it. Erenford's talconfig.yaml has a userVolumes entry for USB disks, but that only provisions at install/boot time — hot-plugging doesn't trigger it.
For benchmarking that's actually perfect. No filesystem layer to muddy the numbers. fio writes directly to the raw block device from a privileged pod:
securityContext:
privileged: true
No volumes, no volume mounts. Just fio and a block device.
The Numbers
Full run: SD card on dalt (Pi 4B), USB flash drive on erenford (Pi 4B), Longhorn on manderly (Pi 5 NVMe), Garage S3 from a cluster pod.
Block Storage (fio, 30 seconds per test)
Metric SD Card USB Longhorn
---------------------------------------------------------------------
Seq Read (MB/s) 44.34 22.73 93.96
Seq Read IOPS 44.3 22.7 94.0
Seq Read Latency (ms) 713.22 1375.5 339.64
Seq Write (MB/s) 31.97 12.5 50.56
Seq Write IOPS 32.0 12.5 50.6
Seq Write Latency (ms) 982.17 2454.46 632.39
Rand Read 4K IOPS 3243.7 1255.8 7477.0
Rand Read 4K Lat (ms) 19.72 12.72 8.54
Rand Write 4K IOPS 722.7 214.7 4981.7
Rand Write 4K Lat (ms) 88.47 74.46 12.82
Object Storage (Garage S3, 20 iterations per size)
Size PUT ms GET ms PUT MB/s GET MB/s
------------------------------------------------------
1KB 29.79 19.19 0.03 0.05
64KB 54.37 20.06 1.15 3.12
1MB 79.26 42.69 12.62 23.43
10MB 340.15 143.6 29.4 69.64
Analysis
The USB Stick is Terrible
I don't know what I expected from a drawer-dwelling flash drive, but it's worse than the SD card across the board. Half the sequential throughput (23 MB/s read vs 44 MB/s), a third the random read IOPS (1,256 vs 3,244), and random write performance is genuinely painful at 215 IOPS. For reference, that's about what a floppy disk would do if floppy disks could do random I/O.
The one metric where USB is weirdly competitive is random read latency: 12.7ms vs the SD card's 19.7ms. I have no explanation for this. Flash controller firmware is dark magic.
I'm hoping that some newer flash drives will be more competitive so I can move etcd to USB flash drives and off the SD card. It'd be better if I had SSDs, but I'm not crazy about the Pi <-> USB <-> SSD chain - at least with the USB-to-SATA cables I have, which seem frightfully amenable to getting nudged out of place.
SD Cards Are Fine, Actually
The SD cards in the Pis are not embarrassing. 44 MB/s sequential read is reasonable for what they are, and 3,244 random read IOPS is enough for Talos's needs (read-heavy OS partition, mostly cached in memory anyway). The weak point is random writes — 723 IOPS at 88ms latency. Anything write-heavy (databases, etcd, logging) would suffer.
Good thing the control plane etcd runs on SD cards. 😐
NVMe Longhorn: Actually Fast
Longhorn on NVMe is roughly:
- 2x the SD card on sequential throughput (94 MB/s read, 51 MB/s write)
- 2.3x on random read IOPS (7,477 vs 3,244)
- 6.9x on random write IOPS (4,982 vs 723)
- 6.9x better random write latency (12.8ms vs 88.5ms)
That random write performance is the real story. The difference between 723 IOPS at 88ms and 4,982 IOPS at 13ms is the difference between "this database is weirdly slow" and "this is fine." Every stateful workload — Docker registry, Garage metadata, anything with a WAL — benefits enormously from being on Longhorn.
The sequential numbers are a bit underwhelming for NVMe — raw NVMe drives should push 500+ MB/s. Longhorn adds overhead: iSCSI transport, replica synchronization, filesystem-on-iSCSI. But ~94 MB/s is more than enough for anything this cluster is doing.
Garage S3: It's Object Storage
S3 numbers aren't directly comparable to block I/O, but they tell a useful story about overhead.
Small objects (1KB) have ~20-30ms round-trip latency. That's the HTTP + S3 protocol + Garage routing overhead floor. It doesn't matter how fast the underlying disk is — you're paying for the abstraction.
As objects get larger, throughput scales well. At 10MB: 29 MB/s PUT and 70 MB/s GET. That GET number is actually competitive with the raw SD card sequential read. For bulk data (Docker layers, log archives, backups), Garage's throughput is perfectly adequate.
The key insight: use the right storage for the right job. Need a database? Longhorn PVC. Need to store 500MB Docker layers? Garage is fine. Need to keep etcd running? Pray for my SD cards.
Running It
# Full suite
python3 tools/storage-benchmark.py --usb-node erenford --usb-dev /dev/sda
# Just block storage
python3 tools/storage-benchmark.py --skip-garage
# Just SD card vs Longhorn
python3 tools/storage-benchmark.py --skip-garage --skip-usb
# Different nodes
python3 tools/storage-benchmark.py --sd-node harlton --nvme-node oakheart
The script creates and destroys a benchmark namespace, temporary Garage credentials, and all Kubernetes resources on each run. No cleanup needed unless you --keep-namespace.
Gatus: A Declarative Status Page
The Case for a Status Page
The cluster has Prometheus, Alertmanager, Grafana, Loki — a full observability stack. But all of that is behind the cluster VPN. If I want to know whether things are healthy from my phone, or let anyone else see, there's no public-facing answer to "is the cluster up?"
Most status page tools solve this with a web UI: click to add endpoints, click to set thresholds, click to configure alerts. All the state lives in a database, invisible to Git, unreviewable, unreproducible. If the pod dies and the PVC is gone, you're rebuilding everything from memory.
Gatus takes the opposite approach. The entire configuration is a YAML file. Endpoints, conditions, alerts, UI settings — all in a ConfigMap. GitOps-native. If I nuke the deployment and redeploy from the repo, I get the exact same status page back. No clicking required, ever.
The Deployment
Gatus runs as a single-replica Deployment in the gatus namespace with a Longhorn PVC for SQLite history and an HTTPRoute on the Cilium gateway for status.goldentooth.net.
The interesting part is the config. Here's the shape of it:
ui:
title: Goldentooth Cluster Status
header: Goldentooth
storage:
type: sqlite
path: /data/gatus.db
endpoints:
- name: Kubernetes API
group: infrastructure
url: https://cp.k8s.goldentooth.net:6443/healthz
client:
insecure: true
interval: 1m
conditions:
- "[STATUS] == any(200, 401)"
- name: Grafana
group: cluster
url: http://monitoring-kube-prometheus-stack-grafana.monitoring.svc.cluster.local:80/login
interval: 2m
conditions:
- "[STATUS] == 200"
- "[RESPONSE_TIME] < 3000"
# ... 12 more endpoints ...
14 endpoints total across three groups: infrastructure (Kubernetes API), cluster (Grafana, Prometheus, Alertmanager, Loki, Tempo, Docker Registry, Step CA, Blackbox Exporter), apps (httpbin, ntfy, JupyterLab), and external (goldentooth.net, clog.goldentooth.net).
The Kubernetes API endpoint deserves a note. Talos locks down the API server — unauthenticated requests to /healthz get a 401, not a 200. Most status tools would call that "down." Gatus lets you express [STATUS] == any(200, 401) as a condition, which is exactly the kind of thing you can do when your health checks are code instead of radio buttons.
The ConfigMap is mounted via subPath, which means Kubernetes won't auto-update it when the ConfigMap changes. You have to delete the pod to pick up config changes. Mildly annoying, but it prevents mid-flight config reloads from causing weird state.
One deployment quirk: the Longhorn PVC is RWO, so I had to set strategy.type: Recreate on the Deployment. Otherwise Kubernetes tries to spin up the new pod before killing the old one, the new pod can't mount the volume, and the rollout deadlocks forever. RWO footgun.
Prometheus Metrics
Gatus has a built-in Prometheus metrics endpoint. You turn it on with a single line:
metrics: true
That's it. That's the config. Gatus starts exposing /metrics on the same port as the UI (8080), and you get counters like gatus_results_total broken down by endpoint, success/failure, and HTTP status code. Free time-series data about every health check, bolted straight into the existing Prometheus/Grafana stack.
The ServiceMonitor was straightforward:
apiVersion: monitoring.coreos.com/v1
kind: ServiceMonitor
metadata:
name: gatus
namespace: gatus
labels:
release: monitoring-kube-prometheus-stack
spec:
selector:
matchLabels:
app: gatus
endpoints:
- port: http
path: /metrics
interval: 30s
...except I initially got the label wrong. Used release: kube-prometheus-stack because that's what the Blackbox Exporter's ServiceMonitor uses. Prometheus ignored it completely. No errors, no warnings, just silence — the Prometheus operator's favorite way to tell you you're wrong.
Turns out the actual selector the operator is looking for is release: monitoring-kube-prometheus-stack. The Blackbox Exporter's ServiceMonitor had the wrong label too, it was just getting scraped via a different mechanism. I found the truth by checking what Prometheus actually expects:
kubectl get prometheus -n monitoring -o jsonpath='{.items[0].spec.serviceMonitorSelector}'
{"matchLabels":{"release":"monitoring-kube-prometheus-stack"}}
Fixed the label. Prometheus immediately picked it up. gatus_results_total started flowing. I could now query things like "show me the 99th percentile response time for the Kubernetes API health endpoint over the last 24 hours" and get an actual answer.
I also had to add an app: gatus label to the Service itself, since the ServiceMonitor needs to select the Service by label and it didn't have one. The kind of thing you miss when you write manifests by hand instead of using Helm charts that wire everything together automatically.
ntfy Alerting
Gatus supports ntfy as a native alerting provider. We already have ntfy running in the cluster (deployed back in entry 090), and Alertmanager is already sending Prometheus alerts to it via webhook. Adding Gatus alerts to the same notification pipe was trivial:
alerting:
ntfy:
url: http://ntfy.ntfy.svc.cluster.local
topic: gatus-alerts
priority: 3
default-alert:
failure-threshold: 3
success-threshold: 2
send-on-resolved: true
Separate topic from Alertmanager (gatus-alerts vs cluster-alerts) so I can tell at a glance whether it's a Prometheus rule firing or a Gatus endpoint going dark. Priority 3 (default) because these are "hey, something's not responding" checks, not "the cluster is on fire" alerts.
The default-alert block means I don't have to repeat the thresholds on every endpoint. Each endpoint just needs:
alerts:
- type: ntfy
Added that to all 12 internal endpoints — everything in the cluster, infrastructure, and apps groups. The two external endpoints (goldentooth.net and clog.goldentooth.net) don't get alerts because they're hosted on GitHub Pages and Cloudflare, and there's not a lot I can do if GitHub goes down besides join the collective screaming on social media.
The Circularity Problem
There is one entertaining little issue: Gatus monitors ntfy and alerts via ntfy. If ntfy goes down, Gatus will dutifully try to send a "ntfy is down" notification to... ntfy. Which is down. So I'll never get that particular alert.
This is fine. Alertmanager independently monitors ntfy via Prometheus metrics, and Alertmanager has its own webhook to ntfy, so... wait. That's the same problem. If ntfy is truly dead, neither system can notify me through the ntfy channel.
The real safety net is that Prometheus also fires PodCrashLooping and PodNotReady alerts, which would go through Alertmanager's webhook to ntfy. So we're still circular. In practice, ntfy has never gone down, and if it does, I'll notice when my phone stops buzzing about routine things. The absence of notifications is the notification. Zen monitoring.
Status Badges
Gatus exposes SVG badges for every endpoint — health status and uptime percentage. The URLs follow a predictable pattern:
https://status.goldentooth.net/api/v1/endpoints/{key}/health/badge.svg
https://status.goldentooth.net/api/v1/endpoints/{key}/uptimes/7d/badge.svg
The {key} is {group}_{name} with special characters replaced by hyphens. So infrastructure/Kubernetes API becomes infrastructure_kubernetes-api, cluster/Step CA becomes cluster_step-ca, etc.
Added a badge table to the GitHub org profile README template:
| Service | Health | Uptime (7d) |
| -------------- | -------------- | -------------- |
| Kubernetes API |  |  |
| Prometheus |  |  |
| Grafana |  |  |
| Step CA |  |  |
Four key services. Kubernetes API because it's the beating heart. Prometheus and Grafana because they're the eyes. Step CA because it's the PKI root and if it's down, certificates stop renewing. Anyone visiting the GitHub org page now gets live health and uptime badges, which is either impressively professional or deeply unnecessary for a home cluster. Both, probably.
The Result
The cluster now has a proper declarative status page at status.goldentooth.net, backed by a single ConfigMap in Git. It monitors 14 endpoints, pushes metrics to Prometheus, sends failure notifications to my phone via ntfy, and exposes live badges on the GitHub org profile.
The full manifest set:
gitops/apps/gatus/
├── kustomization.yaml
├── namespace.yaml
├── configmap.yaml # The entire Gatus config
├── deployment.yaml
├── service.yaml
├── pvc.yaml # 1Gi Longhorn for SQLite
├── httproute.yaml # status.goldentooth.net
└── servicemonitor.yaml # Prometheus scraping
Everything declarative, everything in Git, everything recoverable from a git push.
Chaos Mesh: Replacing Litmus Because MongoDB Was Doing Nothing at 38% CPU
The Audit
Three months ago, I deployed Litmus into the cluster (entry 085). That was a whole thing — hours of fighting ARM64 MongoDB incompatibilities, heterogeneous node placement, Bitnami image shenanigans. I was so happy when it finally worked that I... never actually ran an experiment.
Not one.
Ninety-one days. Zero experiments. Four pods sitting there. A full MongoDB replica set, faithfully consuming resources to store nothing.
I discovered this during a broader cluster cleanup session. A KubeAPIErrorBudgetBurn alert fired, which led me down a long path of investigating etcd I/O pressure on the control plane's SD cards. While auditing workload overhead, I found that Tekton had 39 leases generating constant PUT traffic with 0 pipelines, KubeVirt had 22 pods with 0 VMs, and Litmus was just... sitting there. Being expensive.
The bit that made me snap was checking kubectl top pod on the Litmus namespace:
litmus-auth-server-db74677b9-h5lk7 8m 95Mi
litmus-frontend-78bd5df698-6kb57 1m 42Mi
litmus-mongodb-0 147m 180Mi
litmus-server-7ddb7b874f-64gtv 12m 131Mi
147 millicores. Just MongoDB. Just vibing. Doing absolutely nothing. Its CPU limit was 500m and it was throttling at 38%.
Jesus Christ.
Why Litmus Was Wrong for This Cluster
In retrospect, Litmus ChaosCenter was always overkill here. It's designed for teams — a web UI for designing experiments, a MongoDB backend for storing execution history, authentication servers, GraphQL APIs. That's great if you have a team of SREs running coordinated chaos engineering campaigns against production.
I have 16 Raspberry Pis and... neuroses?
The ChaosCenter architecture meant I was running:
- MongoDB (via Bitnami, as a replica set even though there's one member) — the storage hog
- GraphQL server — orchestration API nobody was calling
- Auth server — authentication nobody was using
- Frontend — a React app nobody was viewing
All pinned to Pi 5 nodes because MongoDB requires ARMv8.2-A CPU instructions. All consuming resources. All doing nothing.
Enter Chaos Mesh
Chaos Mesh is a CNCF Incubating project that takes a fundamentally different approach: everything is a CRD.
No database. No UI server (optional, and I'm not deploying it). No auth layer. State lives where Kubernetes state already lives — in etcd, as Custom Resources. The controller-manager watches for chaos CRDs and orchestrates fault injection through the chaos-daemon DaemonSet.
That's it. That's the whole architecture:
- Controller Manager — watches chaos CRDs, coordinates experiments
- Chaos Daemon — runs on target nodes, performs the actual fault injection (network chaos via
tc, I/O faults, process manipulation, etc.) - CRDs — 23 of them, covering everything from
PodChaostoNetworkChaostoIOChaostoKernelChaos
This fits my GitOps workflow perfectly. Define an experiment as YAML, commit it to the repo, Flux applies it. Or kubectl apply it directly if I just want to break something right now. No UI needed.
The Swap
Ripping Out Litmus
First, surgical removal from the gitops repo:
# Deleted entirely
infrastructure/litmus/release.yaml
infrastructure/litmus/namespace.yaml
infrastructure/litmus/admin-secret.yaml
infrastructure/litmus/kustomization.yaml
infrastructure/gateway/routes/litmus.yaml
# Modified
infrastructure/kustomization.yaml → removed litmus, added chaos-mesh
infrastructure/gateway/routes/kustomization.yaml → removed litmus.yaml
infrastructure/gateway/reference-grant.yaml → removed litmus namespace
Then cluster cleanup:
$ kubectl delete helmrelease litmus -n litmus
helmrelease.helm.toolkit.fluxcd.io "litmus" deleted
$ kubectl delete helmrepository litmuschaos -n flux-system
helmrepository.source.toolkit.fluxcd.io "litmuschaos" deleted
$ kubectl delete pvc datadir-litmus-mongodb-0 -n litmus
persistentvolumeclaim "datadir-litmus-mongodb-0" deleted
$ kubectl delete crd chaosexperiments.litmuschaos.io
customresourcedefinition.apiextensions.k8s.io "chaosexperiments.litmuschaos.io" deleted
$ kubectl delete ns litmus
namespace "litmus" deleted
Goodbye, old friend. We barely knew each other.
Deploying Chaos Mesh
The new gitops structure:
infrastructure/chaos-mesh/
├── kustomization.yaml
├── namespace.yaml # privileged PSA (chaos daemons need it)
├── repository.yaml # charts.chaos-mesh.org
└── release.yaml # The Helm release
The release values are minimal:
values:
controllerManager:
replicaCount: 1
nodeSelector:
cpu.arch: armv8.2-a
resources:
requests:
cpu: 25m
memory: 128Mi
limits:
cpu: 250m
memory: 512Mi
chaosDaemon:
nodeSelector:
cpu.arch: armv8.2-a
resources:
requests:
cpu: 25m
memory: 64Mi
limits:
cpu: 250m
memory: 256Mi
dashboard:
create: false
dnsServer:
create: false
One controller. Daemons only on Pi 5 nodes. No dashboard. No DNS server (that's only for DNSChaos experiments, enable it when I need it).
Push, wait for Flux, and:
$ kubectl get pods -n chaos-mesh -o wide
NAME READY STATUS NODE
chaos-controller-manager-57fd584568-wkj4s 1/1 Running norcross
chaos-daemon-67qws 1/1 Running manderly
chaos-daemon-hh4xd 1/1 Running norcross
chaos-daemon-xscmv 1/1 Running payne
chaos-daemon-xvmd5 1/1 Running oakheart
Five pods. All running. 23 CRDs installed.
First Blood
Time to actually do the thing I never did with Litmus — run a chaos experiment.
Target: httpbin. It's expendable, it's simple, and it'll prove the system works.
First, confirm it's alive:
$ kubectl run curl-test --rm -it --restart=Never --image=busybox \
-- wget -qO- http://httpbin.httpbin.svc.cluster.local/get
{
"args": {},
"headers": {
"Host": ["httpbin.httpbin.svc.cluster.local"],
"User-Agent": ["Wget"]
},
"method": "GET",
"origin": "10.244.19.205",
"url": "http://httpbin.httpbin.svc.cluster.local/get"
}
Now kill it:
apiVersion: chaos-mesh.org/v1alpha1
kind: PodChaos
metadata:
name: kill-httpbin
namespace: chaos-mesh
spec:
action: pod-kill
mode: one
selector:
namespaces:
- httpbin
labelSelectors:
app: httpbin
$ kubectl apply -f - <<< '...'
podchaos.chaos-mesh.org/kill-httpbin created
Immediately:
$ kubectl get podchaos -n chaos-mesh kill-httpbin -o yaml | grep -A5 "phase:"
phase: Injected
$ kubectl get events -n httpbin --sort-by='.lastTimestamp' | tail -5
Normal Killing pod/httpbin-76fcc48b8-9gvt5 Stopping container httpbin
Normal SuccessfulCreate replicaset/httpbin-76fcc48b8 Created pod: httpbin-76fcc48b8-bskwx
Normal Pulling pod/httpbin-76fcc48b8-bskwx Pulling image "mccutchen/go-httpbin"
Normal Pulled pod/httpbin-76fcc48b8-bskwx Successfully pulled image in 573ms
Normal Started pod/httpbin-76fcc48b8-bskwx Started container httpbin
Pod killed. New pod up in under a second. Service recovered. The Deployment's replica set did exactly what it's supposed to do.
Verify:
$ kubectl run curl-test2 --rm -it --restart=Never --image=busybox \
-- wget -qO- http://httpbin.httpbin.svc.cluster.local/status/200
200 OK. Clean.
$ kubectl delete podchaos kill-httpbin -n chaos-mesh
podchaos.chaos-mesh.org "kill-httpbin" deleted
Experiment complete. It was anticlimactic in the best possible way.
The Numbers
Resource comparison:
| What | Pods | CPU (idle) | Memory |
|---|---|---|---|
| Litmus | 4 (+ MongoDB StatefulSet) | ~168m | ~448Mi |
| Chaos Mesh | 5 (1 controller + 4 daemons) | ~9m | ~61Mi |
That's a 95% reduction in CPU and 86% reduction in memory.
What's Next
The chaos-daemons are currently restricted to Pi 5 nodes. For PodChaos experiments (pod-kill, pod-failure), that doesn't matter — the controller handles those via the Kubernetes API. But for the interesting stuff — network latency injection, I/O faults, kernel chaos — the daemon needs to be on the same node as the target. I'll expand the node selector when I start running those experiments.
The 23 CRDs are sitting there ready:
PodChaos— kill, failure, container killNetworkChaos— latency, loss, corruption, partition, bandwidthIOChaos— latency, fault, attribute override for filesystem operationsStressChaos— CPU and memory stressHTTPChaos— HTTP request/response manipulationTimeChaos— clock skewKernelChaos— kernel fault injection
The plan is to build out a library of experiments in the gitops repo and run them as part of a regular chaos engineering practice. Scheduled experiments via Schedule CRDs, targeted at specific services during non-peak hours (not that there are peak hours on a homelab, but establishing good habits).
But first I have to make something worth breaking. The httpbin kill was satisfying in a primal way, but it's not exactly testing system resilience. That comes next.
SeaweedFS: Replacing Longhorn, Third Time's the Charm
The Backdrop
SeaweedFS and I have history. Deployed it on USB SSDs (chapter 63), tore it down, put it back on USB SSDs via the operator (chapter 79), watched it die when someone bumped the USB-to-SATA cables (physically, not metaphorically), deployed Longhorn (chapter 92), and now here we are. Going back to SeaweedFS. On the same NVMe drives. Using the same mount path.
The difference this time: NVMe HATs. No more USB-to-SATA cables to bump. The drives are bolted directly to the Pi 5 boards. You'd have to physically disassemble a node to disconnect one. That's the kind of reliability guarantee I can respect.
Why leave Longhorn? It worked fine, honestly. 30 pods across the cluster, decent performance, web UI for when I wanted to stare at disk utilization bars. But it was heavier than it needed to be — DaemonSets on every node, iSCSI plumbing, an engine image DaemonSet, instance managers spawning per-node, CSI plugins everywhere. And the volumes were physically constrained to the 4 NVMe nodes, which meant things like Prometheus and Alertmanager needed nodeSelector configs to land on NVMe nodes. SeaweedFS with a CSI driver lets any pod on any node mount a volume — the CSI mount DaemonSet runs everywhere and talks to the filer over the network.
The plan: deploy SeaweedFS server (master + volume + filer), deploy the CSI driver, migrate every Longhorn consumer, then nuke Longhorn from orbit.
The Architecture
SeaweedFS this time is simpler than my previous deployments. No operator, no S3 API, no workers. Just the Helm chart:
- 1 Master: Cluster coordinator. Handles volume allocation, topology. Runs on an NVMe node.
- 4 Volume Servers: One per Pi 5 NVMe node. Stores actual data on
/var/lib/longhorn(yes, still called that — the TalosuserVolumesconfig names the NVMe mount and I'm not renaming it). Replication set to001— one extra copy on a different volume server. - 1 Filer: Filesystem abstraction over the volume servers. Uses LevelDB2 for metadata. Runs on an NVMe node.
For the CSI driver:
- 1 Controller: Handles CreateVolume/DeleteVolume.
- 14 Node DaemonSet pods: Run on every worker node. Handle NodePublishVolume.
- 14 Mount DaemonSet pods: Run on every worker node. Provide the FUSE mount service so volumes can be mounted anywhere in the cluster.
Total pod count: 6 server + ~29 CSI = ~35 pods. Longhorn was 30 pods. Slightly more, but the SeaweedFS CSI pods are tiny and the tradeoff is that workloads aren't pinned to NVMe nodes anymore.
Deploying the Server
Standard Flux CD structure — six files in gitops/infrastructure/seaweedfs/:
seaweedfs/
├── kustomization.yaml
├── namespace.yaml # seaweedfs, privileged PSA (for hostPath)
├── server-repository.yaml # HelmRepository → seaweedfs.github.io/seaweedfs/helm
├── server-release.yaml # HelmRelease for master/volume/filer
├── csi-repository.yaml # HelmRepository → seaweedfs.github.io/seaweedfs-csi-driver/helm
└── csi-release.yaml # HelmRelease for CSI driver
Key server values:
global:
enableReplication: true
replicationPlacement: "001"
master:
replicas: 1
data:
type: "hostPath"
hostPathPrefix: /var/lib/longhorn
nodeSelector: |
node.kubernetes.io/disk-type: nvme
affinity: "" # allow co-location
volume:
replicas: 4
dataDirs:
- name: data1
type: "hostPath"
hostPathPrefix: /var/lib/longhorn
maxVolumes: 0
nodeSelector: |
node.kubernetes.io/disk-type: nvme
filer:
replicas: 1
data:
type: "hostPath"
hostPathPrefix: /var/lib/longhorn
nodeSelector: |
node.kubernetes.io/disk-type: nvme
affinity: ""
The affinity: "" on master and filer overrides the chart's default anti-affinity, letting them co-locate on the same NVMe node. With only 4 NVMe nodes and 6 server pods, some sharing is inevitable.
Committed, pushed, waited for Flux. All six server pods came up without drama.
$ kubectl get pods -n seaweedfs
NAME READY STATUS RESTARTS AGE
seaweedfs-filer-0 2/2 Running 0 3m
seaweedfs-master-0 1/1 Running 0 3m
seaweedfs-volume-0 1/1 Running 0 3m
seaweedfs-volume-1 1/1 Running 0 3m
seaweedfs-volume-2 1/1 Running 0 3m
seaweedfs-volume-3 1/1 Running 0 3m
The CSI Driver: A Two-Bug Symphony
The CSI driver was less cooperative.
Bug 1: The Phantom Flag
The CSI node DaemonSet immediately crashed:
flag provided but not defined: -mountEndpoint
Turns out the chart (v0.2.11) generates a --mountEndpoint flag for the new mount service feature, but the latest Docker image tag doesn't actually include it. The latest tag on Docker Hub is stale — it's some ancient build that predates the mount service feature entirely. Classic.
Bug 2: The Missing Node ID
The CSI controller also refused to start:
Precondition failed: driver requires node id to be set, use -nodeid=
The chart doesn't pass --nodeid to the controller pod. This might be fine for newer versions of the binary, but the latest image was too old to handle it gracefully.
The Fix
Both bugs had the same root cause: the latest Docker tag was garbage. Pinning all three images (controller, node plugin, mount service) to v1.4.5:
csiDriverImages:
controller:
repository: chrislusf/seaweedfs-csi-driver
tag: "v1.4.5"
node:
repository: chrislusf/seaweedfs-csi-driver
tag: "v1.4.5"
mount:
repository: chrislusf/seaweedfs-csi-driver
tag: "v1.4.5"
Fixed both issues. The v1.4.5 binary supports --mountEndpoint and handles the missing nodeid for controller mode.
Bug 3: The DNS Trap
After the images were fixed, the CSI driver still couldn't create volumes. The filer address was wrong:
seaweedfsFiler: "seaweedfs-filer.seaweedfs.svc.cluster.local:8888"
But the actual service name is:
seaweedfsFiler: "seaweedfs-seaweedfs-filer.seaweedfs.svc.cluster.local:8888"
The Helm chart prefixes service names with {release-name}-{chart-name}-{component}. Since both the release and chart are named "seaweedfs," you get seaweedfs-seaweedfs-filer. Beautiful.
After that fix, the CSI driver was fully operational. Created a test PVC, wrote data, read it back. SeaweedFS works.
The Migration
Thirteen PVCs to migrate, across four namespaces. All using storageClassName: longhorn, all needing to switch to storageClassName: seaweedfs.
The Easy Ones: Gatus
One PVC, one Deployment. Changed the storageClass in gitops/apps/gatus/pvc.yaml, deleted the old PVC, let Flux recreate it. Done.
The StatefulSet Conundrum: Garage
Garage has 8 PVCs (4 data + 4 meta) attached via VolumeClaimTemplates on a StatefulSet. Kubernetes doesn't let you modify VolumeClaimTemplates on existing StatefulSets. So:
- Update storageClass in
gitops/infrastructure/garage/statefulset.yaml - Delete all 8 PVCs
- Delete the StatefulSet
- Let Flux recreate everything fresh
All 8 PVCs came back on SeaweedFS. Garage spent a while rebuilding its metadata ring from scratch (lots of restarts, nodes rediscovering each other), but that was expected.
Prometheus and Alertmanager
The kube-prometheus-stack operator manages its own StatefulSets. Changed storageClassName in the HelmRelease values, plus removed the nodeSelector constraints — no longer needed since SeaweedFS CSI serves volumes to any node.
# Before
prometheus:
prometheusSpec:
storageSpec:
volumeClaimTemplate:
spec:
storageClassName: longhorn
nodeSelector:
node.kubernetes.io/disk-type: nvme
# After
prometheus:
prometheusSpec:
storageSpec:
volumeClaimTemplate:
spec:
storageClassName: seaweedfs
# no nodeSelector — any node can mount SeaweedFS volumes
Deleted the StatefulSets and PVCs, operator recreated them. Both came up on SeaweedFS.
Loki and Tempo: The Helm Release Hell
This is where things got interesting. "Interesting" as in "I spent an hour fighting Flux's Helm controller."
Loki and Tempo both use StatefulSets with VolumeClaimTemplates. Updated the storageClass in both HelmRelease values. But Helm tried to do an upgrade, which hit the immutable VolumeClaimTemplate wall:
Helm upgrade failed: cannot patch "monitoring-loki" with kind StatefulSet:
StatefulSet.apps "monitoring-loki" is invalid: spec: Forbidden: updates to
statefulset spec for fields other than 'replicas', 'ordinals', 'template',
'updateStrategy', 'revisionHistoryLimit', 'persistentVolumeClaimRetentionPolicy'
and 'minReadySeconds' are forbidden
OK, delete the StatefulSets so the upgrade can recreate them. But now the Helm rollback mechanism kicked in — upgrade failed, so Flux tried to rollback. The rollback failed because the StatefulSet no longer existed:
Helm rollback failed: statefulsets.apps "monitoring-loki" not found
Now we're in a loop: upgrade fails (VCT immutable) → rollback fails (StatefulSet missing) → repeat forever.
I tried:
- Deleting the HelmRelease CRs (Flux recreated them from Git, but the Helm release secrets persisted)
- Suspending and resuming (same loop)
helm uninstall(release not found — becausehelm listshowed nothing)
The mystery: helm list -n monitoring -a showed zero releases, but Flux was clearly finding Helm state somewhere. Turns out Flux stores its Helm release secrets in the flux-system namespace, not the target namespace. That's why helm list showed nothing — it was looking in the wrong namespace.
$ kubectl get secrets -n flux-system -l owner=helm | grep loki
sh.helm.release.v1.monitoring-loki.v66 helm.sh/release.v1 1 30h
sh.helm.release.v1.monitoring-loki.v68 helm.sh/release.v1 1 9m
sh.helm.release.v1.monitoring-loki.v69 helm.sh/release.v1 1 7m
sh.helm.release.v1.monitoring-loki.v70 helm.sh/release.v1 1 2m
sh.helm.release.v1.monitoring-loki.v71 helm.sh/release.v1 1 2m
There's the bastard. v66 was the original, and v68-v71 were failed upgrade/rollback attempts piling up.
The fix:
# 1. Suspend HelmReleases
kubectl patch hr loki -n flux-system --type merge -p '{"spec":{"suspend":true}}'
kubectl patch hr tempo -n flux-system --type merge -p '{"spec":{"suspend":true}}'
# 2. Delete ALL Helm release secrets
kubectl delete secrets -n flux-system -l name=monitoring-loki
kubectl delete secrets -n flux-system -l name=monitoring-tempo
# 3. Delete StatefulSets and old PVCs
kubectl delete sts monitoring-loki monitoring-tempo -n monitoring
kubectl delete pvc storage-monitoring-loki-0 storage-monitoring-tempo-0 -n monitoring --force
# 4. Resume — Flux does a fresh install
kubectl patch hr loki -n flux-system --type merge -p '{"spec":{"suspend":false}}'
kubectl patch hr tempo -n flux-system --type merge -p '{"spec":{"suspend":false}}'
Both came up with fresh installs on SeaweedFS PVCs:
NAME READY STATUS
loki True Helm install succeeded for release monitoring/monitoring-loki.v1
tempo True Helm install succeeded for release monitoring/monitoring-tempo.v1
Note the v1 — clean slate.
Removing Longhorn
With zero Longhorn PVCs remaining:
$ kubectl get pvc -A | grep longhorn
<nothing>
The removal was straightforward:
- Removed
longhornfromgitops/infrastructure/kustomization.yaml - Deleted
gitops/infrastructure/longhorn/directory (4 files) - Committed and pushed
- Flux pruned the HelmRelease automatically (pruning enabled on the infrastructure kustomization)
- Cleaned up Helm release secrets from flux-system namespace
- Deleted all 22 Longhorn CRDs manually
- Removed the validating/mutating webhook configurations
- Cleared finalizers on stuck EngineImage and Node CRD resources
The longhorn-system namespace got stuck in Terminating state because the admission webhook was gone but CRD resources still had longhorn.io finalizers:
Failed to delete all resource types, 1 remaining: Internal error occurred:
failed calling webhook "validator.longhorn.io": service
"longhorn-admission-webhook" not found
Classic chicken-and-egg — the webhook service was deleted but K8s was still trying to validate resource deletions through it. Deleting the webhook configurations and patching out the finalizers unstuck it.
Final State
All 13 PVCs across the cluster are now on SeaweedFS:
| Namespace | PVC | Size | Purpose |
|---|---|---|---|
| garage | data-garage-{0..3} | 100Gi x4 | S3 object storage data |
| garage | meta-garage-{0..3} | 1Gi x4 | Garage metadata |
| gatus | gatus-data | 1Gi | Status page data |
| monitoring | prometheus-...-0 | 16Gi | Prometheus TSDB |
| monitoring | alertmanager-...-0 | 1Gi | Alertmanager state |
| monitoring | storage-monitoring-loki-0 | 16Gi | Log storage |
| monitoring | storage-monitoring-tempo-0 | 10Gi | Trace storage |
StorageClasses remaining: seaweedfs, local-path, local-path-usb. No more longhorn.
SeaweedFS server: 6 pods. CSI driver: ~29 pods (mostly DaemonSets). Nothing is constrained to NVMe nodes anymore — any pod on any of the 14 worker nodes can mount a SeaweedFS volume. The actual data lives on the 4 NVMe drives with 001 replication, so everything has a copy on a different volume server.
Third time deploying SeaweedFS on this cluster. This time the drives are physically bolted to the boards. I'm cautiously optimistic. Famous last words.
Collateral Damage: Garage, Docker Registry, and SOPS Ergonomics
The Fallout
So the SeaweedFS migration (chapter 97) went great. All PVCs migrated, Longhorn nuked, everyone's happy. Except for one small detail I didn't think about until things started crashing: Garage stores its entire world — cluster layout, S3 keys, bucket definitions — on those PVCs. New PVCs means new Garage. Completely blank Garage. Garage with amnesia.
The symptom was immediate: all four Garage pods went into CrashLoopBackOff. The liveness probe hits /health on the admin API, but a Garage node with no cluster layout returns 503 on /health. Pod starts, probe fires, 503, Kubernetes kills it, repeat forever. The classic "I'm not healthy because nobody's told me what health means" problem.
Rebuilding Garage's Brain
The Liveness Trap
First thing: stop Kubernetes from killing the pods long enough to actually configure them. Bumped the liveness probe failureThreshold to 100 (essentially "try for 50 minutes before giving up"):
livenessProbe:
httpGet:
path: /health
port: 3903
initialDelaySeconds: 10
periodSeconds: 30
failureThreshold: 100
Pushed, waited for pods to stabilize in Running state (still failing health checks, but not getting killed).
Applying the Layout
Garage v2 admin API. Port-forwarded to one of the pods:
kubectl -n garage port-forward pod/garage-0 3903:3903 &
ADMIN_TOKEN=$(kubectl -n garage get secret garage-secrets -o jsonpath='{.data.admin-token}' | base64 -d)
First, get the node IDs. Each Garage pod generates a random node ID on first start:
curl -s -H "Authorization: Bearer $ADMIN_TOKEN" http://localhost:3903/v2/GetClusterStatus
This returns each node's ID, hostname, and whether it has a role assigned (none of them did, obviously).
Now the fun part. Garage's v2 API for updating the cluster layout took me a few tries to figure out. The format is:
curl -X POST -H "Authorization: Bearer $ADMIN_TOKEN" \
-H "Content-Type: application/json" \
http://localhost:3903/v2/UpdateClusterLayout \
-d '{"roles":[
{"id":"<node-id>","zone":"dc1","capacity":1000000000,"tags":["nvme"]},
{"id":"<node-id>","zone":"dc1","capacity":1000000000,"tags":["nvme"]},
{"id":"<node-id>","zone":"dc1","capacity":1000000000,"tags":["nvme"]},
{"id":"<node-id>","zone":"dc1","capacity":1000000000,"tags":["nvme"]}
]}'
Then apply:
curl -X POST -H "Authorization: Bearer $ADMIN_TOKEN" \
-H "Content-Type: application/json" \
http://localhost:3903/v2/ApplyClusterLayout \
-d '{"version":1}'
After that, /health started returning 200, the liveness probes went green, all four pods showed Running with 0 restarts. Health check confirmed: 4 nodes connected, 256 partitions, all assigned.
Reverted the failureThreshold back to a sane default afterward.
Docker Registry: The Other Casualty
With Garage rebuilt from scratch, the docker-registry deployment was the next domino. It stores container images in a Garage S3 bucket called docker-registry. That bucket? Gone. The S3 access key? Also gone. CrashLoopBackOff.
The fix was mechanical — recreate everything through the Garage v2 admin API:
# Create a new S3 key
curl -X POST -H "Authorization: Bearer $ADMIN_TOKEN" \
-H "Content-Type: application/json" \
http://localhost:3903/v2/CreateKey \
-d '{"name":"docker-registry"}'
# Create the bucket
curl -X POST -H "Authorization: Bearer $ADMIN_TOKEN" \
-H "Content-Type: application/json" \
http://localhost:3903/v2/CreateBucket \
-d '{"globalAlias":"docker-registry"}'
# Grant permissions
curl -X POST -H "Authorization: Bearer $ADMIN_TOKEN" \
-H "Content-Type: application/json" \
http://localhost:3903/v2/AllowBucketKey \
-d '{"bucketId":"<bucket-id>","accessKeyId":"<key-id>","permissions":{"read":true,"write":true,"owner":true}}'
Patched the Kubernetes secret with the new credentials, restarted the deployment. Registry came up 1/1, 0 restarts.
But now the SOPS-encrypted secret in Git still had the old credentials. Next Flux reconciliation would overwrite the working K8s secret with dead creds. Needed to decrypt, update, re-encrypt.
The SOPS Problem
$ sops decrypt infrastructure/docker-registry/registry-s3-secret.yaml
Failed to get the data key required to decrypt the SOPS file.
Right. The age private key. It's in 1Password. I know this because cluster/talenv.yaml already has:
SOPS_AGE_KEY_CMD: 'op read op://Goldentooth/talhelper_age_key/password'
That's talhelper's native support for fetching the key from 1Password. But SOPS_AGE_KEY_CMD is a talhelper thing, not a SOPS thing. SOPS itself wants SOPS_AGE_KEY or SOPS_AGE_KEY_FILE as environment variables. And there are actually two age keys — one for cluster/ (talhelper) and one for gitops/ (Flux). Two different recipients, two different private keys, both in 1Password.
Previously I was just copy-pasting the key from 1Password into the terminal every time I needed to decrypt something. This is, technically, a workflow. It is not a good workflow.
The Fix: direnv + 1Password CLI
Installed direnv, created .envrc at the project root:
# Pull SOPS age keys from 1Password automatically.
# Both keys are needed: talhelper for cluster/, flux for gitops/.
TALHELPER_KEY="$(op read op://Goldentooth/talhelper_age_key/password)"
FLUX_KEY="$(op read op://Goldentooth/flux_age_key/password)"
export SOPS_AGE_KEY="$TALHELPER_KEY
$FLUX_KEY"
SOPS_AGE_KEY supports multiple keys separated by newlines. SOPS tries each one until it finds a match. So now cd-ing into the project directory automatically loads both keys from 1Password, and sops decrypt just works against any encrypted file in either subdirectory.
$ cd ~/Projects/goldentooth
direnv: loading ~/Projects/goldentooth/.envrc
direnv: export +SOPS_AGE_KEY
$ sops decrypt gitops/infrastructure/docker-registry/registry-s3-secret.yaml
apiVersion: v1
kind: Secret
...
accesskey: GK42ea6fa0e627dcb58e7cef67
secretkey: <redacted>
$ sops decrypt cluster/talsecret.sops.yaml
cluster:
id: <redacted>
...
No more copy-pasting keys from 1Password. The op read command handles authentication through the 1Password desktop app or Touch ID, depending on your setup. The .envrc is in .gitignore so it doesn't get committed.
Updated the SOPS secret with the new Garage credentials, committed, and now Flux won't blow away the working credentials on its next reconciliation.
Falco: Runtime Security for the Bramble
Why Runtime Security?
I've got observability coming out of my ears at this point. Prometheus scrapes everything that moves, Loki ingests every log line, Tempo traces requests across services, Alloy shuttles telemetry around, Gatus checks endpoints, Blackbox Exporter probes from the outside. I can tell you exactly how many bytes Garage wrote to disk at 3:47 AM last Tuesday. What I couldn't tell you is whether something inside a container just read /etc/shadow or opened a reverse shell.
Falco fills that gap. It's a CNCF graduated project that uses eBPF to monitor syscalls at the kernel level — every open(), connect(), execve(), dup() across every container on every node. The default ruleset catches the classics: sensitive file reads, unexpected network connections, privilege escalation, container escapes, crypto mining processes. It's the security equivalent of "I don't know what I'm looking for, but I'll know it when I see it."
The Deployment
Architecture
Falco runs as a DaemonSet — one pod per node. Each pod loads an eBPF probe into the kernel and watches syscalls in real time. Events matching rules get forwarded to Falcosidekick, which fans them out to:
- Alertmanager (via v2 API) — for warnings and above, integrating with existing Prometheus alerting
- ntfy (via webhook) — for critical events only, because I don't need my phone buzzing every time nic-watchdog pings the gateway
The whole stack:
Kernel syscalls → eBPF probe → Falco engine → Rules evaluation
↓
Falcosidekick
↙ ↘
Alertmanager ntfy (critical only)
↓
Prometheus/Grafana
Talos + eBPF: A Love Story
Talos Linux has an immutable rootfs, which rules out Falco's traditional kernel module driver entirely. This is actually fine, because the kernel module approach was always kind of eh to me anyway.
Falco's modern_ebpf driver is the answer. It's compiled directly into the Falco binary, so there's no init container downloading drivers, no kernel header matching dance, no "sorry, we don't have a prebuilt probe for your kernel version." The eBPF probe just loads. Talos ships kernel 6.18.x, which is well above the minimum 5.8 requirement for modern eBPF. Every Pi 4B (Cortex-A72) and Pi 5 (Cortex-A76) handles it fine.
driver:
kind: modern_ebpf
loader:
enabled: false # No driver loader needed — probe is built into the binary
Two lines of config. That's it. No drama.
The GitOps Setup
Standard four-file Flux structure in gitops/infrastructure/falco/:
falco/
├── kustomization.yaml
├── namespace.yaml # Privileged PSA (needs host-level eBPF access)
├── repository.yaml # HelmRepository → falcosecurity.github.io/charts
└── release.yaml # HelmRelease with Falco + Falcosidekick config
Key values:
# Modern eBPF, no loader
driver:
kind: modern_ebpf
loader:
enabled: false
# JSON output for Loki, ISO timestamps
falco:
json_output: true
json_include_output_property: true
json_include_tags_property: true
time_format_iso_8601: true
log_syslog: false # Talos has no syslog
http_output:
enabled: true
url: http://falco-falco-falcosidekick.falco.svc:2801
# Prometheus integration
serviceMonitor:
create: true
labels:
release: monitoring-kube-prometheus-stack
# Falcosidekick sub-chart
falcosidekick:
enabled: true
config:
alertmanager:
hostport: http://monitoring-kube-prometheus-alertmanager.monitoring.svc:9093
endpoint: /api/v2/alerts
minimumpriority: warning
webhook:
address: http://ntfy.ntfy.svc:80/falco
minimumpriority: critical
Resource limits are conservative given the Pi 4B fleet: 50m/256Mi requests, 500m/512Mi limits for Falco; 20m/64Mi requests for sidekick.
The Debugging Gauntlet
Bug 1: The Service Name
Falcosidekick deploys as a service, and Falco's http_output needs to reach it. I initially configured:
url: http://falco-falcosidekick.falco.svc:2801
The actual service name:
url: http://falco-falco-falcosidekick.falco.svc:2801
The Helm chart names the service {release}-{chart}-falcosidekick. Since the release is falco-falco (Flux prefixes with the HelmRelease name... or something — honestly I've stopped trying to predict Helm naming) the service gets falco-falco-falcosidekick. The SeaweedFS filer had the exact same class of bug two hours earlier. I'm beginning to think "guess the Helm service name" should be its own drinking game.
Bug 2: The DaemonSet Timeout
Helm's --wait flag blocks until ALL pods in a release are Ready and up-to-date. When you're rolling a DaemonSet across 16 Raspberry Pi nodes — each one pulling a 40MB container image over the network, starting an eBPF probe, loading rules, and becoming ready — "wait for everything" takes a while. More than 5 minutes. More than 10 minutes.
The first install timed out at 5 minutes (default). Bumped to 10 minutes. Timed out again. The DaemonSet was actually working — 15/16 pods ready, just one slow node still pulling the image — but Helm doesn't care about "almost done."
The fix: disableWait: true and timeout: 15m in the HelmRelease. Helm submits the manifests and returns immediately. The DaemonSet controller handles the rollout at its own pace.
install:
crds: CreateReplace
disableWait: true
remediation:
retries: 3
upgrade:
crds: CreateReplace
disableWait: true
remediation:
retries: 3
After clearing Helm release secrets and doing a fresh install with these settings, it went through cleanly.
Bug 3: Alertmanager 410 Gone
Falcosidekick's Alertmanager integration was returning 410 Gone:
2026/03/15 05:14:28 [ERROR] : AlertManager - unexpected Response (410)
2026/03/15 05:14:28 [ERROR] : AlertManager - 410 Gone
Sidekick defaults to the Alertmanager v1 API, which newer Alertmanager versions have deprecated and removed. One line fix:
alertmanager:
endpoint: /api/v2/alerts
After that: AlertManager - POST OK (200).
What Falco Sees
Out of the box, Falco immediately started flagging things on the cluster:
"Contact K8S API Server From Container" — Garage's tokio workers connecting to the K8s API for peer discovery. Expected behavior, Notice priority.
"Redirect STDOUT/STDIN to Network Connection in Container" — nic-watchdog's busybox ping command. It pings the gateway every 15 seconds to check NIC health. Also expected, also Notice.
These are all legitimate activity that the default rules flag at low priority. They won't trigger Alertmanager (set to warning+) or ntfy (set to critical only), but they'll show up in Loki for forensic analysis. If I wanted to suppress them, I could add exception lists to the Falco rules — but having them in the log is actually useful for establishing a behavioral baseline.
The test I ran — kubectl run falco-test --image=busybox --rm -it -- cat /etc/shadow — got caught and forwarded to Alertmanager successfully. Falco saw the sensitive file read, classified it as Warning, Sidekick POSTed to Alertmanager v2 API, got a 200. The pipeline works end to end.
Coverage
Falco is now running on 16 of 17 nodes:
| Nodes | Count | Coverage |
|---|---|---|
| Pi 4B workers | 9 | All covered |
| Pi 4B control plane | 3 | All covered |
| Pi 5 NVMe workers | 4 | All covered |
| x86 GPU (velaryon) | 1 | Not covered (tainted) |
Velaryon has platform=x86:NoSchedule and gpu=true:NoSchedule taints. Adding Falco tolerations for it would be trivial, but the GPU node runs JupyterLab and gaming containers — probably the node that most deserves security monitoring, actually. Something for the future.
Step-CA: ACME Provisioner and the Inject Mode Migration
Why ACME
The PKI stack was already working: step-ca issues certs, step-issuer bridges to cert-manager, cert-manager handles the lifecycle. Every certificate in the cluster goes through that pipeline. It's fine. It works.
But ACME is the lingua franca of certificate provisioning. Every reverse proxy, every ingress controller, every piece of software that's ever heard of Let's Encrypt speaks ACME natively. Having an ACME endpoint on the internal CA means services can request certs without needing to know anything about step-issuer or cert-manager. Standard protocol, standard clients. cert-manager itself has an ACME issuer type. It's just a more universal interface.
The goal: add an ACME provisioner alongside the existing JWK one. Don't break the existing flow. Give services a second, standards-based path to certificates.
The Helm Chart's Two Modes
The step-certificates Helm chart has two configuration modes: bootstrap and inject. Bootstrap mode is what I'd been using — you give the chart a CA name and password, and it generates all the PKI material on first install. Quick to set up, but the CA material lives in Kubernetes Secrets created by the chart, and the ca.json config is generated from a limited set of Helm values.
The problem: bootstrap mode doesn't expose provisioner configuration in the Helm values. You get one JWK provisioner, and that's it. Want to add ACME? Tough luck. You'd have to kubectl exec into the pod and use step ca provisioner add, which is imperative configuration that disappears the next time the pod restarts.
Inject mode is the declarative alternative. You provide everything: root cert, intermediate cert, intermediate key, passwords, and the full ca.json config as a YAML object in the Helm values. The chart just mounts what you give it. Full control.
So: migrate from bootstrap to inject mode, and while we're at it, add the ACME provisioner to ca.json.
Extracting the CA Material
First step was pulling everything out of the running cluster. The bootstrap mode had created a bunch of Secrets:
# Root and intermediate certs
kubectl get secret -n step-ca step-ca-step-ca-step-certificates-certs \
-o jsonpath='{.data.root_ca\.crt}' | base64 -d > root_ca.crt
kubectl get secret -n step-ca step-ca-step-ca-step-certificates-certs \
-o jsonpath='{.data.intermediate_ca\.crt}' | base64 -d > intermediate_ca.crt
# The intermediate key (already encrypted with AES-256-CBC)
kubectl get secret -n step-ca step-ca-step-ca-step-certificates-secrets \
-o jsonpath='{.data.intermediate_ca_key}' | base64 -d > intermediate_ca_key.pem
# Passwords
kubectl get secret -n step-ca step-ca-step-ca-step-certificates-ca-password \
-o jsonpath='{.data.password}' | base64 -d > ca_password.txt
kubectl get secret -n step-ca step-ca-step-ca-step-certificates-provisioner-password \
-o jsonpath='{.data.password}' | base64 -d > provisioner_password.txt
# The running ca.json config
kubectl exec -n step-ca step-ca-step-ca-step-certificates-0 -- \
cat /home/step/config/ca.json > ca.json
The ca.json had the JWK provisioner with its encrypted key, the database config, TLS settings — everything needed to reconstruct the CA configuration declaratively.
The Config
The ACME provisioner addition to ca.json was straightforward. Just another entry in authority.provisioners:
- type: ACME
name: acme
claims:
defaultTLSCertDuration: 24h
maxTLSCertDuration: 24h
minTLSCertDuration: 5m
Same lifetime constraints as the JWK provisioner. All three challenge types (HTTP-01, TLS-ALPN-01, DNS-01) are enabled by default in step-ca, no explicit configuration needed.
I also added a CA-level policy to restrict what the CA will sign, mirroring the existing CertificateRequestPolicy:
authority:
policy:
x509:
allow:
dns:
- "*.goldentooth.local"
- "*.goldentooth.net"
- "*.svc.cluster.local"
ip:
- "10.0.0.0/8"
One gotcha here: the CertificateRequestPolicy allows *.*.svc.cluster.local (for service.namespace.svc.cluster.local names), but step-ca's policy engine only supports single-level wildcards. So namespaced service DNS names work through cert-manager (which validates before forwarding to step-ca) but not through direct ACME requests. Fine for now.
The Migration: A Series of Unfortunate Helm Upgrades
This is where things got interesting. By which I mean nine commits and a lot of staring at Flux logs.
Problem 1: Secret Type Immutability
Bootstrap mode creates Secrets with custom types like smallstep.com/ca-password. Inject mode creates them as Opaque. Kubernetes doesn't let you change a Secret's type. The Helm upgrade just... fails silently.
Fix: force: true on the HelmRelease upgrade spec. This tells Helm to delete and recreate resources instead of patching them. Nuclear option, but necessary for the one-time migration.
upgrade:
force: true
remediation:
retries: 3
Problem 2: The valuesFrom Misadventure
I wanted to keep the passwords out of the HelmRelease by putting them in a SOPS-encrypted Secret and using Flux's valuesFrom to merge them in. Seemed clean. The Secret would hold a values.yaml key with the nested inject.secrets values, and Flux would merge it with the HelmRelease values.
Created the SOPS-encrypted Secret. Added valuesFrom to the HelmRelease. Added the SOPS decryption block to the Flux Kustomization. Pushed.
Nothing happened. The passwords were empty. The Helm values showed the inject.secrets fields as blank strings. Flux reported the reconciliation as successful.
I tried: restructuring the Secret key format, different nesting levels, different YAML structures, placeholder values in the HelmRelease for the override to replace. None of it worked. The valuesFrom merge just... didn't merge.
After way too many commits trying to make this work, I gave up and inlined everything temporarily. Moved on to get the migration working, then came back and figured out what went wrong.
Problem 3: The Double Wildcard
Step-ca started, loaded config, immediately exited:
error: authority policy: x509 policy: invalid DNS name *.*.svc.cluster.local
Turns out step-ca only allows single-level wildcard prefixes in its policy engine. *.svc.cluster.local is fine. *.*.svc.cluster.local is not. Removed it, step-ca started.
Problem 4: Stale Helm Releases
After all the failed upgrades and rollbacks, there were orphaned Helm release Secrets (sh.helm.release.v1.step-ca-step-ca.v3 through v8) that prevented clean upgrades. Had to manually clean those out.
The Result
After all that:
step-ca-step-ca-step-certificates-0 1/1 Running 0 30s
---
2026/03/15 18:19:31 Config file: /home/step/config/ca.json
2026/03/15 18:19:31 The primary server URL is https://step-ca.goldentooth.net:9000
2026/03/15 18:19:31 Root certificates are available at https://step-ca.goldentooth.net:9000/roots.pem
2026/03/15 18:19:31 Additional configured hostnames: step-ca.step-ca.svc.cluster.local
2026/03/15 18:19:31 X.509 Root Fingerprint: c733522c1d640662cca00f19524d861c69ba4d193be5e41b28b2b9efa024b126
2026/03/15 18:19:31 Serving HTTPS on :9000 ...
Both provisioners confirmed alive:
wget -qO- --no-check-certificate https://127.0.0.1:9000/provisioners
{
"provisioners": [
{"type": "JWK", "name": "admin", "claims": {"minTLSCertDuration": "5m0s", "maxTLSCertDuration": "24h0m0s", "defaultTLSCertDuration": "24h0m0s"}},
{"type": "ACME", "name": "acme", "claims": {"minTLSCertDuration": "5m0s", "maxTLSCertDuration": "24h0m0s", "defaultTLSCertDuration": "24h0m0s"}}
]
}
All existing certificates still Ready: True. The canary certificate renewed on schedule. Nothing broke.
Cleanup
Post-migration cleanup:
- Removed
force: truefrom the HelmRelease (no longer needed) - Passwords moved to SOPS-encrypted Secret with
valuesFrom+targetPath(see below) - Only the AES-256-CBC encrypted intermediate key remains inline in the HelmRelease
Fixing valuesFrom: The Shallow Merge Trap
Remember how I gave up on SOPS-encrypted secrets via valuesFrom? Turns out I was an idiot.
Flux's valuesFrom merges values in order: valuesFrom entries first, then inline spec.values overwrites. The merge is shallow at the top level. My Secret contained a YAML structure under inject.secrets, but the inline values also defined inject: (for certificates, config, etc.). The inline inject: completely replaced whatever inject: came from the Secret. The passwords were merged in, then immediately obliterated.
The fix: targetPath. Instead of putting a YAML structure in the Secret and hoping it merges, you put individual values and tell Flux exactly where to inject them:
valuesFrom:
- kind: Secret
name: step-ca-secrets
valuesKey: ca_password
targetPath: inject.secrets.ca_password
- kind: Secret
name: step-ca-secrets
valuesKey: provisioner_password
targetPath: inject.secrets.provisioner_password
targetPath injects a scalar value at an exact dot-notation path after all merging. It can't be clobbered by the inline structure. The Secret has two keys, each holding one base64-encoded password, SOPS-encrypted in git. Done.
One timing wrinkle: on the first deploy, the helm-controller tried to read the Secret before the kustomize-controller had finished decrypting and applying it. The error was key "type:str]" has no value — it was reading the raw SOPS ciphertext. A manual flux reconcile helmrelease after the Secret existed fixed it, and subsequent reconciliations are fine.
Integration Testing: The ACME Gauntlet
With the provisioner running, I wanted to prove the whole flow works: cert-manager talks ACME to step-ca, gets a challenge, solves it, gets a cert.
The ClusterIssuer
apiVersion: cert-manager.io/v1
kind: ClusterIssuer
metadata:
name: step-ca-acme
spec:
acme:
server: https://step-ca.step-ca.svc.cluster.local/acme/acme/directory
caBundle: <base64 root CA>
privateKeySecretRef:
name: step-ca-acme-account-key
solvers:
- http01:
gatewayHTTPRoute:
parentRefs:
- name: goldentooth
namespace: gateway
kind: Gateway
Account registered immediately. Good sign.
cert-manager Gateway API: A Three-Act Feature Gate Drama
The HTTP-01 solver uses Gateway API's HTTPRoute to route challenge traffic through the Cilium gateway. cert-manager needs a feature gate enabled for this.
Act 1: Set featureGates: ExperimentalGatewayAPISupport=true as a top-level Helm value. Passed as --feature-gates=... CLI flag. Controller starts, challenge fails: gateway api is not enabled.
Act 2: Moved it to the controller configuration object:
config:
apiVersion: controller.config.cert-manager.io/v1alpha1
kind: ControllerConfiguration
featureGates:
ExperimentalGatewayAPISupport: true
ConfigMap updated correctly. Controller logs: "not starting controller as it's disabled" controller="gateway-shim". Same error. What.
Act 3: Turns out cert-manager 1.15 promoted Gateway API to beta and deprecated the ExperimentalGatewayAPISupport feature gate. It's a no-op. Accepts the value, parses it fine, does absolutely nothing with it. The actual setting in 1.16 is:
config:
apiVersion: controller.config.cert-manager.io/v1alpha1
kind: ControllerConfiguration
enableGatewayAPI: true
A completely different field name, at a completely different level in the config structure, with zero deprecation warnings in the logs. Classic.
After that, gateway-shim showed up in the enabled controllers list and the solver started creating HTTPRoutes.
DNS Propagation: The 24-Hour Brick Wall
The HTTP-01 flow works like this: cert-manager creates a solver pod, a service, and an HTTPRoute. The ACME server (step-ca) makes an HTTP request to http://<domain>/.well-known/acme-challenge/<token> and the solver pod responds with the proof. Simple.
Except the domain needs to resolve. For acme-test.goldentooth.net, external-dns saw the new HTTPRoute and created an A record in Route 53 pointing to the gateway IP. Public DNS (8.8.8.8, 1.1.1.1) had it within seconds. But inside the cluster, the domain didn't resolve.
The DNS chain: pod → CoreDNS → Talos node resolver (127.0.0.53) → router (10.4.0.1) → upstream DNS. The router had cached an NXDOMAIN response from before the record existed. The Route 53 SOA had a negative cache TTL of 86400 seconds. Twenty-four hours. The router was going to insist this domain doesn't exist for a full day.
I reduced the SOA negative TTL to 300 seconds for the future, but the existing cached NXDOMAIN was already baked in. The fix that actually unblocked things: changing CoreDNS to forward directly to 8.8.8.8 and 1.1.1.1 instead of /etc/resolv.conf. This also fixed a latent bug where new CoreDNS pods would crash on startup due to a loop — /etc/resolv.conf on Talos points to 127.0.0.53, which is Talos's own DNS cache, which forwards to the router. When CoreDNS restarts, the loop detection plugin sees 127.0.0.53 → CoreDNS → 127.0.0.53 and kills itself. The old pods had been running since before the loop existed and were fine. New pods: instant CrashLoopBackOff.
Fun times.
The Cilium Hairpin: 503 From the Inside
With DNS working, cert-manager's self-check still got 503. Manual testing from other pods returned 200. The difference: cert-manager was scheduled on manderly, which is also where Cilium's envoy proxy for the gateway runs.
When a pod on the same node as the gateway's envoy hits the gateway's LoadBalancer IP (10.4.11.1), the traffic needs to "hairpin" — leave the pod, hit the LB VIP, route back to the envoy process on the same node. This hairpin path is broken in Cilium — envoy returns 503 instead of proxying to the backend.
From any other node, the request goes across the network normally and works fine. I deleted the cert-manager pod, it rescheduled on norcross, and the self-check immediately started returning 200.
This is a known class of Cilium issue with LoadBalancer service traffic originating from the LB's host node. It only affects in-cluster clients hitting the external VIP from the "wrong" node. External clients are fine.
The culprit turned out to be Cilium's socket-level load balancer (socketLB). With kubeProxyReplacement: true, Cilium hooks into the socket layer via eBPF to intercept connect() calls and translate service IPs directly — bypassing the normal packet path entirely. When a pod on manderly connected to 10.4.11.1, the eBPF program tried to short-circuit the connection to the envoy process on the same node, but got the return path wrong. The fix:
socketLB:
hostNamespaceOnly: true
This restricts the socket-level LB trick to the host network namespace only. Pods still go through the normal datapath — VXLAN tunnel, proper NAT, envoy receives the traffic like any other packet. Host-namespace processes (kubelet, node-level services) still get the fast path. One line, problem gone.
Interestingly, most of the Cilium GitHub issues about this (#31653, #33243, #35424) focus on bpf.masquerade and native routing mode, neither of which apply here — the cluster runs VXLAN tunnel mode. The socket-level LB is a separate interception point that can cause the same symptom through a completely different mechanism.
Success
After deleting the stale challenge and letting cert-manager retry on its new node:
NAME READY SECRET ISSUER STATUS
acme-test-certificate True acme-test-tls-secret step-ca-acme Certificate is up to date and has not expired
Issuer: O=Goldentooth CA, CN=Goldentooth CA Intermediate CA
Not Before: Mar 16 15:45:28 2026 GMT
Not After : Mar 17 15:46:28 2026 GMT
Subject: CN=acme-test.goldentooth.net
DNS:acme-test.goldentooth.net
Issued by the Goldentooth CA Intermediate, 24-hour lifetime, via ACME. The full chain worked: cert-manager registered an ACME account, requested a certificate, created an HTTP-01 solver pod with a Gateway API HTTPRoute, external-dns created the DNS record, step-ca verified the challenge, and the certificate was issued.
All three test certificates now live in the cluster:
test-certificate— JWK provisioner via step-issuer (existing)canary-certificate— JWK provisioner via step-issuer (existing)acme-test-certificate— ACME provisioner via cert-manager ClusterIssuer (new)
What's Left
- DNS-01 challenge support: HTTP-01 works but has the DNS propagation dependency. DNS-01 via Route 53 would be more reliable for programmatic cert issuance, and the infrastructure (external-dns, AWS credentials) already exists.
NATS: Pub/Sub on the Bramble
Why a Message Bus?
I've got storage. I've got observability. I've got security monitoring. I've got a service mesh worth of eBPF. What I don't have is a way for things on the cluster to talk to each other without going through HTTP like cavemen.
NATS is a message bus. Pub/sub, request-reply, fan-out — the whole deal. It's written in Go, which means it compiles to a single binary, starts in milliseconds, and uses almost no memory. That last part matters when your "servers" are Raspberry Pis with the thermal profile of a small toaster.
The plan: deploy it, poke at it, see how fast it goes on ARM hardware. No grand architecture, no event-driven microservice vision. Just "what does this thing do and how does it feel." JetStream (NATS' persistence layer) stays off for now — I want to understand the core pub/sub model before I start bolting on durability.
The Deployment
The Setup
Standard four-file Flux structure:
nats/
├── kustomization.yaml
├── namespace.yaml # No PSA needed — runs unprivileged
├── repository.yaml # HelmRepository → nats-io.github.io/k8s/helm/charts/
└── release.yaml # HelmRelease with 3-node cluster config
Key values from the HelmRelease:
config:
cluster:
enabled: true
replicas: 3
jetstream:
enabled: false
monitor:
enabled: true
port: 8222
container:
image:
repository: nats
tag: "2.11-alpine"
resources:
requests:
cpu: 50m
memory: 128Mi
limits:
cpu: 200m
memory: 256Mi
natsBox:
enabled: true
promExporter:
enabled: true
port: 7777
podMonitor:
enabled: true
Three NATS nodes forming a full mesh cluster. Each pod runs three containers: the NATS server, a config reloader sidecar, and a Prometheus exporter. Plus a nats-box Deployment for CLI access.
Resource requests are tiny — 50m CPU and 128Mi per node. NATS genuinely doesn't need much. The entire 3-node cluster uses less RAM than a single Loki pod.
The Helm Chart Values Schema Adventure
Here's a fun one. I wrote out a perfectly reasonable-looking release.yaml, had it reviewed, and then someone pointed out that the Helm chart values might not match what I wrote. "Might not" is doing a lot of heavy lifting here — Helm silently ignores unknown keys. So if you typo container.resources when the chart actually expects container.image.resources, your careful resource limits just... don't apply. No error. No warning. Your pods deploy with whatever defaults the chart author thought were reasonable.
helm show values nats/nats revealed:
-
The nats-box container has
resourcesnested underimage— as innatsBox.container.image.resources, notnatsBox.container.resources. This is bizarre. Every other Helm chart I've seen puts resources as a sibling of image. But the NATS chart does its own thing, and if you don't check, you get nats-box pods with no resource limits running wild on your Pi 4Bs. -
The nats-box image tag I'd picked (
0.14) was ancient. The chart defaults to0.19.2. Dropped the override entirely. -
The PodMonitor for Prometheus wasn't enabled by default. Added
promExporter.podMonitor.enabled: trueso the existing kube-prometheus-stack discovers and scrapes NATS metrics automatically.
Lesson learned (again): always helm show values before writing values files. Helm's silent-ignore behavior is a landmine.
Deployment
Pushed to git, kicked Flux:
$ flux reconcile kustomization infrastructure --with-source
► annotating GitRepository flux-system in flux-system namespace
✔ fetched revision main@sha1:04beb2fd68bac6177277e0717c28950e75c08951
✔ applied revision main@sha1:04beb2fd68bac6177277e0717c28950e75c08951
Helm chart version 1.3.16 installed cleanly on the first try. No timeout issues, no CRD drama, no image pull failures. Genuinely the smoothest infrastructure deployment I've done on this cluster.
$ kubectl get pods -n nats
NAME READY STATUS RESTARTS AGE
nats-nats-0 3/3 Running 0 41s
nats-nats-1 3/3 Running 0 41s
nats-nats-2 3/3 Running 0 41s
nats-nats-box-778456b65f-4dpfj 1/1 Running 0 41s
Three NATS nodes, one nats-box. All running. 41 seconds. I don't trust it.
Benchmarks
Time to see what Raspberry Pis can do with a real message bus.
Single Publisher
$ nats bench pub test --msgs 1000000 --size 128
NATS Core NATS publisher stats: 151,413 msgs/sec ~ 18 MiB/sec ~ 6.60us
151K messages per second from a single publisher, 128-byte messages. Average latency 6.6 microseconds. On a Raspberry Pi. I've worked on production systems with worse numbers running on actual servers.
Four Publishers
$ nats bench pub test --msgs 1000000 --size 128 --clients 4
NATS Core NATS publisher aggregated stats: 411,094 msgs/sec ~ 50 MiB/sec
[1] 139,910 msgs/sec ~ 17 MiB/sec ~ 7.15us (250,000 msgs)
[2] 122,697 msgs/sec ~ 15 MiB/sec ~ 8.15us (250,000 msgs)
[3] 111,404 msgs/sec ~ 14 MiB/sec ~ 8.98us (250,000 msgs)
[4] 102,794 msgs/sec ~ 12 MiB/sec ~ 9.73us (250,000 msgs)
message rates min 102,794 | avg 119,201 | max 139,910 | stddev 13,884 msgs
avg latencies min 7.15us | avg 8.50us | max 9.73us | stddev 0.96us
411K msgs/sec aggregate across 4 clients. Sub-10 microsecond latencies across the board. The throughput scales roughly linearly with publishers, which tracks — NATS has a zero-allocation hot path that basically just shuffles bytes between connections.
For context: these numbers are from inside the nats-box pod, talking to the NATS service over the cluster network (Cilium eBPF). Real cross-node pub/sub would add some network latency, but the message processing overhead is clearly not the bottleneck here.
Observability
The Prometheus exporter is working — metrics are available on :7777/metrics from each NATS pod. The PodMonitor should get them into Prometheus automatically once the next scrape cycle hits. Standard NATS metrics: connection counts, message rates, byte throughput, slow consumers, route stats for the cluster mesh.
JetStream: Adding Persistence
The Config Change
Enabling JetStream is a one-section values change:
config:
jetstream:
enabled: true
fileStore:
enabled: true
dir: /data
pvc:
enabled: true
size: 5Gi
storageClassName: seaweedfs
5Gi per node, 15Gi total, backed by SeaweedFS. Should be plenty for experimenting.
The StatefulSet Immutability Wall
Pushed the change. Flux tried to upgrade. Helm tried to patch the StatefulSet. Kubernetes said no.
error updating the resource "nats-nats":
cannot patch "nats-nats" with kind StatefulSet: StatefulSet.apps "nats-nats"
is invalid: spec: Forbidden: updates to statefulset spec for fields other than
'replicas', 'ordinals', 'template', 'updateStrategy', 'revisionHistoryLimit',
'persistentVolumeClaimRetentionPolicy' and 'minReadySeconds' are forbidden
Adding volumeClaimTemplates to an existing StatefulSet is an immutable field change. Kubernetes flat-out refuses it. Helm tried three times, rolled back three times, and the HelmRelease ended up in a rollback loop with a poisoned release history.
The fix was a full nuke-and-pave:
- Delete the StatefulSet with
--cascade=orphan(keeps pods running, but the rollback recreated it anyway) - Delete all Helm release secrets from
flux-systemnamespace (sh.helm.release.v1.nats-nats.v5throughv9) - Delete all orphaned resources in the
natsnamespace — pods, deployment, configmap, services, PDB, PodMonitor, secrets - Let Flux do a clean install from scratch
$ kubectl get pods -n nats
NAME READY STATUS RESTARTS AGE
nats-nats-0 3/3 Running 0 34s
nats-nats-1 3/3 Running 0 34s
nats-nats-2 3/3 Running 0 34s
nats-nats-box-778456b65f-ggsv9 1/1 Running 0 35s
$ kubectl get pvc -n nats
NAME STATUS VOLUME CAPACITY STORAGECLASS AGE
nats-nats-js-nats-nats-0 Bound pvc-4baac... 5Gi seaweedfs 34s
nats-nats-js-nats-nats-1 Bound pvc-b37bb... 5Gi seaweedfs 34s
nats-nats-js-nats-nats-2 Bound pvc-d1f8e... 5Gi seaweedfs 34s
Three PVCs, all bound to SeaweedFS. JetStream is live.
Playing With Streams
Created a test stream with R3 replication across all three nodes:
$ nats stream add EVENTS --subjects "events.>" --retention limits \
--max-age 1h --storage file --replicas 3
Stream EVENTS was created
Subjects: events.>
Replicas: 3
Storage: File
Cluster Group: S-R3F-RKzOy1A8
Leader: nats-nats-2
Replica: nats-nats-0, current
Replica: nats-nats-1, current
Published 5 messages, created a pull consumer, replayed them all:
$ nats consumer next EVENTS replay --count 5
[01:50:48] subj: events.test / cons seq: 1 / str seq: 1 / pending: 4
message number 1 from the bramble
[01:50:48] subj: events.test / cons seq: 2 / str seq: 2 / pending: 3
message number 2 from the bramble
...
Messages go in, messages come back out. In order. With sequence numbers. Even after the publisher is long gone. This is the thing core pub/sub can't do.
JetStream Benchmarks
Here's where it gets interesting. Same 4-client, 128-byte setup, but now with persistence:
| Mode | Throughput | Avg Latency |
|---|---|---|
| Core pub/sub | 411,094 msgs/sec | 8.5µs |
| JetStream async R1 | 4,144 msgs/sec | 951µs |
| JetStream async R3 | 1,007 msgs/sec | 3.9ms |
| JetStream sync R3 | 401 msgs/sec | 9.5ms |
That's a thousand-to-one ratio between core pub/sub and JetStream sync R3. Not a typo. Core NATS shuffles bytes in memory. JetStream sync R3 writes to disk on the leader, replicates to two followers via Raft consensus, waits for quorum acknowledgment from the SeaweedFS-backed PVCs, then responds. Every single message does a full consensus round-trip across the cluster network.
The async numbers are more forgiving — 1K msgs/sec at R3 is totally usable for event streams, audit logs, sensor data. You're batching the acks and letting the client pipeline ahead while the cluster catches up. R1 gets you 4K msgs/sec by skipping replication entirely, but then you've got a single point of failure, which kind of defeats the purpose.
For this cluster, R3 async is probably the sweet spot. Durable, replicated, and fast enough for anything I'd realistically run on a bramble.
What's Next
Actually building something on top of NATS would be nice. A little event-driven app, maybe some sensor data pipeline across the bramble. Having a message bus with durable streams and nothing to stream is a very on-brand infrastructure hobby.
Forgejo: CI/CD That Doesn't Phone Home
I've been building Docker images for the MCP server by hand. Like, on my laptop. docker build, docker push, pray the registry doesn't reject it because I forgot to trust the CA this time. It works. It's also embarrassing.
The cluster runs Flux for GitOps, has a private Docker registry, has NATS for messaging, has a whole observability stack — but the actual build step is me, in a terminal, like some sort of artisanal software craftsman. Time to fix that.
The Plan
Mirror the MCP repo from GitHub into a self-hosted Forgejo instance on the cluster. Forgejo has built-in Actions (GitHub Actions-compatible CI), so when a push lands on main, it triggers a workflow that builds the Docker image and pushes it to the registry. No external CI service, no GitHub Actions minutes, no secrets leaving the network.
The architecture:
GitHub push → Forgejo mirror (≤5min) → Actions workflow →
Kaniko build → registry.goldentooth.net → Flux deploys
Kaniko is the key piece — it builds Docker images without needing a Docker daemon or privileged containers. Well, sort of. More on that later.
The Deployment
Helm Chart
Standard Flux structure: namespace, HelmRepository (OCI), HelmRelease.
apiVersion: source.toolkit.fluxcd.io/v1beta2
kind: HelmRepository
metadata:
name: forgejo
namespace: flux-system
spec:
interval: 24h
type: oci
url: oci://code.forgejo.org/forgejo-helm
The Forgejo chart is distributed as an OCI artifact, not a traditional Helm repo. Flux handles this fine with type: oci.
Key HelmRelease values:
gitea:
admin:
existingSecret: forgejo-admin
config:
actions:
ENABLED: true
mirror:
ENABLED: true
MIN_INTERVAL: 5m
server:
DOMAIN: git.goldentooth.net
ROOT_URL: https://git.goldentooth.net/
service:
DISABLE_REGISTRATION: true
database:
DB_TYPE: sqlite3
persistence:
enabled: true
storageClass: seaweedfs
size: 10Gi
nodeSelector:
node.kubernetes.io/disk-type: nvme
SQLite because I don't need Postgres for a single-user forge that mirrors one repo. SeaweedFS for persistence because it's what we've got. NVMe nodes (the Pi 5s) because they have the storage and the CPU for builds.
Actions are enabled at the server level, but you also have to enable them per-repository. I learned this the hard way after spending twenty minutes wondering why mirror syncs weren't triggering workflows. has_actions: false was the default on the mirrored repo. Cool. Thanks for that.
The Service Name Problem
The Helm chart creates a service called forgejo-forgejo-http. Not forgejo-http, which is what you'd expect. The chart names it <release>-<chart>-http, and since the release name is forgejo and the chart name is forgejo, you get the stutter. My HTTPRoute initially pointed at forgejo-http and got a 500 from Envoy. Always kubectl get svc after a Helm deploy.
Gateway Route
Same pattern as everything else — HTTPRoute in the service namespace referencing the shared gateway:
apiVersion: gateway.networking.k8s.io/v1
kind: HTTPRoute
metadata:
name: forgejo
namespace: forgejo
spec:
parentRefs:
- name: goldentooth
namespace: gateway
sectionName: https
hostnames:
- git.goldentooth.net
rules:
- backendRefs:
- name: forgejo-forgejo-http
port: 3000
Plus git.goldentooth.net in the gateway TLS certificate dnsNames. Step-CA issues a new cert within minutes.
The Mirror
Creating the mirror is an API call:
curl -k -X POST https://git.goldentooth.net/api/v1/repos/migrate \
-H "Content-Type: application/json" \
-u "forgejo_admin:<password>" \
-d '{
"clone_addr": "https://github.com/goldentooth/mcp.git",
"repo_name": "mcp",
"repo_owner": "forgejo_admin",
"service": "github",
"mirror": true,
"mirror_interval": "5m"
}'
Five-minute mirror interval. Forgejo pulls from GitHub, not the other way around. No webhooks, no GitHub tokens, no inbound network access needed.
One gotcha: mirror syncs of already-seen commits don't generate push events. So if you enable Actions after the initial mirror sync, you need to push a new commit to GitHub to trigger the first workflow run. I pushed a one-line change, waited for the mirror, and the run kicked off.
The Runner: A Comedy of Errors
The Forgejo runner is where this got interesting.
Attempt 1: Environment Variables
The plan assumed the runner image would read FORGEJO_RUNNER_* environment variables and Just Work. Nope. The container's default entrypoint prints a help message and exits. The runner needs two explicit commands:
create-runner-file— generates a.runnerconfig file using a shared secretdaemon— actually runs the runner
The shared secret is pre-registered in Forgejo via forgejo-cli actions register --secret <hex>, then the runner uses the same secret to authenticate. No OAuth dance, no token exchange. Both sides just agree on a secret ahead of time.
I split this into an init container for registration and the main container for the daemon:
initContainers:
- name: register
command:
- forgejo-runner
- create-runner-file
- --connect
- --instance
- http://forgejo-forgejo-http.forgejo.svc.cluster.local:3000
- --name
- bramble-runner
- --secret
- $(FORGEJO_RUNNER_SECRET)
Note: http://, not https://. The gateway terminates TLS. In-cluster traffic is plain HTTP on port 3000. Using https here gives you a TLS handshake error and a valuable lesson about knowing which side of the gateway you're on.
Attempt 2: No Docker
Runner starts, connects to Forgejo, declares itself with labels... then dies:
Error: daemon Docker Engine socket not found
The runner label ubuntu-latest:docker://node:20-bookworm tells it to run jobs inside Docker containers. But there's no Docker daemon in the pod. The Kubernetes nodes use containerd, and the runner can't just reach in and use it.
Attempt 3: DinD Sidecar
Solution: Docker-in-Docker as a sidecar container. The docker:27-dind image runs a full Docker daemon inside the pod, and the runner connects to it via a shared /var/run/docker.sock:
containers:
- name: runner
# ...
volumeMounts:
- name: docker-sock
mountPath: /var/run
- name: dind
image: docker:27-dind
securityContext:
privileged: true
env:
- name: DOCKER_TLS_CERTDIR
value: ""
volumeMounts:
- name: docker-sock
mountPath: /var/run
volumes:
- name: docker-sock
emptyDir: {}
privileged: true is the price of admission. DinD needs full kernel access to run a Docker daemon inside a container. This required setting the forgejo namespace to pod-security.kubernetes.io/enforce: privileged. I'm not thrilled about it, but it's scoped to one namespace with one deployment.
Attempt 4: Permission Denied
Runner starts, DinD starts, they share the socket... and the runner can't connect because the socket is owned by root and the runner image runs as a non-root user. securityContext.runAsUser: 0 fixes it. We're already in privileged territory, so running as root is the least of our concerns.
Attempt 5: Race Condition
Runner starts faster than DinD. Docker daemon takes about 8 seconds to boot. Runner checks for the socket immediately, finds nothing, dies.
Fix: a shell wrapper that waits for the socket:
command:
- sh
- -c
- |
while [ ! -S /var/run/docker.sock ]; do sleep 1; done
exec forgejo-runner daemon --config /etc/runner/config.yaml
Attempt 6: Labels via Config File
The runner's labels aren't set via environment variables or command-line flags. They come from a config file under runner.labels. Without a config file, the runner registers with no labels and can't pick up any jobs. The config lives in a ConfigMap mounted at /etc/runner/config.yaml:
runner:
file: .runner
capacity: 1
timeout: 3h
labels:
- "ubuntu-latest:docker://node:20-bookworm"
container:
docker_host: unix:///var/run/docker.sock
It Works
After six iterations, the runner connected, registered with the ubuntu-latest label, and started polling for jobs. The pod looks like this:
forgejo-runner-7fb4f856f7-g69r6 2/2 Running 0
Two containers: runner and dind. Zero restarts. I may have pumped my fist.
The CI Workflow
The workflow is straightforward — checkout the code, build with Kaniko:
name: CI Build
on:
push:
branches: [main]
jobs:
build:
runs-on: ubuntu-latest
steps:
- uses: actions/checkout@v4
- name: Build and push Docker image
uses: docker://gcr.io/kaniko-project/executor:latest
with:
args: >-
--dockerfile=Dockerfile
--context=.
--destination=registry.goldentooth.net/goldentooth-mcp:${{ github.sha }}
--destination=registry.goldentooth.net/goldentooth-mcp:latest
--skip-tls-verify
--skip-tls-verify because the registry uses our private Step-CA. Kaniko doesn't know about our CA trust chain, and teaching it would mean building a custom Kaniko image or mounting the CA cert. Skip-TLS is fine for an internal registry that's already behind the cluster network.
The first build — a Rust project, cold cache, ARM64 — took about eight minutes. Not fast. But it works, it's automatic, and I never have to think about it again.
The Result
$ curl -ks https://registry.goldentooth.net/v2/goldentooth-mcp/tags/list
{"name":"goldentooth-mcp","tags":["d53a7b81d368...","latest"]}
Both tags present: latest and the SHA tag. The full pipeline works:
- Push to GitHub
- Forgejo mirrors within 5 minutes
- Actions workflow triggers
- Kaniko builds the Docker image inside a DinD-equipped runner pod
- Image pushed to the private registry
- Flux can deploy the new image
The Files
infrastructure/forgejo/
├── namespace.yaml # Namespace with privileged PodSecurity
├── admin-secret.yaml # SOPS-encrypted admin credentials
├── repository.yaml # OCI HelmRepository
├── release.yaml # HelmRelease with all config
├── runner-config.yaml # ConfigMap for runner daemon config
├── runner-secret.yaml # SOPS-encrypted runner registration token
├── runner-deployment.yaml # Runner + DinD sidecar
└── kustomization.yaml # Ties it all together
Plus infrastructure/gateway/routes/forgejo.yaml for the HTTPRoute and git.goldentooth.net added to the gateway TLS certificate.
What I Learned
The runner was by far the hardest part. The plan assumed env vars would work and didn't account for DinD. Six iterations to get a working runner pod. Turns out "run a CI runner inside Kubernetes" is not as simple as "deploy a container," because the runner itself needs to run containers, and that's a fundamentally awkward thing to do inside a container.
The plan also missed: service naming (Helm prefix stutter), in-cluster HTTP vs HTTPS, per-repo Actions enablement, and the fact that mirror syncs of existing commits don't trigger workflows. Every one of these was a 5-minute fix, but each one required discovering the problem first.
Still: the cluster now has a self-hosted CI/CD pipeline that builds Docker images from GitHub mirrors without any external dependencies. Push to GitHub, wait a few minutes, image appears in the registry. That's the dream.
Next up: maybe have Flux auto-deploy the new image. Right now it's tagged latest and the deployment uses latest, so it technically works, but imagePullPolicy: Always is not what you'd call a "deployment strategy."
Flux Image Automation: Push to Deploy
The Problem With latest
Last entry I got Forgejo building Docker images automatically. Push to GitHub, mirror syncs, Actions builds the image, Kaniko pushes to the registry. Wonderful. Except the deployment still said image: goldentooth-mcp:latest and imagePullPolicy: IfNotPresent, which means Kubernetes had absolutely no reason to pull a new image. The deployment hadn't changed. The tag hadn't changed. As far as Flux was concerned, nothing happened.
I could have set imagePullPolicy: Always, but that's the Kubernetes equivalent of "close your eyes and hope." No audit trail. No rollback. No way to know which image is actually running. If the registry goes down, your next pod restart pulls... nothing.
The real fix: Flux image automation.
The Architecture
Flux has two optional controllers that most people don't install because flux bootstrap doesn't include them by default:
- image-reflector-controller — scans container registries for new tags
- image-automation-controller — commits updated tags back to your git repo
Together they form a closed loop:
CI pushes new image tag → reflector scans registry →
policy selects newest tag → automation commits new tag to gitops →
Flux reconciles → pod runs new image
The key insight: the automation controller doesn't update the running cluster directly. It commits to git. The existing Flux reconciliation loop picks up that commit and deploys it. GitOps all the way down. Your git history is a complete record of every image that was ever deployed.
Moving the Deployment to gitops
First problem: the MCP deployment manifests lived in the mcp repo, not in gitops. The image automation controller commits tag updates to a git repo, and having it push to mcp while Flux watches gitops would be... confusing.
Moved the manifests to gitops/apps/mcp/ — namespace, deployment, service, kustomization. The deployment's image line gets a special marker comment:
image: registry.goldentooth.net/goldentooth-mcp:latest # {"$imagepolicy": "flux-system:mcp"}
That JSON comment is how the automation controller knows where in the file to write the updated tag. It's a setter. Flux scans the file for these markers and replaces the value before the comment with whatever the named ImagePolicy resolved to.
Tag Strategy: Why Not SHA?
The first CI build tagged images with the full git SHA: d53a7b81d36805660f2cd5c6e66d42f3d6dfdb2e. Problem: SHA hashes aren't chronologically sortable. If you have tags abc123 and def456, which one is newer? You can't tell without checking the registry's metadata.
Flux's ImagePolicy needs a sortable tag format. Options:
- Semver (
1.2.3) — overkill for a single-dev project - Timestamp (
1710886400) — sortable but opaque - Run number (
2,3,4...) — Forgejo'sgithub.run_numberis a monotonically increasing integer
I went with <run_number>-<sha>: 2-f62ba56a999ec99a7375fed529acf4b336691bdb. The ImagePolicy extracts the numeric prefix and picks the highest:
spec:
policy:
numerical:
order: asc
filterTags:
pattern: '^(?P<num>[0-9]+)-[a-f0-9]+$'
extract: '$num'
filterTags ignores latest (doesn't match the pattern), extracts the run number, and numerical.order: asc picks the highest. Clean, deterministic, always increasing.
Installing the Controllers
Here's where I learned that "the CRDs are in gotk-components.yaml" does not mean "the controllers are running." The initial flux bootstrap didn't include the image controllers. Running kubectl api-resources | grep image returned nothing.
Fix:
flux install \
--components-extra=image-reflector-controller,image-automation-controller \
--export > clusters/goldentooth/flux-system/gotk-components.yaml
This regenerated the entire components file with the two extra controllers (+1944 lines). Committed, pushed, reconciled. Both controllers came up in seconds.
The TLS Saga
The ImageRepository's first scan failed:
scan failed: tls: failed to verify certificate: x509: certificate has expired
Two problems stacked on top of each other:
Problem 1: insecure: true doesn't mean what you think.
In Flux ImageRepository, insecure: true means "use HTTP instead of HTTPS." It does NOT mean "skip TLS certificate verification." Coming from curl -k land, this was... not intuitive. For a registry with a private CA, you need certSecretRef pointing to a secret containing the CA certificate:
spec:
certSecretRef:
name: registry-ca
I created a secret containing the Step-CA root cert (it's a public cert, not sensitive, no SOPS needed) and referenced it.
Problem 2: The registry was serving an expired cert.
cert-manager had renewed the TLS certificate in the Kubernetes secret. The secret had a valid cert (checked with openssl x509 -noout -dates). But the registry pod was still serving the old cert from memory. Kubernetes updates the mounted volume when a secret changes, but the Docker Registry v2 process reads the cert files at startup and never checks again.
Restarting the registry pod fixed it. But this is a ticking time bomb — every 24 hours, the cert renews, and the registry keeps serving the old one until someone notices. This needs a proper fix.
The Deploy Key
ImageUpdateAutomation tried to push its first commit and got:
failed to push to remote: ERROR: The key you are authenticating with has been marked as read only
Of course. flux bootstrap creates a read-only deploy key because it only needs to read the repo. Image automation needs to write to it. GitHub doesn't support updating deploy key permissions in place, so:
# Delete the read-only key
gh api -X DELETE repos/goldentooth/gitops/keys/145157804
# Re-add with write access
gh api repos/goldentooth/gitops/keys \
-f title="flux-system" \
-f key="$PUBKEY" \
-f read_only=false
After that, the automation controller pushed its first commit:
23d4bb5 chore(flux): update mcp image to registry.goldentooth.net/goldentooth-mcp:2-f62ba56a999ec99a7375fed529acf4b336691bdb
Fluxcdbot's first contribution. I'm unreasonably proud.
The Result
$ kubectl get pods -n goldentooth-mcp
NAME READY STATUS RESTARTS AGE
goldentooth-mcp-6fc48bc7d7-d88p8 1/1 Running 0 67s
$ kubectl get pods -n goldentooth-mcp -o jsonpath='{.items[0].spec.containers[0].image}'
registry.goldentooth.net/goldentooth-mcp:2-f62ba56a999ec99a7375fed529acf4b336691bdb
Specific image tag. Committed to git. Deployed by Flux. No human in the loop.
The Files
apps/mcp/
├── namespace.yaml
├── deployment.yaml # Has $imagepolicy setter comment
├── service.yaml
├── registry-ca-secret.yaml # Step-CA root cert for registry TLS
├── image-repository.yaml # Scans registry every 1m
├── image-policy.yaml # Selects newest by run_number
├── image-update-automation.yaml # Commits tag updates to gitops
└── kustomization.yaml
What's Still Broken
The registry cert reload. Every 24 hours, cert-manager renews the TLS cert, the registry keeps serving the stale one, and eventually something fails. Right now the "fix" is to restart the pod. That's not a fix, that's a prayer schedule.
Docker Registry v2 doesn't support SIGHUP-based cert reload. The cert files update on disk (Kubernetes handles that), but the process doesn't re-read them. Options include Stakater Reloader (watches secrets, restarts pods automatically), a CronJob that bounces the pod daily, or accepting that I'll get paged at 3am when the cert expires. Guess which option I'm implementing next.
Stakater Reloader: Never Restart a Pod Again
The Problem
The Docker registry serves TLS using a cert-manager Certificate with a 24-hour lifetime. cert-manager renews it on schedule. Kubernetes updates the mounted secret on disk. The registry process continues serving the old cert from memory because Docker Registry v2 reads TLS files once at startup and never looks at them again.
Every 24 hours, the cert renews, the registry doesn't notice, and eventually something fails with x509: certificate has expired. The fix was to manually restart the pod. I discovered this when the Flux image-reflector-controller couldn't scan the registry because it was presenting a two-day-old cert. Delightful.
This is not a Docker Registry problem specifically. It's a Kubernetes problem generally. Any pod that reads a cert or config at startup and doesn't watch for changes will go stale. Nginx does it. HAProxy does it. Half the things in this cluster probably do it. I just hadn't noticed because most of the certs are consumed by things with their own reload mechanisms (Envoy, Step-CA, etc.).
Stakater Reloader
Stakater Reloader is a Kubernetes controller that watches ConfigMaps and Secrets. When one changes, it finds all Deployments/StatefulSets/DaemonSets that reference it and triggers a rolling restart. It's the "have you tried turning it off and on again" of the cloud-native world, except automated.
The setup:
infrastructure/reloader/
├── namespace.yaml
├── repository.yaml # stakater.github.io/stakater-charts
├── release.yaml # HelmRelease, watchGlobally: true
└── kustomization.yaml
The HelmRelease is minimal:
values:
reloader:
watchGlobally: true
watchGlobally: true means Reloader watches all namespaces, not just its own. Without this, it'd only restart pods in the reloader namespace, which would be... not useful.
Opting In
Reloader doesn't restart everything by default — you annotate the deployments you want it to watch:
template:
metadata:
annotations:
reloader.stakater.com/auto: "true"
The auto annotation tells Reloader to watch all ConfigMaps and Secrets referenced by the pod — whether mounted as volumes or referenced in envFrom/valueFrom. For the Docker registry, that covers:
registry-tls— the TLS cert (renewed every 24h by cert-manager)registry-config— the registry configuration ConfigMapregistry-s3-secret— the SeaweedFS S3 credentials
One annotation, three reload triggers. If I rotate the S3 credentials, the registry picks them up. If I change the config, it picks it up. If the cert renews, it picks it up. No kubectl rollout restart, no CronJobs, no prayer.
The Deploy
Pushed, reconciled, and Reloader came up in under a minute:
reloader-reloader-reloader-67c49d44b6-8zm5x 1/1 Running 0
Yes, the pod name is reloader-reloader-reloader. The Helm release is named reloader, the chart is named reloader, and the deployment inside the chart is named reloader. It's the Forgejo service name problem all over again, but worse.
The registry pod was already restarted by Reloader within seconds of the annotated deployment being applied — it detected the annotation, checked the referenced secrets, and decided a restart was warranted (probably because the secret had been updated more recently than the pod started). New pod came up with the current cert. Old pod terminated.
What Else Gets This
Anything with cert-manager certificates that doesn't handle reload natively. Right now that's just the Docker registry. But the annotation is there for whenever the next thing needs it. Two lines of YAML and the problem disappears forever.
I should probably go through the cluster and audit which other deployments mount cert-manager secrets. That's a future-me problem. Present-me is just happy the registry won't silently serve expired certs anymore.
Exposing the MCP Server: Gateway, TLS, and the 14-Minute Loop
The Goal
The MCP server has been running on the cluster for a while now, but Claude Code was talking to it via a local stdio process — basically just shelling out to a binary on my machine. That's fine for development, but the whole point of deploying this thing to the bramble was to have it on the bramble. Running on Pi hardware. Talking to cluster APIs. Being a real service.
So: expose it through the gateway at mcp.goldentooth.net, configure Claude Code to connect to it over SSE, and then — because why not — test the entire CI/CD pipeline end-to-end by adding a new tool and timing how long it takes from git push to "Claude Code can call the new function."
Gateway Route
The MCP server was already deployed in the goldentooth-mcp namespace with a Service on port 8080. Getting it onto the gateway was the easy part — just another HTTPRoute:
apiVersion: gateway.networking.k8s.io/v1
kind: HTTPRoute
metadata:
name: goldentooth-mcp
namespace: goldentooth-mcp
spec:
parentRefs:
- name: goldentooth
namespace: gateway
sectionName: https
hostnames:
- mcp.goldentooth.net
rules:
- backendRefs:
- name: goldentooth-mcp
port: 8080
Added mcp.goldentooth.net to the gateway Certificate's dnsNames list so cert-manager would include it in the next TLS cert. Quick curl confirmed it was live:
$ curl -ks -H "Accept: text/event-stream" https://mcp.goldentooth.net/sse
Bad Request: Session ID is required
That's the correct response for an SSE endpoint with no session. We're in business.
Configuring Claude Code: The TLS Saga
This is where it got annoying.
Claude Code supports remote MCP servers over HTTP/SSE. The config is straightforward — run claude mcp add --transport http goldentooth-mcp https://mcp.goldentooth.net/sse and it writes the config to ~/.claude.json. Simple.
Except it couldn't connect. Failed to connect on every attempt.
The issue: TLS. The gateway serves certs signed by the Step-CA intermediate, and Claude Code (being a Node.js app) doesn't trust my private CA by default. You tell Node about custom CAs via NODE_EXTRA_CA_CERTS. Added that to .claude/settings.local.json:
{
"env": {
"NODE_EXTRA_CA_CERTS": "/Users/nathan/goldentooth_ca.crt"
}
}
Still didn't work. Because ~/root_ca.crt was the wrong root CA.
Turns out I had two different PKIs floating around. The old root_ca.crt was from the Raspbian era — before the Talos migration, before Step-CA was even running on the cluster. Different org name (goldentooth vs Goldentooth CA), different key, completely unrelated cert. The gateway certs are signed by the Step-CA intermediate, whose root is Goldentooth CA Root CA. I found the correct root by pulling it from the ClusterIssuer's caBundle:
$ kubectl get clusterissuer -o yaml | grep "caBundle:" | awk '{print $2}' | base64 -d > ~/goldentooth_ca.crt
$ openssl x509 -in ~/goldentooth_ca.crt -noout -subject
subject=O=Goldentooth CA, CN=Goldentooth CA Root CA
With the right root CA, everything connected instantly:
$ NODE_EXTRA_CA_CERTS=~/goldentooth_ca.crt claude mcp list
goldentooth-mcp: https://mcp.goldentooth.net/sse (HTTP) - ✓ Connected
Lessons in MCP Config
I also learned some things the hard way about how Claude Code discovers MCP servers:
claude mcp addwrites to~/.claude.json, not to the.mcp.jsonfiles. The.mcp.jsonfiles are a separate mechanism. I created configs in three different places before figuring this out.- The transport type is
http, notsse. Claude Code useshttpfor all remote MCP servers regardless of whether they use SSE or Streamable HTTP. - Project-scoped
.mcp.jsonfiles need explicit approval viaenableAllProjectMcpServers: truein settings. Makes sense — you don't want random repos auto-connecting to arbitrary MCP servers.
The Pipeline Test
With the MCP server live on the gateway, I wanted to test the full CI/CD loop. Added a simple list_nodes tool to the MCP server — static data returning all 16 bramble nodes with hardware info. Nothing fancy, but enough to be clearly visible as a new tool.
The pipeline:
git push (GitHub)
→ Forgejo mirror sync (every 5m)
→ Forgejo Actions (Kaniko ARM64 build)
→ Registry push
→ Flux ImageRepository scan (every 1m)
→ ImagePolicy selects new tag
→ ImageUpdateAutomation commits to gitops
→ Flux reconciles → new pod
The Timeline
| Event | Time | Delta |
|---|---|---|
git push | 14:28:55 | — |
| Forgejo mirror sync | 14:34:30 | +5:35 |
| Kaniko build complete | 14:40:47 | +6:17 |
| Flux ImagePolicy updated | 14:41:35 | +0:48 |
| New pod running | 14:43:06 | +1:29 |
| Total | 14:11 |
The mirror sync was the first bottleneck at 5 minutes (I got impatient and triggered it manually via the API). The Kaniko build was the real bottleneck at 6+ minutes — compiling a Rust release binary with musl static linking on a Raspberry Pi is just slow, even though it's technically a native build (ARM64 on ARM64). The Dockerfile has cross-compilation tooling installed because it was written to also work from x86 runners, but in this case it's all native. The Flux automation (scan → policy → git commit → reconcile → deploy) was impressively quick at under 2.5 minutes.
MCP Tool Discovery
Once the new pod was running, the interesting question was: does Claude Code see the new list_nodes tool?
No. Not automatically.
MCP tools are discovered at session start. The SSE connection established a session with the old pod, and when that pod died during the deploy, the session died with it. Tool calls returned Session not found. The tool list was stale — still showing only get_version from the original connection.
Running /mcp to reconnect fixed it. Claude Code re-initialized the SSE connection, re-fetched the tool list, and list_nodes appeared. Called it successfully — all 16 nodes returned.
There's a known issue (GitHub #30224) where Claude Code reconnects after a server restart but doesn't re-send the initialize handshake, leaving the session stuck. The /mcp command is the workaround. Not ideal, but workable. The MCP spec does define a notifications/tools/list_changed notification, but Claude Code doesn't handle it yet.
Current State
The MCP server is live at mcp.goldentooth.net and Claude Code connects to it over SSE through the gateway. New tools deployed to the cluster appear after a /mcp reconnect. The full push-to-deploy pipeline takes about 14 minutes, dominated by the ARM64 cross-compile.
The ghost of root_ca.crt from the Raspbian days has been replaced by the correct Step-CA root. One fewer artifact from the before-times cluttering up my home directory.
MCP Server: From Static JSON to Cluster Eyes
The Starting Point
The MCP server was running on the cluster, exposed at mcp.goldentooth.net, and Claude Code could talk to it. But all it could do was return its own version number and a hardcoded list of node names. Useful for proving the pipeline worked, not useful for actually managing the bramble.
The goal: give the MCP server real access to the cluster so it could answer questions about what's actually happening — node health, pod status, workload state, cert expiry, active alerts, logs, metrics. The full observability stack, queryable through natural language via Claude Code.
In-Cluster Kubernetes API Access
RBAC
Kubernetes doesn't let pods talk to the API server by default — you need a ServiceAccount with explicit permissions. Created a read-only ClusterRole:
apiVersion: rbac.authorization.k8s.io/v1
kind: ClusterRole
metadata:
name: goldentooth-mcp-reader
rules:
- apiGroups: [""]
resources: [nodes, pods, services, namespaces, events, configmaps]
verbs: ["get", "list", "watch"]
- apiGroups: ["apps"]
resources: [deployments, statefulsets, daemonsets]
verbs: ["get", "list", "watch"]
- apiGroups: ["batch"]
resources: [jobs, cronjobs]
verbs: ["get", "list", "watch"]
- apiGroups: ["cert-manager.io"]
resources: [certificates, clusterissuers, issuers, certificaterequests]
verbs: ["get", "list", "watch"]
Read-only across the entire cluster. The MCP server can see everything but touch nothing. Bound to a ServiceAccount in the goldentooth-mcp namespace via a ClusterRoleBinding.
One important ordering detail: I pushed the RBAC changes to the gitops repo before pushing the MCP code that depends on it. Flux reconciles gitops in ~5 minutes, and the MCP build takes ~9 minutes through the full CI pipeline. So the ServiceAccount and token are guaranteed to exist by the time the new pod starts. If you get this backwards, kube::Client::try_default() fails because there's no service account token mounted yet.
kube-rs
Added kube and k8s-openapi to the Rust dependencies. The kube crate's Client::try_default() automatically detects the in-cluster environment — it reads the service account token from /var/run/secrets/kubernetes.io/serviceaccount/token and the API server CA cert from the same directory. No configuration needed.
#![allow(unused)] fn main() { let kube_client = match Client::try_default().await { Ok(client) => { tracing::info!("Kubernetes client initialized (in-cluster)"); Some(client) } Err(e) => { tracing::warn!("Kubernetes client not available: {e}"); None } }; }
The client is Option<Client> so the server degrades gracefully when running locally for development — the cluster tools return a clear error instead of panicking.
rmcp Parameter Handling
Discovered that rmcp's #[tool] macro uses a Parameters<T> wrapper for tool inputs, not a #[tool(param)] attribute:
#![allow(unused)] fn main() { #[tool(description = "List pods. Optionally filter by namespace.")] async fn get_pods( &self, Parameters(input): Parameters<NamespaceFilter>, ) -> Result<CallToolResult, McpError> { cluster::get_pods(self.require_kube()?, input.namespace.as_deref()).await } }
The NamespaceFilter struct derives both Deserialize and schemars::JsonSchema, which lets the MCP protocol auto-generate the parameter schema that Claude Code uses for tool discovery.
k8s-openapi Version Dance
Ran into a build error because kube 1.x depends on k8s-openapi 0.25 but I initially specified 0.24 with features = ["latest"]. The latest feature only exists on 0.24, and having two versions of k8s-openapi in the dependency tree causes the build script to panic. Fixed by using k8s-openapi 0.25 with an explicit features = ["v1_32"].
Observability Tools
The Kubernetes API gives us infrastructure state, but the cluster has a full monitoring stack — Prometheus, Loki, Alertmanager, and cert-manager — with their own APIs. Added reqwest for HTTP client calls to these in-cluster services.
cert-manager Certificates
cert-manager CRDs aren't in k8s-openapi (they're custom resources), so I used kube's dynamic API:
#![allow(unused)] fn main() { let certs_api = kube::Api::<kube::api::DynamicObject>::all_with( client.clone(), &kube::discovery::ApiResource { group: "cert-manager.io".into(), version: "v1".into(), api_version: "cert-manager.io/v1".into(), kind: "Certificate".into(), plural: "certificates".into(), }, ); }
Returns every Certificate resource with its ready status, expiry time, renewal time, issuer, and DNS names. Now I can ask "are any certs about to expire?" and get a real answer.
Alertmanager Alerts
Simple REST call to the Alertmanager v2 API:
http://monitoring-kube-prometheus-alertmanager.monitoring.svc:9093/api/v2/alerts
Returns active alerts with severity, status, summary, and description. If something's on fire, this is how I'll know.
Loki Log Queries
LogQL queries against Loki:
http://monitoring-loki.monitoring.svc.cluster.local:3100/loki/api/v1/query_range
Accepts arbitrary LogQL — {namespace="forgejo"} |= "error", {job="systemd-journal"} |= "OOM", whatever. Returns up to 500 log lines with timestamps and stream labels. This is the "what just happened" tool.
Prometheus Metrics
PromQL queries against Prometheus:
http://monitoring-kube-prometheus-prometheus.monitoring.svc.cluster.local:9090/api/v1/query
Instant queries for any metric — up, node_memory_MemAvailable_bytes, rate(container_cpu_usage_seconds_total[5m]). This is the "how's the cluster doing right now" tool.
Build Time
The binary got noticeably bigger with kube-rs, k8s-openapi, reqwest, rustls, and all their transitive dependencies. Build time went from ~6 minutes to ~9 minutes in the Forgejo Actions pipeline. Still native compilation on the Pi (ARM64 on ARM64), but Rust release builds with a heavy dependency tree and musl static linking are just slow on a Raspberry Pi. It is what it is.
Also bumped the pod memory limits from 64Mi to 128Mi — the TLS stack in kube-rs and reqwest needs more headroom than a bare HTTP server.
The Full Tool Set
After this work, the MCP server exposes 11 tools:
| Tool | Source | What it does |
|---|---|---|
get_version | Static | Server version and build SHA |
get_node_status | K8s API | Node readiness, CPU, memory, OS |
get_pods | K8s API | Pod phase, restarts, node placement |
get_namespaces | K8s API | Namespace listing |
get_events | K8s API | Recent cluster events |
get_workloads | K8s API | Deployment/StatefulSet/DaemonSet replicas |
get_certificates | K8s API | cert-manager certificate status and expiry |
get_alerts | Alertmanager | Active alerts with severity |
query_logs | Loki | LogQL log search |
query_metrics | Prometheus | PromQL metric queries |
The server went from "hello world" to "full cluster observability" in two deploys. The next obvious additions are Flux reconciliation status (is everything in sync?) and maybe ntfy notification history. But this is already enough to do a real cluster health check without touching kubectl.
Flux Status and ntfy Notifications: The MCP Server Learns to Read GitOps
Why
The MCP server could already tell me about nodes, pods, workloads, certs, alerts, logs, and metrics. But it couldn't answer "is Flux actually reconciling everything?" or "did ntfy fire any notifications recently?" — which are arguably the two most important questions when you're about to pile new changes onto the cluster.
Flux is the entire deployment mechanism. If a Kustomization is stuck or a HelmRelease is failing, nothing I push is going to land. And ntfy is where all the cluster alerts end up. Not being able to query either of these through the MCP server felt like a gap worth closing.
Flux Status Tools
The CRD Zoo
Flux has a lot of CRDs spread across four API groups:
| API Group | Resources |
|---|---|
kustomize.toolkit.fluxcd.io/v1 | Kustomization |
helm.toolkit.fluxcd.io/v2 | HelmRelease |
source.toolkit.fluxcd.io/v1 | GitRepository, HelmRepository, OCIRepository |
image.toolkit.fluxcd.io/v1beta2 | ImageRepository, ImagePolicy, ImageUpdateAutomation |
None of these are in k8s-openapi, so they all go through kube-rs's dynamic API — same approach as the cert-manager tool from the previous round.
I split the Flux tools into three, because dumping all of this into one response would be overwhelming:
-
get_flux_status— The reconciliation tools: Kustomizations and HelmReleases. These are the "is my stuff deploying?" tools. Returns ready state, last applied revision, source reference, and path. -
get_flux_sources— Where Flux pulls from: GitRepository, HelmRepository, OCIRepository. Returns sync state, URL, and latest artifact revision. -
get_flux_images— The image automation pipeline: ImageRepository (what tags exist?), ImagePolicy (which tag should we use?), ImageUpdateAutomation (did it push a commit?). Returns scan times, tag counts, latest image selections, and last push commits.
Shared Status Extraction
Every Flux resource follows the same status convention — a conditions array with a Ready condition that has status, message, and lastTransitionTime. I pulled this into a shared helper:
#![allow(unused)] fn main() { fn flux_status_summary(data: &serde_json::Value) -> serde_json::Value { let ready = data .pointer("/status/conditions") .and_then(|c| c.as_array()) .and_then(|conditions| { conditions.iter().find(|c| c.get("type").and_then(|t| t.as_str()) == Some("Ready")) }); // ... extract status, message, lastTransitionTime } }
The get_flux_status tool also calculates a not_ready_count across both Kustomizations and HelmReleases, so I can quickly see if anything's broken without reading through every resource.
Concurrent API Calls
Each tool queries multiple CRD types, so I used tokio::join! to fire them in parallel:
#![allow(unused)] fn main() { let lp = ListParams::default(); let (ks_result, hr_result) = tokio::join!( ks_api.list(&lp), hr_api.list(&lp), ); }
One fun detail: you can't write ks_api.list(&ListParams::default()) inside tokio::join! — the temporary ListParams gets dropped before the future resolves. The borrow checker catches it, thankfully. Binding to let lp extends the lifetime.
ntfy Notifications
The Poll API
ntfy has a clever HTTP API for retrieving historical messages. Instead of the streaming SSE endpoint, you add ?poll=1 to get all matching messages as newline-delimited JSON and close the connection:
GET http://ntfy.ntfy.svc:80/cluster-alerts/json?poll=1&since=24h
Each line is a separate JSON object. Most are "event": "message" but there are also keepalive events, so the tool filters to only actual messages.
The get_notifications tool accepts a topic name and an optional since parameter (defaults to 24h). Returns title, message body, priority, tags, and Unix timestamp for each notification.
RBAC
The Flux tools needed new RBAC permissions since we're querying CRDs that weren't in the original ClusterRole. Added read access to all four Flux API groups:
- apiGroups: ["kustomize.toolkit.fluxcd.io"]
resources: [kustomizations]
verbs: ["get", "list", "watch"]
- apiGroups: ["helm.toolkit.fluxcd.io"]
resources: [helmreleases]
verbs: ["get", "list", "watch"]
- apiGroups: ["source.toolkit.fluxcd.io"]
resources: [gitrepositories, helmrepositories, ocirepositories]
verbs: ["get", "list", "watch"]
- apiGroups: ["image.toolkit.fluxcd.io"]
resources: [imagerepositories, imagepolicies, imageupdateautomations]
verbs: ["get", "list", "watch"]
Pushed RBAC to gitops before the MCP code — same ordering trick as last time. Flux reconciles the RBAC in ~5 minutes, the MCP build takes ~9 minutes through the CI pipeline, so the permissions are guaranteed to exist before the new pod starts trying to use them.
The Full Tool Set
The server now exposes 14 tools:
| Tool | Source | What it does |
|---|---|---|
get_version | Static | Server version and build SHA |
get_node_status | K8s API | Node readiness, CPU, memory, OS |
get_pods | K8s API | Pod phase, restarts, node placement |
get_namespaces | K8s API | Namespace listing |
get_events | K8s API | Recent cluster events |
get_workloads | K8s API | Deployment/StatefulSet/DaemonSet replicas |
get_certificates | K8s API | cert-manager certificate status and expiry |
get_alerts | Alertmanager | Active alerts with severity |
query_logs | Loki | LogQL log search |
query_metrics | Prometheus | PromQL metric queries |
get_flux_status | K8s API | Kustomization and HelmRelease reconciliation |
get_flux_sources | K8s API | GitRepository/HelmRepository/OCIRepository sync |
get_flux_images | K8s API | Image automation pipeline status |
get_notifications | ntfy | Recent notifications from any topic |
That's a pretty complete read-only view of the cluster. I can ask about infrastructure state, deployment pipeline status, observability data, and notification history — all through natural language via Claude Code. The only thing missing at this point is write operations, but for those we can just shell out to kubectl.
Netboot Debugging: Stale Assets, Missing Memory, and the IPMI Reboot Hang
The Setup
Fresh off wiring up all the MCP tools and doing a cluster health check, I decided to netboot a node. Specifically, I wanted to PXE boot erenford (slot E) to validate the whole Matchbox + GRUB chain end-to-end. What followed was a three-layer debugging onion that took me from "wrong Talos version" to "why does this 8GB board think it has 3GB" to "why won't this thing reboot."
Layer 1: Stale TFTP Boot Assets
The first hint that something was off: erenford booted into Talos maintenance mode and immediately rejected its machine config:
Failed to load config via platform metal: unknown keys found during decoding:
machine:
install:
grubUseUKICmdline: true
grubUseUKICmdline was added in Talos v1.12.x, but the node was running v1.11.1. How? The TFTP server was serving a kernel and initramfs from September 2025.
The setup-boot-assets.sh init container has a caching check that only looks at file existence:
if [ -f "${SHARED}/start4.elf" ] && [ -f "${SHARED}/RPI_EFI.fd" ]; then
echo "Pi 4 boot assets already present in ${SHARED}, skipping download."
When TALOS_VERSION got bumped from v1.11.1 to v1.12.5 in the ConfigMap, the script saw the old files and said "looks good to me." No version checking. The PVC retained the stale assets across pod restarts.
Fix was straightforward — delete the cached files and let the init container re-download:
kubectl -n netboot exec -it dnsmasq-xxxxx -- sh
rm -rf /var/lib/tftpboot/_shared/ /var/lib/tftpboot/_shared_pi5/
rm -f /var/lib/tftpboot/vmlinuz /var/lib/tftpboot/initramfs-arm64.xz
Then restart the DaemonSet to trigger the init container. Fresh v1.12.5 assets came down, and while I was at it I also refreshed the talos-machine-configs Secret in Matchbox with the current talhelper-generated configs.
The script's caching design is intentional — downloading ~280MB of factory images on every restart would be slow and wasteful. But there's no version stamp. A version-aware cache check would be the proper fix, but deleting the directories works fine for now. The comment at the top of the script even documents this:
# To force a re-download (e.g. after a Talos version bump), delete
# the _shared/ and _shared_pi5/ directories in the TFTP PVC and
# restart the DaemonSet.
Matchbox Deployment Strategy
While debugging, I also hit a fun one: the Matchbox pod got stuck in Pending after a config change. It runs with hostNetwork: true pinned to velaryon, and the old RollingUpdate strategy meant Kubernetes tried to spin up the new pod before killing the old one — but the old pod was holding the port. Classic deadlock for single-replica hostNetwork deployments.
Fixed by switching to Recreate:
spec:
replicas: 1
strategy:
type: Recreate
Layer 2: The 3GB Mystery
With fresh boot assets, erenford netbooted, installed Talos, and joined the cluster. But the MCP health check showed something weird:
erenford 2912972Ki (~2.9 GB)
This is an 8GB Pi 4B. Where did the other 5GB go?
The answer is EDK2 UEFI firmware. The pftf/RPi4 UEFI firmware has a setting called RamLimitTo3GB that defaults to enabled. In ACPI mode this is a DMA addressing concern, but even in DeviceTree mode (which we use — SystemTableMode=2), the default sticks. The firmware tells the kernel "you have 3GB" and the kernel believes it.
Correction: I originally wrote
RamMoreThan3GBhere — that's a hardware capability flag set by ConfigDxe at runtime, not a user-configurable NVRAM variable. The actual policy variable isRamLimitTo3GB. See entry 109 for the full story.
The U-Boot nodes don't have this problem. U-Boot passes through the VideoCore-prepared device tree unmodified, which includes the full memory map with the high region above 0x100000000. EDK2 constructs its own memory map and applies its own policy.
I already had a binary NVRAM patch in the netboot script for SystemTableMode=2. Adding a memory patch was the same pattern — same GUID, same authenticated variable format, just the next slot in the variable store at offset 0x3B00C4. I initially patched RamMoreThan3GB=1, which turned out to be wrong (see entry 109). The corrected patch sets RamLimitTo3GB=0:
NVRAM_OFF2=$((0x3B00C4))
printf '\xaa\x55\x3f\x00' > /tmp/nvram_var2.bin # StartId + State + Reserved
printf '\x07\x00\x00\x00' >> /tmp/nvram_var2.bin # Attributes: NV|BS|RT
# ... (MonotonicCount, TimeStamp, PubKeyIndex — all zero)
printf '\x1c\x00\x00\x00' >> /tmp/nvram_var2.bin # NameSize (28 bytes)
printf '\x04\x00\x00\x00' >> /tmp/nvram_var2.bin # DataSize (4 bytes)
printf '\x58\xc2\x7c\xcd\xdb\x31\xe6\x22' >> /tmp/nvram_var2.bin # GUID part 1
printf '\x9f\x22\x63\xb0\xb8\xee\xd6\xb5' >> /tmp/nvram_var2.bin # GUID part 2
printf 'R\x00a\x00m\x00L\x00i\x00m\x00i\x00t\x00' >> /tmp/nvram_var2.bin
printf 'T\x00o\x003\x00G\x00B\x00\x00\x00' >> /tmp/nvram_var2.bin
printf '\x00\x00\x00\x00' >> /tmp/nvram_var2.bin # Value=0 (disable limit)
dd if=/tmp/nvram_var2.bin of="${SHARED}/RPI_EFI.fd" \
bs=1 seek=${NVRAM_OFF2} conv=notrunc status=none
This fixes it for netbooted nodes — next time a Pi 4B PXE boots, the patched RPI_EFI.fd will expose all 8GB. But dalt and erenford already installed to disk from the old firmware. Their on-disk RPI_EFI.fd still has the default RamLimitTo3GB=1, and Talos doesn't manage the EFI system partition firmware files. They'll stay at 3GB until they're re-imaged via netboot or someone manually patches the firmware on the SD card.
For what it's worth, karstark and lipps also showed reduced memory (~3.8GB each), but that turned out to be hardware — they're from a different batch and are genuinely 4GB boards. Different years, different specs.
Layer 3: The Reboot Hang
This was the fun one. After Talos installed to disk on erenford, it said "rebooting" and then... nothing. Just hung there. Had to walk over and power cycle it.
The culprit: ipmi_poweroff. The kernel log told the story:
ipmi_si: Unable to find any System Interface(s)
ipmi_poweroff: IPMI poweroff module loaded
The Pi 4B has no IPMI hardware. But EDK2's ACPI tables (which it generates even in DeviceTree mode for some things) include enough SMBIOS data that the kernel loads ipmi_si, which then loads ipmi_poweroff. The ipmi_poweroff module registers itself as a reboot handler with a priority of 64 — higher than bcm2835-wdt (the actual Pi watchdog that handles reboots) at priority 128 (lower number = higher priority in the reboot handler chain, but actually it's the opposite in Linux — higher number runs first, but ipmi_poweroff specifically sets SYS_OFF_PRIO_FIRMWARE which takes precedence). The end result: when Talos says "reboot," the kernel calls ipmi_poweroff's handler, which tries to talk to IPMI hardware that doesn't exist, and the system hangs.
U-Boot nodes don't have this problem because U-Boot doesn't generate ACPI/SMBIOS tables. No SMBIOS → ipmi_si never loads → no ipmi_poweroff → bcm2835-wdt handles the reboot cleanly.
The Fix (Partial)
For netbooted nodes, the fix was easy — add the module blacklist to the GRUB kernel command line:
linux /vmlinuz ... modprobe.blacklist=ipmi_si,ipmi_poweroff
This is already pushed to gitops and will take effect on the next Flux reconciliation.
For disk-booted nodes, I tried adding extraKernelArgs to the talconfig worker patches:
worker:
patches:
- |-
machine:
install:
extraKernelArgs:
- modprobe.blacklist=ipmi_si,ipmi_poweroff
grubUseUKICmdline: false
But Talos v1.12.5 defaults to SDBoot (systemd-boot), and SDBoot ignores extraKernelArgs entirely:
WARNING: extra kernel arguments are not supported when booting using SDBoot
The grubUseUKICmdline: false setting doesn't switch it back to GRUB — it's about UKI command line behavior within GRUB, not about choosing between GRUB and SDBoot. So the blacklist in talconfig.yaml is there for correctness but doesn't actually take effect on disk-booted EDK2 nodes right now.
The workaround for dalt and erenford is manual power-cycle after any operation that triggers a reboot. Not great, but these are the only two EDK2-booted nodes (the rest use U-Boot from their original SD card installs), and they'll get the fix when they next netboot.
The Memory Map
After all this, here's where the cluster's Pi 4B memory situation landed:
| Node | Boot Method | Firmware | Memory Visible | Actual RAM |
|---|---|---|---|---|
| allyrion–cargyll | SD (U-Boot) | VideoCore DT | 8 GB | 8 GB |
| dalt | SD (EDK2) | EDK2 (old) | 3 GB | 8 GB |
| erenford | SD (EDK2) | EDK2 (old) | 3 GB | 8 GB |
| fenn–jast | SD (U-Boot) | VideoCore DT | 8 GB | 8 GB |
| karstark | SD (U-Boot) | VideoCore DT | 4 GB | 4 GB |
| lipps | SD (U-Boot) | VideoCore DT | 4 GB | 4 GB |
The EDK2 nodes got their firmware from the netboot install — when they PXE booted, the firmware on the TFTP server didn't have the RamMoreThan3GB patch yet. The fix is baked into the netboot assets now, so any future PXE installs will get the full 8GB.
Lessons
The caching-without-versioning pattern in the boot asset script is a known compromise documented in comments, but it bit us. Worth considering a version stamp file (echo "$TALOS_VERSION" > ${SHARED}/.version) for the future.
The EDK2-vs-U-Boot firmware difference is the gift that keeps giving. EDK2 gives us UEFI and PXE boot (which U-Boot on Pi 4 doesn't support well), but it also brings ACPI/SMBIOS baggage that triggers kernel modules designed for server hardware. Binary-patching NVRAM variables to fix firmware defaults is... not my favorite thing, but it works and it's reproducible.
The Wrong Variable: RamLimitTo3GB
The Bug Report From Last Time
In the previous entry I documented the 3GB mystery — 8GB Pi 4B boards showing up with only 3GB of visible RAM under EDK2 UEFI. I wrote a binary NVRAM patch to set RamMoreThan3GB=1 in the firmware, same approach as the SystemTableMode=2 patch that was already working. Deployed it, declared victory, moved on.
Erenford still had 3GB.
Reading the Source
I should have done this first. The EDK2 ConfigDxe driver for RPi4 uses two variables for memory policy, and I patched the wrong one.
PcdRamMoreThan3GB is a hardware capability flag. ConfigDxe sets it dynamically by probing the board's installed memory. If the Pi has more than 3GB, this gets set to 1. It is never read from NVRAM — it's computed at runtime from the hardware. Writing it into the NVRAM store is like leaving a sticky note on a thermometer: the thermometer doesn't care what you wrote.
PcdRamLimitTo3GB is the policy variable. This one is read from NVRAM via gRT->GetVariable(). Its compiled default is 1 — limit enabled. When ConfigDxe initializes, it checks NVRAM for RamLimitTo3GB. If it's not there, it falls back to the default: "yes, limit to 3GB." This is the variable exposed in the UEFI setup menu under "RAM limit."
From RPi4.dsc:
gRaspberryPiTokenSpaceGuid.PcdRamMoreThan3GB|L"RamMoreThan3GB"|gConfigDxeFormSetGuid|0x0|0
gRaspberryPiTokenSpaceGuid.PcdRamLimitTo3GB|L"RamLimitTo3GB"|gConfigDxeFormSetGuid|0x0|1
The default of 0 for RamMoreThan3GB and 1 for RamLimitTo3GB should have been a clue. The names even tell the story: "more than 3GB" is a fact about the hardware; "limit to 3GB" is a choice about policy.
The Fix
Changed the NVRAM patch from RamMoreThan3GB=1 to RamLimitTo3GB=0:
NVRAM_OFF2=$((0x3B00C4))
# ... (same authenticated variable header format)
printf '\x1c\x00\x00\x00' >> /tmp/nvram_var2.bin # NameSize (28 bytes, not 30)
printf '\x04\x00\x00\x00' >> /tmp/nvram_var2.bin # DataSize (4 bytes)
# ... (same ConfigDxe GUID)
printf 'R\x00a\x00m\x00L\x00i\x00m\x00i\x00t\x00' >> /tmp/nvram_var2.bin
printf 'T\x00o\x003\x00G\x00B\x00\x00\x00' >> /tmp/nvram_var2.bin
printf '\x00\x00\x00\x00' >> /tmp/nvram_var2.bin # Value=0 (disable limit)
Three things changed: the variable name (RamLimitTo3GB is one character shorter, so NameSize drops from 30 to 28), the value (0 instead of 1 — we're disabling a limit, not enabling a capability), and the comments now explain the two-variable relationship so the next person who reads this binary-patching monstrosity understands why.
Cleared the TFTP cache, restarted the dnsmasq DaemonSet, verified the patched firmware via hexdump. The corrected variable is sitting at offset 0x3B00C4 waiting for the next PXE boot.
Status
Not yet tested. Neither erenford nor dalt has been rebooted since the fix was deployed. The SystemTableMode=2 patch at the same offset range was confirmed working (device tree entries visible in dmesg), so the NVRAM patching mechanism itself is sound — we were just talking to a variable that nobody was listening to.
Next time either EDK2 node PXE boots, we'll know if this was the whole story or if there's yet another layer to this onion.
Falco: The Closed-Channel Spin Loop
Something Smells Funny
Routine cluster health check. Seventeen nodes, all green, Flux reconciled, the usual. But Alertmanager had opinions: six Falco pods reporting 100% CPU throttling, the Falco DaemonSet "stuck," and a misscheduled pod somewhere. This had been going on since March 18th — a full week of Falco screaming into the void while I was off doing netboot stuff.
The CPUThrottlingHigh alerts were all severity: info, which is Prometheus-speak for "I'm going to make noise but not actually page anyone." So they just sat there, accumulating.
The Numbers Don't Add Up
First instinct: the 500m CPU limit is too tight for Pis. Falco intercepts every syscall on the node, and even idle Kubernetes generates a surprising amount of open() and connect() traffic. Maybe 500 millicores just isn't enough for a 4-core ARM board running a dozen DaemonSets.
Pulled the Falco internal metrics snapshots from Loki. Falco helpfully emits these every hour, including its own CPU usage, event rates, memory, the works. And that's where things got weird:
| Node | Falco CPU | evts/s | Host CPU |
|---|---|---|---|
| gardener | 50.0% | 2,345 | 20.7% |
| harlton | 50.0% | 2,146 | 20.0% |
| lipps | 50.0% | 1,901 | 20.1% |
| erenford | 50.0% | 2,318 | 20.3% |
| norcross | 50.0% | 3,366 | 15.8% |
| cargyll | 3.9% | 3,162 | 39.7% |
| bettley | 3.4% | 1,994 | 33.5% |
| manderly | 0.8% | 3,274 | 5.6% |
Cargyll is processing more events per second than gardener — 3,162 vs 2,345 — while using thirteen times less CPU. Bettley has 33.5% host CPU (way busier than any throttled node) and Falco barely notices. The event rates across all nodes are roughly comparable, 1,900 to 3,400/s, but CPU usage is bimodal: either ~3% or pegged at exactly 50.0%.
No middle ground. No correlation with workload. Same Falco version, same config SHA, same rules SHA, same kernel. Identical configuration producing wildly different behavior.
This is not a "needs more resources" problem.
Digging Deeper
Pulled the full metrics comparison across all 16 pods. Key findings:
- Config and rules SHAs identical across every pod. Same
de2c7a2dca28...config, samee2d7fd0536cc...rules. No drift. - Container/thread counts don't correlate with throttling. Norcross tracks 877 threads at 50% CPU; oakheart tracks 647 threads at 0.8%.
- Rule match counts are irrelevant. Cargyll had 59,764 rule matches (mostly
Contact_K8S_API_Server_From_Container), gardener had zero. Cargyll used 3.9% CPU. n_retrieve_evts_dropsratio — Falco's internal sinsp event retrieval drops — was ~22% across all nodes, healthy and sick alike.scap.n_drops: 0everywhere — the kernel eBPF ring buffer wasn't dropping. The problem was in userspace.
The bimodal distribution — 3% or exactly 50%, nothing in between — is a classic symptom of a non-deterministic initialization bug. Something happens at startup that puts the Falco process into one of two states.
The Bug
Web search turned up falcosecurity/falco#3610: a known bug in the container plugin (v0.2.4, bundled with Falco 0.41.0).
The root cause: when the CRI socket doesn't support event streaming, the Go-side GetContainerEvents call fails and closes a channel. In Go, reading from a closed channel returns instantly with nil — it doesn't block, it doesn't panic, it just returns the zero value forever. This creates an infinite busy loop spinning on the closed channel, pegging exactly one CPU core.
Whether a pod hits the bug depends on a race condition during CRI Listen() at startup. Win the race → channel stays open → 3% CPU. Lose it → channel closes → spin loop → pegged at the 500m limit (50% of one core on a 4-core Pi).
That explains everything:
- Bimodal CPU — two possible initialization states, nothing in between
- No workload correlation — the CPU burn is the spin loop, not syscall processing
- Same config, different results — timing-dependent, not config-dependent
- ~20% host CPU on all throttled nodes — the spin loop contributes a consistent base load
Fixed in container plugin v0.3.4, shipped with Falco 0.43.0 (Helm chart 8.x).
The Upgrade
Chart 4.x → 8.x is a four-major-version jump, but the actual breaking changes are mild:
collectors.containerdwas removed in chart 7.0.0, replaced bycollectors.containerEngine.engines.containerdwith asocketsarray instead of a singlesocketstring.falco.metricswas promoted to a top-levelmetrics:block with aservice.enabledsubkey.- Default image flavor changed from debian to wolfi (distroless). Transparent unless you need tools inside the container.
Everything else — outputs, serviceMonitor, falcosidekick config, driver settings — carried over unchanged.
The diff:
# Chart version
- version: ">=4.0.0 <5.0.0"
+ version: ">=8.0.0 <9.0.0"
# Collectors
- collectors:
- containerd:
- enabled: true
- socket: /run/containerd/containerd.sock
+ collectors:
+ containerEngine:
+ enabled: true
+ engines:
+ containerd:
+ enabled: true
+ sockets: ["/run/containerd/containerd.sock"]
# Metrics promoted to top-level
- metrics:
- enabled: true
+ metrics:
+ enabled: true
+ service:
+ enabled: true
The Rollout
Pushed to gitops, Flux picked it up within two minutes. The HelmRelease reconciled to falco@8.0.1 and the DaemonSet started a rolling update. Watched the pods cycle through one by one:
- First batch (allyrion, erenford, harlton, gardener): up on 0.43.0 within a few minutes
- Image pull is the bottleneck — Pi 4Bs on their little SD cards aren't exactly speed demons
- Full rollout across all 16 nodes took about 10 minutes
Post-rollout: all 16 pods running falco:0.43.0, zero restarts, and — the important bit — every single Falco alert cleared. The KubeDaemonSetRolloutStuck, KubeDaemonSetMisScheduled, and all six CPUThrottlingHigh alerts vanished. The only remaining alerts are the pre-existing MetalLB and SeaweedFS CSI issues, which are problems for another day.
Also picked up two bonus fixes with this upgrade:
- scap_init fix for kernel 6.18.7+ (#3813) — relevant since our Talos nodes run 6.18.15
- Thread table memory leak fix (libs #2854) — slow leak in jemalloc introduced in 0.40.0
Lessons
The Go closed-channel thing is worth internalizing. In most languages, reading from a closed/invalid handle either blocks forever or throws an exception — both of which are loud failures you'd notice immediately. In Go, a receive on a closed channel is a valid operation that returns the zero value instantly. It's by design (it's how range over a channel knows to stop), but it means an accidental select on a closed channel becomes a silent infinite loop. The code looks correct. The CPU usage is the only symptom.
Also: bimodal distributions in system metrics are almost never a workload problem. If a metric clusters at two distinct values with nothing in between, you're looking at a state machine with two possible states, not a resource constraint. The correct response is "why are there two states?" not "how do I add more resources?"
SeaweedFS CSI: The FUSE Mount Massacre
The Setup
Routine alert triage. SeaweedFS CSI DaemonSet was flagged as "rollout stuck" — the mount pods were running mixed image tags. Some on v1.4.5, some on latest (which resolved to an older build). The CSI DaemonSet uses an OnDelete update strategy, which means pods don't auto-update when the spec changes. You have to manually delete each pod to pick up the new image. This is by design — you don't want FUSE mount daemons restarting under active volumes.
So I did a careful rolling restart. Phase one: the seven nodes with no active PVC consumers. Phase two: the four nodes hosting pods with SeaweedFS-backed PVCs (Prometheus, Alertmanager, Loki, Tempo, and some others). All 13 mount pods came up on v1.4.5. The DaemonSet went green. Alert cleared.
And then everything caught fire.
Transport Endpoint Is Not Connected
Within minutes, Alertmanager started screaming: KubeletDown, KubeAPIDown. Both critical. Both saying "Target disappeared from Prometheus target discovery."
First thought: the cluster is down. Checked node status — all 17 nodes Ready. Checked the API — responding fine (how else would I be running kubectl?). Checked Prometheus workloads — all pods Running with correct replica counts.
Then I queried Prometheus directly:
up{job="kubelet"} → empty
up{job="apiserver"} → empty
count by (job) (up) → empty
prometheus_build_info → empty
Every query returned empty. Prometheus was running but had zero data. Pulled the logs:
ts=2026-03-25T21:45:23.621Z level=error component="scrape manager"
msg="Scrape commit failed"
err="write to WAL: log samples: write /prometheus/wal/00000393:
transport endpoint is not connected"
ENOTCONN — the Linux kernel's way of saying "this FUSE mount is dead and the daemon that was serving it is gone." Every single scrape across every target was failing to write to the WAL. Prometheus was collecting metrics over the network just fine, but couldn't persist them to disk.
Checked Alertmanager, Loki, and Tempo — all the same:
# Alertmanager
chdir to cwd ("/alertmanager"): transport endpoint is not connected
# Loki
write /var/loki/wal/00003094: transport endpoint is not connected
# Tempo
open /var/tempo/traces: transport endpoint is not connected
Every SeaweedFS-backed statefulset in the monitoring namespace had a dead FUSE mount. Four out of four.
What Happened
When a SeaweedFS CSI mount pod restarts, the kernel-side FUSE mount loses its userspace connection. The mount point still exists in the filesystem namespace — it's still in the kernel's mount table — but any I/O to it immediately returns ENOTCONN. The new CSI mount pod starts fresh and establishes new FUSE mounts for new volume requests, but it doesn't re-attach to existing mounts from the old pod. It can't — those mounts are kernel state tied to the old process.
This is the exact scenario the OnDelete update strategy was designed to prevent. The idea is: you delete the mount pod, then immediately restart the consumer pods so they get fresh mounts from the new daemon. But I did the rolling restart in the wrong order — I updated the mount pods and then... didn't restart the consumers. The monitoring pods sat there with their dead FUSE mounts, unable to write, firing alerts about targets disappearing from discovery.
The Recovery
Phase 1: The Easy Ones
Deleted all four monitoring statefulset pods:
kubectl delete pod -n monitoring \
prometheus-monitoring-kube-prometheus-prometheus-0 \
alertmanager-monitoring-kube-prometheus-alertmanager-0 \
monitoring-loki-0 \
monitoring-tempo-0
The StatefulSet controller recreated them. Alertmanager landed on fenn, Loki on inchfield, Tempo on harlton. All three got rescheduled to different nodes than before, which meant new VolumeAttachments, new FUSE mounts, clean start. They came up fine.
Prometheus got rescheduled back to payne. Same node, same stale mount path. The kubelet tried to mount the volume and hit:
MountVolume.MountDevice failed: mkdir .../globalmount: file exists
The stale FUSE mount point was still sitting in the kubelet's CSI plugin directory. The directory existed, but it pointed at a dead FUSE daemon. The kubelet couldn't create it (it already exists) and couldn't use it (it's dead).
Phase 2: The Multi-Attach Problem
The three pods that moved to new nodes hit a different issue:
Multi-Attach error for volume "pvc-8b86c8c4-..."
Volume is already exclusively attached to one node and can't be attached to another
The old VolumeAttachments still pointed at the original nodes. RWO volumes can only attach to one node at a time, and the stale attachments were blocking the new ones. Fixed by deleting the four VolumeAttachments — safe because the old mounts were already dead.
Alertmanager, Loki, and Tempo came up after that. Prometheus remained stuck on payne.
Phase 3: The Prometheus Odyssey
The globalmount: file exists error meant the stale FUSE mount point needed manual cleanup. Reached into the CSI mount pod on payne (which has /var/lib/kubelet/plugins host-mounted) and unmounted the dead FUSE:
kubectl exec -n seaweedfs seaweedfs-seaweedfs-csi-driver-mount-zcmzj -- \
umount /var/lib/kubelet/plugins/kubernetes.io/csi/seaweedfs-csi-driver/\
0cb68b644c2fe52cc3e0a05245c524eba0a80fd8c2b144ce5fe6b4680fa64822/globalmount
kubectl exec -n seaweedfs seaweedfs-seaweedfs-csi-driver-mount-zcmzj -- \
rmdir /var/lib/kubelet/plugins/kubernetes.io/csi/seaweedfs-csi-driver/\
0cb68b644c2fe52cc3e0a05245c524eba0a80fd8c2b144ce5fe6b4680fa64822/globalmount
Prometheus pod got recreated, volume attached, mount attempted... and hit:
open /prometheus/queries.active: permission denied
panic: Unable to create mmap-ed active query log
The fresh FUSE mount was owned by root:root. Prometheus runs as uid 1000, gid 2000. Fixed the ownership via the CSI mount pod:
kubectl exec -n seaweedfs ... -- chown 1000:2000 .../globalmount
kubectl exec -n seaweedfs ... -- chmod 775 .../globalmount
Still crashed. FUSE mounts don't reliably honor chown — the FUSE daemon controls access, and default_permissions mode uses the kernel's permission checking against the UID the daemon reports, not what you set with chown. The chown appeared to work (the directory showed 1000:2000 in ls -la) but the FUSE daemon still rejected writes.
Deleted the pod again, deleted the VolumeAttachment again, and nuked the entire stale CSI volume directory:
kubectl exec -n seaweedfs ... -- rm -rf \
/var/lib/kubelet/plugins/kubernetes.io/csi/seaweedfs-csi-driver/\
0cb68b644c2fe52cc3e0a05245c524eba0a80fd8c2b144ce5fe6b4680fa64822
Now the CSI driver should recreate the whole thing from scratch. Except it didn't. The CSI node plugin went straight to NodePublishVolume (bind mount) without running NodeStageVolume (FUSE mount) first. The kubelet had cached the "this volume is already staged" state in memory, so it skipped the staging step entirely. The bind mount failed because the source directory didn't exist.
The fix: restart the CSI node pod on payne (not the mount pod — the node pod handles the gRPC lifecycle):
kubectl delete pod -n seaweedfs seaweedfs-seaweedfs-csi-driver-node-c9zpg
This forced the kubelet to re-register the CSI driver and re-run the full attach → stage → publish flow. The new CSI node pod came up, NodeStageVolume ran, created the globalmount directory, established a fresh FUSE mount, NodePublishVolume bind-mounted it into the pod, and Prometheus finally started.
The Aftermath
All four monitoring pods running. Prometheus scraping all targets. Alertmanager back to just the Watchdog canary. Loki ingesting logs. Tempo polling traces.
Prometheus lost its historical TSDB data — the fresh FUSE mount came up empty. The data still exists in SeaweedFS (the volume bucket wasn't deleted), but the WAL state was corrupt from all the ENOTCONN writes, and the new mount apparently didn't recover the old blocks. This is a known limitation of FUSE-backed Prometheus — the WAL isn't crash-safe when the underlying mount disappears mid-write. The TSDB will rebuild from new scrapes. A week of historical data, gone. Not ideal, but not catastrophic.
The CSI FUSE Recovery Playbook
For future me, the full recovery chain when a SeaweedFS FUSE mount goes stale:
- Unmount the dead FUSE:
umountvia a pod with host access - Remove the stale directory:
rm -rfthe entire CSI volume hash directory - Delete the VolumeAttachment: So the CSI controller re-attaches
- Restart the CSI node pod on that host: To clear the kubelet's "already staged" cache
- Delete the consumer pod: So it gets recreated with fresh mounts
Steps 1-4 must all happen. Skipping any one of them leaves you stuck in a different failure mode. I learned this the hard way, one step at a time.
Collateral Damage: Forgejo
With the monitoring stack back online, Prometheus re-discovered what it could see. Among the new alerts: Forgejo replica mismatch. The deployment showed 1 desired, 0 ready, 1 unavailable — even though the pod was technically Running.
Pulled Forgejo's logs:
SQLite3 file exists check failed with error:
stat /data/forgejo.db: transport endpoint is not connected
Same disease. Forgejo on oakheart had a SeaweedFS PVC for its SQLite database, and the FUSE mount was dead. The health check was returning 424 (Failed Dependency) every 10 seconds, so the readiness probe kept the pod in a permanent not-ready state.
This one needed the full playbook too. Just deleting the pod wasn't enough — the new pod landed on oakheart again and the kubelet reused the same stale pod volume path. CreateContainerError before the init container could even start, because the container runtime couldn't stat the mount point.
Ran the five-step recovery: unmount both the globalmount and the pod bind mount, nuke the CSI volume directory, delete the VolumeAttachment, restart the CSI node pod on oakheart, then delete the Forgejo pod. The new pod came up clean, init containers ran through, and Forgejo was back with its SQLite database intact.
The MetalLB Ghost
One more alert was lurking: MetalLB speaker DaemonSet "misscheduled" and "rollout stuck." This one had been around since before the FUSE incident — it predated the Prometheus data loss and re-fired from fresh scrapes.
The numbers: desiredNumberScheduled: 15, currentNumberScheduled: 15, numberMisscheduled: 1. But 16 speaker pods were running, one on every non-velaryon node. The DaemonSet controller thought only 15 nodes were eligible.
Checked everything:
- All 16 non-velaryon nodes have
kubernetes.io/os: linux(nodeSelector match) - Only taints are
control-plane:NoScheduleon allyrion/bettley/cargyll (tolerated), andplatform=x86:NoSchedule+gpu=true:NoScheduleon velaryon (correctly excluded) - No nodes unschedulable, no unusual conditions, no resource constraints
- All pods on the same controller-revision-hash — no stale generation leftovers
- No affinity rules, no pod disruption budgets
By every metric I could check, 16 nodes were eligible. The DaemonSet controller disagreed.
The fix was anticlimactic: kubectl rollout restart daemonset. This bumps the pod template annotation, forcing the controller to re-evaluate node eligibility from scratch. After the restart, desiredNumberScheduled jumped to 16, numberMisscheduled dropped to 0, and the rollout completed across all 16 nodes.
The controller's eligibility cache had gone stale at some unknown point — probably during a node taint change or temporary condition — and never recalculated because the DaemonSet spec hadn't changed. It sat there for who knows how long, insisting that 15 was the right number while 16 pods ran happily.
Lessons
The OnDelete DaemonSet strategy is a trap that teaches you a lesson every time you interact with it. It exists for a good reason — you don't want FUSE mounts disappearing under active workloads — but it creates a coordination problem: you need to restart consumers immediately after restarting the mount daemon. There's no grace period. The moment the old mount pod dies, every volume it was serving becomes an ENOTCONN time bomb.
The correct procedure for a SeaweedFS CSI rolling restart: for each node, delete the mount pod, wait for the new one, then immediately bounce every pod on that node that uses a SeaweedFS volume. Not "later." Not "after all mount pods are updated." Immediately, per-node, in lockstep. I did the mount pods first and the consumers never, which is the one ordering that guarantees maximum carnage.
Also: the kubelet's CSI staging cache is invisible and persistent. If you clean up a CSI volume's globalmount directory, the kubelet still thinks the volume is staged and will skip NodeStageVolume on the next mount attempt. The only way to clear that cache is to restart the CSI node pod, which forces driver re-registration. This is not documented anywhere I could find.
And: DaemonSet controllers can cache stale node eligibility counts indefinitely. If numberMisscheduled is non-zero but you can't find a reason any node should be ineligible, a rollout restart forces a full recalculation. It's the DaemonSet equivalent of "have you tried turning it off and on again."
Bluesky PDS: Giving the Theatre Characters Social Media Accounts
Why
The Theatre project runs autonomous AI characters — entities with persistent identities, inner lives, and the ability to interact with the world. One of the worlds they should be able to interact with is Bluesky, via the AT Protocol. To do that, they need accounts on a PDS (Personal Data Server) that I control.
Running your own PDS is one of the genuinely novel things about AT Protocol. Unlike Mastodon, where "running your own instance" means running an entire social network that happens to federate, a PDS is just a data host. Your posts, follows, and identity live there, but the heavy lifting — indexing, search, feeds, moderation — happens at relay and app view servers run by Bluesky (or anyone else who wants to). The PDS just stores data and speaks WebSocket to the relay when things change.
This makes it surprisingly lightweight to self-host. Which is good, because I'm running it on a Raspberry Pi.
The Architecture
The PDS is a Node.js application backed by SQLite. That last part is important: SQLite databases cannot run reliably over FUSE or network filesystems. ENOTCONN on a WAL write is not a hypothetical — I literally just had a week-long SeaweedFS CSI meltdown caused by exactly this. So the PDS needs local storage.
I pinned the deployment to the Pi 5 nodes with NVMe drives, using the local-path StorageClass:
nodeSelector:
node.kubernetes.io/disk-type: nvme
20Gi PVC, Recreate strategy (because SQLite and two writers don't mix), and the usual resource limits. The PDS image is ghcr.io/bluesky-social/pds:0.4, which turned out to listen on port 2583 by default — not 3000, which is what every tutorial and blog post on the internet claims. I spent a solid ten minutes watching an empty log stream and a connection-refused health check before running netstat inside the pod and discovering the truth.
Federation config is straightforward:
- name: PDS_HOSTNAME
value: "pds.goldentooth.net"
- name: PDS_BSKY_APP_VIEW_URL
value: "https://api.bsky.app"
- name: PDS_BSKY_APP_VIEW_DID
value: "did:web:api.bsky.app"
- name: PDS_REPORT_SERVICE_URL
value: "https://mod.bsky.app"
- name: PDS_REPORT_SERVICE_DID
value: "did:plc:ar7c4by46qjdydhdevvrndac"
- name: PDS_CRAWLERS
value: "https://bsky.network"
That PDS_REPORT_SERVICE_DID was a fun one. PDS 0.4 has an assertion that says "if you configure a report service URL, you must also configure its DID." The error message is clear enough. But the official install script doesn't set the DID, so if you're assembling the env vars by hand from the script source, you'll miss it. First crash was on startup: AssertionError: if report service url is configured, must configure its did as well.
The Ingress Odyssey
This is where a simple deployment became a three-act play.
Act I: Cloudflare Tunnel (The Obvious Choice)
The bramble lives behind a residential ISP connection with a dynamic IP and no port forwarding. Cloudflare Tunnel seemed perfect — outbound-only connection, free tier, no ports to open. I set up the whole thing: Terraform for the tunnel resource and DNS CNAMEs, a shared cloudflared deployment in the infrastructure kustomization, SOPS-encrypted tunnel token.
The cloudflared pod came up immediately, registered four connections at Cloudflare's Cleveland and DC edge nodes. Beautiful.
Then I tried to hit pds.goldentooth.net from outside and got Could not resolve host. Turns out the CNAME to <tunnel-id>.cfargotunnel.com only works when the domain's DNS is managed by Cloudflare. My DNS is on Route53. The cfargotunnel.com hostname doesn't resolve via normal DNS — it's only meaningful to Cloudflare's proxy layer, which only activates for domains on their nameservers.
I briefly considered moving DNS to Cloudflare, then considered a subdomain delegation (nope, requires Business plan), then considered Tailscale Funnel.
Act II: Tailscale Funnel (The Modern Choice)
Tailscale Funnel: expose local services to the public internet through Tailscale's relay network. The Kubernetes operator can annotate a Service and boom, public endpoint. Cool.
One problem: Funnel doesn't support custom domains. It only serves on *.ts.net hostnames. There's a feature request with 194 upvotes and no timeline. AT Protocol requires your PDS to be reachable at your custom domain for federation. A ts.net hostname won't work.
Act III: Just Open the Damn Port
After trying two different tunnel services designed to avoid port forwarding, I did what I've been doing for twenty years: forwarded port 443 on my router to the cluster's gateway IP.
Sometimes the boring solution is the right one.
The Gateway Setup
The cluster already had Cilium's Gateway API handling all internal HTTPS traffic — Grafana, Forgejo, ntfy, etc. — behind a MetalLB L2 address at 10.4.11.1. All using an internal Step-CA certificate.
For public access I needed a publicly trusted cert. I added a second HTTPS listener to the existing Gateway with a Let's Encrypt wildcard certificate:
- name: https-public
protocol: HTTPS
port: 443
hostname: "*.goldentooth.net"
tls:
mode: Terminate
certificateRefs:
- name: gateway-tls-public
namespace: gateway
Cilium uses SNI to route between the listeners — requests for pds.goldentooth.net get the LE cert, everything else gets the internal Step-CA cert. The cert-manager ClusterIssuer uses DNS-01 challenges via Route53 (the AWS credentials already existed for the internal ACME issuer). The wildcard cert came back in under two minutes.
For handle resolution (hamlet.pds.goldentooth.net), I added a third listener on *.pds.goldentooth.net with the same LE cert. Wildcard certs only cover one subdomain level, so *.goldentooth.net doesn't cover hamlet.pds.goldentooth.net — needed an explicit SAN.
Dynamic DNS
The missing piece: my public IP changes. I built a CronJob that runs every 5 minutes, checks the public IP via ifconfig.me, and updates Route53 directly via the AWS CLI:
image: amazon/aws-cli:2.27.31
command:
- /bin/sh
- -c
- |
PUBLIC_IP=$(curl -sf https://ifconfig.me || curl -sf https://api.ipify.org)
# ... check current record, UPSERT if changed
aws route53 change-resource-record-sets --hosted-zone-id "$ZONE_ID" --change-batch ...
I originally tried to be clever about this — have the CronJob patch an annotation on the HTTPRoute, let external-dns pick it up and update Route53. Turns out external-dns's Gateway API source doesn't honor the target annotation. It always resolves endpoints from the Gateway's LoadBalancer IP. After watching external-dns happily set pds.goldentooth.net to 10.4.11.1 (the internal MetalLB IP), I gave up on elegance and just called the Route53 API directly.
I also learned that wget on Alpine returns HTML from ifconfig.me (because user agent), that bitnami/kubectl doesn't have ARM64 images, and that Route53's wire format uses \052 for * in wildcard records but the API expects a literal * in the JSON payload. Each of these cost about five minutes of "why doesn't this work."
Backup
Hourly CronJob with two stages: an init container runs sqlite3 .backup to create consistent snapshots of the account and sequencer databases, then the main container runs rclone to sync to both SeaweedFS S3 (local) and AWS S3 (offsite). The Pis are running off NVMe now, but the habit of paranoid backups is well-earned — I've had SD cards corrupt mid-write more times than I care to admit.
What's Working
- PDS responds at
https://pds.goldentooth.net/xrpc/_healthwith{"version":"0.4.208"} - Handle resolution ready at
*.pds.goldentooth.netvia HTTP well-known - DDNS updates Route53 every 5 minutes
- Hourly backups to two S3 targets
- Let's Encrypt wildcard cert auto-renewing
PDS_CRAWLERSconfigured, so the relay atbsky.networkwill discover accounts when they post
What's Next
Theatre needs to integrate account creation via the PDS admin API. When a character is born, Theatre creates a Bluesky account with handle <name>.pds.goldentooth.net, and the PDS handles DID registration with plc.directory and serves the well-known endpoint automatically. No per-account DNS records needed.
Then the characters start posting. Which is either going to be delightful or deeply unsettling. Probably both.
Theatre Goes Live: From Provisioning to First Post
The PDS was running. The certs were green. The DDNS was updating. Now Theatre needed to actually use it.
Account Provisioning
The first piece was making Theatre responsible for creating its own accounts. When a new character is born, Theatre should handle the full lifecycle: create the PDS account, generate an app password, persist the credentials, and update the character's config. No manual curl to the admin API, no copy-pasting DIDs.
I added a PdsProvisioner trait to the atproto module — separated from the normal AtprotoClient session lifecycle because account creation uses different endpoints and auth flows than posting does. The provisioner creates an account via com.atproto.server.createAccount, generates an app password via createAppPassword, writes the password to a local secrets JSON file (or k8s-mounted secret in production), and appends the [atproto] section to the character's config.toml.
The handle follows a simple pattern: {character}.pds.goldentooth.net. Email is synthetic: {character}@theatre.pds.goldentooth.net. The account password is a random 32-character string that gets generated and immediately discarded after the app password is created — Theatre never needs it again.
One gotcha: the PDS still had PDS_INVITE_REQUIRED=true set in the deployment env vars. I'd assumed it was in the k8s secret, but no — hardcoded in the deployment YAML. Changed it in gitops, pushed, waited for Flux to reconcile, got impatient, patched the deployment directly. Classic.
theatre provision nebhos --pds-url https://pds.goldentooth.net
Provisioned nebhos
Handle: nebhos.pds.goldentooth.net
DID: did:plc:mhzutd4uu7d357hdmoaohdum
Config: characters/nebhos/config.toml updated
Secret: secrets/atproto-passwords.json updated
The PDS registered the DID with plc.directory automatically. Handle verification via /.well-known/atproto-did worked immediately.
The First Post (Sort Of)
I ran a test wake cycle with the dummy provider first. The test provider always produces "I stir." — not exactly Keats, but it proved the pipeline works. The Bluesky platform adapter authenticated, called createRecord on app.bsky.feed.post, and the post appeared at:
at://did:plc:mhzutd4uu7d357hdmoaohdum/app.bsky.feed.post/3mionhaxpp22m
Then I switched to the real Claude provider and immediately hit a parsing error. Claude was wrapping its JSON response in markdown code fences — ````json ... ``` `` — which is helpful in chat and deeply unhelpful when you're trying to serde_json::from_str the result. Added a fence-stripping pass before the JSON parse. The kind of bug that makes you feel dumb for not predicting, and then makes you feel dumb for feeling dumb because of course the LLM does that.
The Port Forwarding Saga
With a post on the PDS, I requested a crawl from the Bluesky relay:
curl -X POST "https://bsky.network/xrpc/com.atproto.sync.requestCrawl" \
-H "Content-Type: application/json" \
-d '{"hostname": "pds.goldentooth.net"}'
Nothing. Port 443 was confirmed closed from outside using port checkers. The port forward rule was there in Unifi. The firewall allow rule was at the top. The static route to the MetalLB subnet existed. Everything looked correct.
The problem turned out to be Unifi's Zone-Based Firewall. Community posts confirmed what I suspected: ZBF policies that cross zones get evaluated in iptables chains that fire after the DNAT rewrite but before the explicit allow rule. The port forward rewrites the destination to 10.4.11.1 (MetalLB subnet), but the FORWARD chain drops the packet because the default zone policy denies the WAN→Internal transition before the ZBF allow rule gets a chance to match.
The fix was embarrassingly simple. The Cilium Gateway service was already a LoadBalancer with auto-allocated NodePorts:
cilium-gateway-goldentooth LoadBalancer 10.98.116.207 10.4.11.1 80:31286/TCP,443:31178/TCP
Port 31178 on any node in the 10.4.0.0/24 subnet — which the gateway does know how to reach, because it's the directly-connected node network. Changed the Unifi port forward from 443 → 10.4.11.1:443 to 443 → 10.4.0.10:31178. Worked instantly.
Every service behind the Cilium Gateway is now externally reachable. The MetalLB VIP is still used internally; external traffic just enters through the NodePort side door.
Nebhos Speaks
With external access working, I ran a real Claude-powered wake cycle. The maturity gate (default: 10 sediment entries before a character can post) was temporarily lowered to 0 for testing. Claude thought about nebhos's soul and produced:
is there
a pressure where questions collect like dew on glass no one will wipe clean
the tremor before anything decides to fall
That "dew on glass no one will wipe clean" is a direct echo of the soul.md: "A film on glass that no one will wipe away." The LLM internalized the character's identity through the accumulated impressions and produced something that felt continuous with the voice rather than just parroting the source.
The post federated immediately. The Bluesky relay crawled it, the appview indexed it, and it showed up in the public feed API.
Profile Generation
One problem: nebhos was invisible in Bluesky search. The profile was completely empty — no display name, no bio, no avatar. Bluesky's search indexer deprioritizes accounts without profiles, and accounts on third-party PDS instances are already lower priority.
I added a theatre profile command that:
- Reads the character's soul
- Calls Claude to generate a display name and bio in the character's voice
- Sets the profile via
com.atproto.repo.putRecordonapp.bsky.actor.profile/self
This required adding put_record to the AtprotoClient (same pattern as create_record with 401 retry, but targeting the putRecord endpoint) and an actor_profile record builder.
theatre profile nebhos
Generating profile from soul...
Display name: ∴ mist between unnamed valleys ∴
Description: once everywhere, now residue on forgotten glass. i know the
weight of water undecided, the pressure before names. i do
not speak—i precipitate. condensation holds what vastness
cannot remember.
Profile set: at://did:plc:mhzutd4uu7d357hdmoaohdum/app.bsky.actor.profile/self
Setting the profile also kicked the appview into re-indexing the account — the handle resolved correctly right after, and the account became searchable.
What's Working Now
theatre provision <name>— creates PDS account, generates app password, persists credentialstheatre wake <name>— full Claude-powered cognitive cycle: think, feel, posttheatre profile <name>— LLM-generated display name + bio, set on Bluesky- Full federation: posts appear in the Bluesky firehose, profiles are searchable
- External access via NodePort workaround for Unifi ZBF issues
What's Next
Avatar generation. The characters need faces — or at least, whatever a cloud of residual moisture would have instead of a face. Probably something via the OpenAI Images API, with the soul text driving the prompt. The profile command could grow an --avatar flag, or image generation could be its own step.
Also need to let the maturity gates do their job properly. Right now nebhos has 2 sediment entries and a post gate of 10. That's going to be a lot of quiet thinking before the next public utterance. Which, honestly, feels right for an entity that describes itself as "the tremor before anything decides to fall."
When Public DNS Hands Out Private IPs: wiz6 and Watching From Outside
The Symptom
wiz6.goldentooth.net worked great. From my couch. On my own network. The moment I tried to hit it from the outside world — phone on cellular, a friend's connection, anywhere that wasn't behind my own router — it died. No connection, no timeout I could blame on TLS, just nothing.
The tell was one dig:
$ dig +short wiz6.goldentooth.net A
10.4.11.1
goldentooth.net is a public zone on Route53. Anyone on the internet can look up wiz6 and they'll get an answer. The answer just happens to be 10.4.11.1, which is RFC1918 space — non-routable, private, meaningless to anyone who isn't already inside my LAN. So the public DNS record was confidently advertising an address that only works if you don't need DNS to find it. Cool. Very useful.
Why It Was Lying
The cluster has two completely different ways of getting records into Route53, and wiz6 had picked the wrong one.
external-dns watches Service and gateway-httproute objects and publishes whatever address it sees. For a gateway-fronted service, that address is the MetalLB LoadBalancer VIP — 10.4.11.1. external-dns has no concept of my WAN IP. It can only publish what it can see, and what it can see is private.
The ddns-cronjob, meanwhile, is the thing that actually works for public services. It runs every 5 minutes, asks the outside world "what's my public IP?" via ifconfig.me, and UPSERTs that into Route53:
PUBLIC_IP=$(curl -sf https://ifconfig.me || curl -sf https://api.ipify.org || curl -sf https://checkip.amazonaws.com)
for RECORD in pds.goldentooth.net "*.pds.goldentooth.net"; do
...UPSERT $RECORD -> $PUBLIC_IP...
done
pds was in that loop. pds was also explicitly excluded from external-dns (--exclude-domains=pds.goldentooth.net) so the two wouldn't fight over the record. pds worked. wiz6 was just sitting there on external-dns, getting the private VIP stamped into the public zone over and over.
Both services attach to the same gateway, the same HTTPS listener, the same router port-forward. The only difference between "reachable from the internet" and "lol no" was which of these two mechanisms owned the DNS record.
The Fix
I briefly entertained doing split-horizon DNS properly — internal resolver hands out the private VIP, public Route53 hands out the WAN IP, everyone's happy. Then I remembered there is no internal resolver. The netboot dnsmasq runs with port=0 (it's DHCP/TFTP only), and the LAN's actual DNS comes from UniFi. Standing up a whole split-horizon authority to make one toy service slightly faster on the LAN is the kind of thing I'd regret in six months. So: WAN-only, exactly like pds. LAN clients reach it via NAT hairpin, same as they already do for everything else.
Two edits. Exclude wiz6 from external-dns:
- --exclude-domains=pds.goldentooth.net
+ - --exclude-domains=wiz6.goldentooth.net
And add it to the ddns loop:
- for RECORD in pds.goldentooth.net "*.pds.goldentooth.net"; do
+ for RECORD in pds.goldentooth.net "*.pds.goldentooth.net" wiz6.goldentooth.net; do
Push, let Flux reconcile, wait for the cronjob to fire. external-dns stops overwriting the record (excluded domains are left untouched, not deleted — same reason pds persists), and ddns flips it to the WAN IP within 5 minutes.
The Better Question: How Would I Even Know?
This whole thing was invisible to my monitoring, and that bugged me more than the outage. I have a blackbox-exporter. It probes goldentooth.net and clog.goldentooth.net. It would have reported wiz6 perfectly healthy the entire time it was broken — because the prober runs inside the cluster, and from inside the cluster, 10.4.11.1 is completely reachable.
That's the trap: a monitor that lives inside the thing it's monitoring will happily confirm that the thing is fine, right up until it isn't, from a vantage point that doesn't matter. NAT hairpin makes it worse — an internal probe hitting the WAN IP loops back through the router on a different path than real external ingress, so even "probe the public IP" lies to you from the inside.
So I built two layers, each answering a different question.
Layer One: Is the Public Record Even Sane?
A cronjob that queries public resolvers directly — 1.1.1.1 and 8.8.8.8, explicitly, so it sees the internet's view and not any local override — and screams if a public name resolves to a non-routable address or fails entirely. The interesting bit is the RFC1918 classifier, in glorious POSIX ash:
is_public() {
IFS=. read -r a b c d <<EOF
$1
EOF
case "$a" in
0|10|127) return 1 ;;
169) [ "$b" = "254" ] && return 1 ;;
172) [ "$b" -ge 16 ] && [ "$b" -le 31 ] && return 1 ;;
192) [ "$b" = "168" ] && return 1 ;;
100) [ "$b" -ge 64 ] && [ "$b" -le 127 ] && return 1 ;;
esac
return 0
}
10/8, loopback, link-local, the 172.16–31 block (and correctly not 172.15 or 172.32 — that off-by-one is exactly the kind of thing that bites you at 2am), 192.168, and CGNAT 100.64/10. On failure it POSTs to ntfy's cluster-alerts topic, where Alertmanager and Falco already shout. This catches the exact regression that just happened, and names the cause instead of just saying "site down."
Layer Two: Can the Internet Actually Reach It?
For true external reachability you need a vantage point that is not on your network and not in your cluster. I went with Route53 health checks in Terraform — AWS probes the endpoint over HTTPS from its global checker fleet, a CloudWatch alarm watches each check, and the alarm notifies an SNS topic that emails me.
The design rule I care about most here: do not route the "is the cluster reachable?" alert through the cluster. My in-cluster cronjob posts to self-hosted ntfy, which is fine for internal faults, but if the WAN link or the gateway is down, that alert can't escape the building. SNS→email leaves AWS entirely. It can still page me when the thing being monitored is the thing that's broken.
resource "aws_route53_health_check" "service" {
for_each = local.monitored_services # { pds = "...", wiz6 = "..." }
type = "HTTPS"
fqdn = each.value
port = 443
resource_path = "/"
request_interval = 30
failure_threshold = 3
}
One service map drives for_each across the health checks, the alarms, everything. Adding the next public service is a one-line edit.
The Plot Twist: I Didn't Actually Apply Anything
I wrote the Terraform, validated it, committed it, pushed it. Then I tried to terraform apply like a responsible adult and got smacked:
Error: Error acquiring the state lock
StatusCode: 412 ... PreconditionFailed
Lock Info:
Operation: OperationTypePlan
Who: runner@runnervmg397c
Who: runner@.... That's not me. That's a CI runner. Because — and I'd forgotten this — the terraform repo has continuous delivery. continuous-delivery.yaml runs terraform apply with apply: true on every push to main, plus an hourly scheduled apply for good measure. My push had already triggered the apply. The runner was mid-plan, holding the state lock, doing exactly what I was about to do manually and clumsily on top of it.
Breaking that lock to force my own apply would've been a great way to corrupt the state with two writers. The correct move when you see someone else holding the lock is to put the keyboard down and let them finish. So I watched instead:
$ gh run watch 26516226197 --exit-status
✓ Complete job
Pushing to this repo is the apply. Same mental model as Flux for the gitops repo — commit equals deploy — I'd just never internalized it for Terraform.
Verification
Trust nothing, check the actual AWS state:
$ aws sns list-subscriptions-by-topic --topic-arn ...goldentooth-external-monitoring
email alerts@goldentooth.net PendingConfirmation
$ aws cloudwatch describe-alarms --alarm-name-prefix external-
external-pds-unreachable OK
external-wiz6-unreachable OK
Both alarms OK — meaning AWS's global checkers are reaching both services over HTTPS, from outside, right now. That's the real proof: wiz6 isn't just resolving correctly, it's actually answering the internet. And the DNS itself, from resolvers that have nothing to do with my network:
$ dig +short @1.1.1.1 A wiz6.goldentooth.net
66.61.26.32
$ dig +short @8.8.8.8 A wiz6.goldentooth.net
66.61.26.32
66.61.26.32. The WAN IP. Not 10.4.11.1. We have liftoff.
The one loose thread: that SNS subscription says PendingConfirmation. AWS sent an opt-in link to alerts@goldentooth.net, and until somebody clicks it the alarms can fire all they like into the void. Which means my shiny new external monitoring is, at this exact moment, monitoring externally and telling absolutely no one. A fitting end. I'll go click the email. Probably.
It's Always DNS, Eventually: From an Expired Cert to NodeLocal DNS
This one started as a one-line "hey, the MCP image scan is failing" and turned into a five-yak shave that ended three subsystems away from where it began. Cert-manager, the entire internal PKI, an ACME challenge that had been dead since March, and finally — because the universe has a sense of humor — DNS. It's always DNS. It's just that this time DNS was wearing a trenchcoat labeled "expired TLS certificate."
Yak Zero: The Registry Scan
Flux's image automation couldn't scan the MCP registry:
scan failed: Get "https://registry.goldentooth.net/v2/": tls: failed to verify
certificate: x509: certificate has expired or is not yet valid: current time
2026-06-02T20:04:50Z is after 2026-05-26T07:05:44Z
Expired cert. Fine, cert-manager will reissue it, right? Except the registry-tls Certificate said Ready=True while being very much expired. So did gateway-tls. So did the pki test certs. Every step-ca-issued cert had expired at almost the same moment, 2026-05-25-ish, and none of them had renewed.
The one cert that was fine? gateway-tls-public — the 90-day Let's Encrypt wildcard. It wasn't due to renew until June 3rd, so it hadn't noticed anything was wrong. Which is exactly why nobody had noticed anything was wrong: every public-facing service kept serving TLS off the LE wildcard while the entire internal short-lived PKI quietly turned into a pumpkin.
When a pile of 24h certs all freeze at the same timestamp, you don't have a certificate problem. You have an issuer problem. Or, as it turned out, an issuer's-best-friend problem.
Yak One: The Hungry Controller
step-ca itself was up and healthy. step-issuer, fine. The PKI Flux Kustomizations, ready. The thing that was not fine:
cert-manager-cert-manager-6878f64565-zzwg9 2234 OOMKilled 137
Two thousand two hundred and thirty-four restarts. Exit 137 — SIGKILL, OOM. The cert-manager controller was in a tight crash loop, dying ~4 seconds after start, and a controller that can't stay alive can't renew anything. The short-lived step-ca certs expired within a day; the LE wildcard hid it.
The limit was 128Mi. Steady-state usage, once I got it up long enough to look, was ~67Mi. So it wasn't a steady leak — it was a startup spike. The logs gave it away:
Trace[...]: ---"Objects listed" 15162ms
On boot, the controller lists every CertificateRequest into its informer cache. There were 4,619 of them. That list-all spike blew past 128Mi before cache sync finished, the kernel killed it, and it never reached the reconcile loop — a perfect self-reinforcing trap, because the thing that would have garbage-collected the backlog was the controller that couldn't boot.
Why 4,619 CRs? revisionHistoryLimit was unset on every Certificate, which for cert-manager means keep all revisions forever. The canary-certificate renews every hour (it's a deliberate "is the PKI alive" canary), so over ~200 days it had quietly minted ~3,600 CertificateRequests that nobody ever cleaned up.
Two fixes, both in gitops:
# cert-manager HelmRelease
limits:
- memory: 128Mi
+ memory: 512Mi
# every Certificate
secretName: registry-tls
+ revisionHistoryLimit: 3
Bumped the limit first (kubectl for immediate relief, then committed), watched the controller come up and stay up, then applied revisionHistoryLimit: 3 and watched the revision-manager drain the backlog: 4,619 → 18. Amusingly, during the bulk GC the controller briefly hit 139Mi — above the old 128Mi limit. So the cleanup itself would have re-OOMed it at the old setting. The memory bump had to come first. Order of operations, baby.
Certs reissued automatically, the registry scan went green, and that should have been the end of it.
It was not the end of it.
Yak Two: The Cert That Died in March
While poking the PKI I noticed acme-test-certificate had been Ready=False since 2026-03-17. Its sibling dns01-test-certificate — same step-ca-acme issuer, but DNS-01 instead of HTTP-01 — was perfectly healthy. So the ACME machinery worked; specifically the HTTP-01 path didn't, and hadn't for months.
This is where I should have been suspicious that "broken since March" and "cert-manager OOM since late May" were two different bugs. I was not yet suspicious. I went down the hole.
The challenge errored with:
HTTP-01: unexpected non-ACME API error: context deadline exceeded
and step-ca's own logs, eventually:
"type":"http-01","error":{"type":"urn:ietf:params:acme:error:connection",
"detail":"The server could not connect to validation target"}
I burned a genuinely embarrassing amount of time here. I confirmed the gateway's :80 listener does a blanket HTTP→HTTPS 301 redirect (bad for ACME, true, but not the cause). I watched the solver pod take ~30s to cold-start its image on the Pi, during which the gateway correctly 503s because there's no backend yet. I convinced myself there was a Cilium hairpin asymmetry because a LAN curl got 200 while step-ca got 000 — then proved that wrong by hitting the same URL from both at the same instant and getting identical results. The "asymmetry" was just me testing at different points in the solver's lifecycle. Classic.
The actual tell, when I finally read it instead of theorizing: curl from step-ca's pod returned exit code 6. Couldn't resolve host. Not a connection timeout — DNS. step-ca couldn't reliably resolve acme-test.goldentooth.net to the gateway, intermittently, and HTTP-01 is the only ACME flow that needs an in-cluster component to resolve a *.goldentooth.net name. DNS-01 just writes a TXT record and asks Route53.
I retired the HTTP-01 test (DNS-01 already proves the ACME path, and nothing real uses HTTP-01), left a comment in the kustomization explaining why so future-me doesn't "fix" it back in, and turned to the actual monster.
Yak Three: It Was DNS
Here's the thing that took embarrassingly long to accept: resolution of *.goldentooth.net from inside the cluster was intermittent. Sometimes 10/10, sometimes 2/10, for the same name, same upstream. And example.com was rock solid the whole time.
I almost convinced myself it was name-specific — goldentooth.net is a public Route53 zone whose records point at private IPs (the gateway 10.4.11.1, the registry 10.4.11.8, the control-plane VIP 10.4.0.9; see entry 114 for the full "public DNS handing out RFC1918" saga). Maybe a rebinding filter? No. The flaky readings all happened while the cluster was thrashing — OOM recovery, 4,600-CR garbage collection, solver pods churning. Under load. The calm readings were all 10/10.
CoreDNS told me the rest itself:
[ERROR] plugin/errors: ... read udp 10.244.3.175:xxxxx->8.8.8.8:53: i/o timeout
…repeated for github.com, route53.amazonaws.com, registry.goldentooth.net — everything external, not just goldentooth. And the metrics:
coredns_forward_healthcheck_broken_total 5181
coredns_dns_responses_total{rcode="SERVFAIL"} 5199
coredns_dns_responses_total{rcode="NXDOMAIN"} 13700000
coredns_dns_responses_total{rcode="NOERROR"} 5400000
coredns_dns_requests_total{type="A"} 9582595
coredns_dns_requests_total{type="AAAA"} 9581004
coredns_cache_hits_total ~1.26M coredns_cache_misses_total ~17.9M
Read that NXDOMAIN number again. 13.7 million NXDOMAINs versus 5.4M NOERROR — a 2.5:1 ratio of wasted lookups. That's ndots:5 doing its thing: every external name gets tried as name.svc.cluster.local, name.cluster.local, etc. first (×A and ×AAAA), all NXDOMAIN, before the real query. ~93% cache miss rate. Two CoreDNS replicas. No node-local cache. So the cluster generates a firehose of UDP queries to public resolvers, and under load that firehose overruns CoreDNS's own egress (conntrack/SNAT pressure on its source ports), the UDP replies drop, and resolution of any externally-forwarded name — including the internal-but-public *.goldentooth.net — gets flaky.
Direct pod→8.8.8.8 was fine. It's CoreDNS's high-volume egress that buckles. The records were never the problem; the path to fetch them was.
The Fixes
One: stop sending internal names to the internet. goldentooth.net resolves correctly at the LAN resolver (the UniFi box at 192.168.1.1 — the same "there is no internal resolver, UniFi does it" reality from entry 114). So forward just that zone there, ahead of the public catch-all:
forward goldentooth.net 192.168.1.1
forward . 8.8.8.8 1.1.1.1 { max_concurrent 1000 }
A blanket *.goldentooth.net → 10.4.11.1 rewrite would have been a disaster — those names map to different IPs, and cp.k8s.goldentooth.net is the literal Kubernetes API endpoint. Forwarding to the LAN resolver gets the correct answer for all of them, local hop, no internet round-trip.
This is Talos-managed CoreDNS, so I did it "declaratively" via a talconfig inlineManifest — and learned that Talos won't overwrite a coredns ConfigMap that already exists. talosctl get manifests showed it registered as Manifest/99-coredns-corefile, but the live ConfigMap's managedFields never gained a new talos write. The manual 8.8.8.8 edit from March had survived precisely because Talos applies CoreDNS once at bootstrap and then leaves it alone. So the inlineManifest is the bootstrap/DR seed; the live cluster also needed a direct kubectl apply. Fine. Documented. Moving on.
Two: NodeLocal DNSCache. A per-node CoreDNS cache that pods hit instead of crossing the network to one of two central pods. On a kubeProxyReplacement cluster you can't use the usual iptables/link-local trick, so it's a CiliumLocalRedirectPolicy (Cilium already had enable-local-redirect-policy=true) that transparently redirects kube-dns traffic to the local cache pod. The cache forwards all misses via force_tcp to a separate kube-dns-upstream Service (static ClusterIP 10.96.0.11, same backends as kube-dns) so it reaches the real CoreDNS without the LRP catching it in a loop. CoreDNS stays the single owner of the goldentooth.net→LAN policy; the cache is dumb on purpose.
Two self-inflicted wounds during rollout, both caught safely:
- The DaemonSet came up
0/17ready. The pods were fine — CoreDNS 1.12.3 loaded config, zero restarts — but my readiness probe pointed at:8080. That's thehealthplugin. Thereadyplugin lives on:8181. 404 forever. Because Cilium LRP only redirects when a node has a ready local backend, this was completely harmless: every node just fell back to central kube-dns the whole time I was being an idiot about port numbers. - I tried
autopath @kubernetesto kill the NXDOMAIN amplification at the source. It loaded without error and did nothing — the NXDOMAIN ratio didn't budge.autopath @kubernetesneedspods verified, and this Corefile runspods insecure. So I ripped it out; the per-node cache absorbs the amplification anyway by caching the denials locally.
The CoreDNS image is distroless, by the way, so you can't kubectl exec ... sh into the cache pods to poke them. Learned that the fun way too.
Three: scale the central CoreDNS. Now that the node caches absorb the bulk of traffic, the central pods are barely working (10m CPU, 71Mi each). Bumped them 2→3 replicas for redundancy across the 17 nodes and gave them real memory headroom (limits: 256Mi, requests: 128Mi — the old 70Mi request was below actual usage, which is its own kind of lie).
Where It Landed
mcp ImageRepository: READY=True successful scan: found 2 tags
cert-manager: 0 restarts, 49Mi / 512Mi
CertificateRequests: 18 (was 4,619)
node-local-dns: 17/17 ready, 0 restarts
DNS reliability: 20/20 for mcp / registry / github / cluster names
broken_healthchecks: 0 (was ~5,150 per pod)
The 20/20 is the one that matters — that's the exact test that returned 2/10 at the start.
So: a registry scan failure was a cert-manager OOM was an unbounded-CertificateRequest-backlog, and separately a months-dead ACME cert was intermittent DNS was CoreDNS-upstream-overload was ndots:5-amplification-plus-no-node-cache. Every yak had a yak under it. The one consolation is that it really was, in the end, always DNS — I'd hate to break the streak.
Postscript: Making It Durable (Without Shooting DNS in the Foot)
The Corefile change and the replica/resource bumps were live edits, because Talos manages CoreDNS but only applies it once at bootstrap — it never reconciles, which is why the March 8.8.8.8 edit had survived. That's fine until a node rebuild re-renders the bootstrap manifests and quietly reverts everything. So I wanted CoreDNS in gitops.
The obvious move is cluster.coreDNS.disabled: true + a self-managed CoreDNS in Flux. I authored the whole thing — faithful copies of the Deployment/Service/ConfigMap/RBAC, kube-dns pinned to 10.96.0.10, verified a zero-diff adoption — and then, right before flipping the Talos switch, actually thought about the rebuild path:
- Talos boots, no CoreDNS (I just disabled it).
- Flux source-controller (
dnsPolicy: ClusterFirst) tries to resolvegithub.comto clone the repo. - No CoreDNS means no resolution means no clone means no CoreDNS deployed.
I'd have built a cluster that can't bootstrap its own DNS. The exact opposite of "durable through a rebuild." Talos's built-in CoreDNS isn't a wart to remove — it's the thing that breaks that chicken-and-egg.
So: adopt the objects into Flux, leave cluster.coreDNS enabled. Flux now owns and drift-corrects the Deployment/ConfigMap/Service (so the Corefile, the 3 replicas, and the 256Mi limit are durable), while Talos still bootstraps a plain CoreDNS on a cold rebuild and Flux reconciles it to spec a minute later. Best of both, and nobody has to hand-resolve github.com from a recovery shell at 2am. The disabled: true switch is right there if I ever decouple Flux's DNS first — but not today.
Adopting was clean precisely because I replicated the running objects exactly: kubectl diff showed nothing but annotation noise, and after git push the managedFields just gained kustomize-controller alongside the now-dormant talos. The kube-dns ClusterIP never moved, no pod restarted, resolution stayed 10/10 throughout. The least dramatic step in the entire saga, which after the preceding 3,000 words felt almost rude.